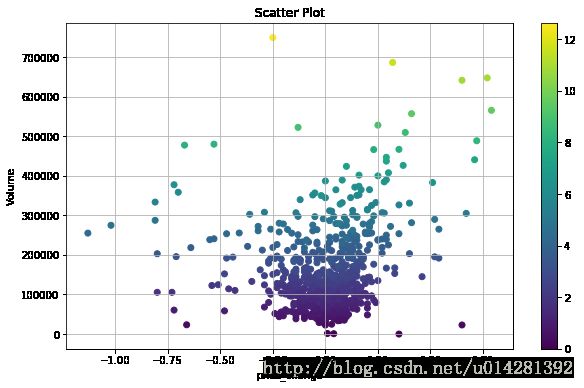
散点图在金融图表中也经常用到,来对金融时间序列数据进行可视化
import matplotlib as mpl
import tushare as ts
import matplotlib.pyplot as plt
%matplotlib inline
meiling = ts.get_hist_data('000521','2012-01-01')
meiling.info()
plt.figure(figsize=(10,6))
plt.scatter(meiling['price_change'], meiling['volume'],c= meiling['turnover'], marker='o')
plt.colorbar()
plt.grid(True)
plt.xlabel('price_change')
plt.ylabel('Volume')
plt.title('Scatter Plot')
mat_meiling = meiling.as_matrix()
plt.figure(figsize=(10,6))
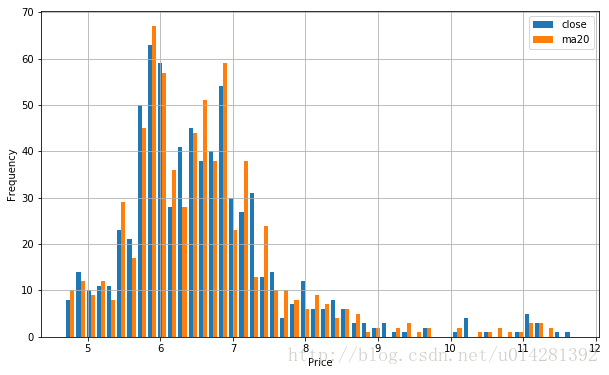
plt.hist(mat_meiling[:,[2,7]], label=['close','ma20'], bins=50)
plt.grid(True)
plt.xlabel('Price')
plt.ylabel('Frequency')
plt.legend(loc=0)
plt.hist()参数
x, 必须是列表对象或者ndarray对象
bins, 数据组的数量
range, 数据组上下界
normed, 规范化为整数一
weights, x轴上每个值的权重
cumulative, 每个数据组包含前数据组的计数
histtype, 可选'bar','barstacked','step','stepfilled'
align, 可选'left','mid','right'
orientation, 可选'horizontal','vertical'
rwidth 矩形相对宽度
log 对数刻度
color, 数据集的颜色
label, 数据集的标签列表
stacked, 堆叠多个数据默认为False
plt.figure(figsize=(10,6))
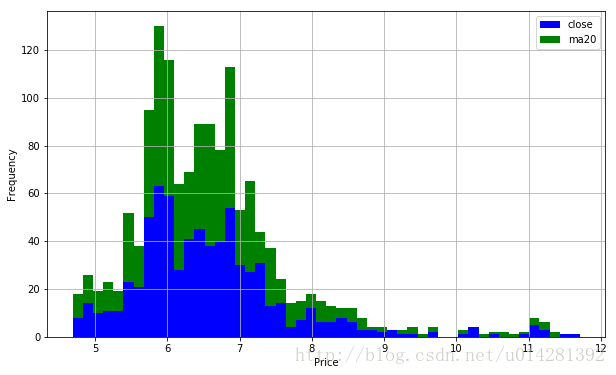
plt.hist(mat_meiling[:,[2,7]], label=['close','ma20'], color=['b','g'], stacked=True, bins=50)
plt.grid(True)
plt.legend(loc=0)
plt.xlabel('Price')
plt.ylabel('Frequency')
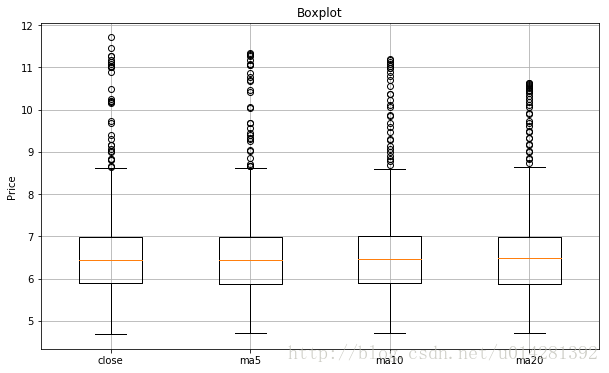
箱形图,可以简洁的概括出数据的特点
fig, ax = plt.subplots(figsize=(10,6))
plt.boxplot(mat_meiling[:,[2,7,8,9]])
plt.setp(ax, xticklabels=['close','ma5','ma10','ma20'])
plt.ylabel('Price')
plt.grid(True)
plt.title('Boxplot')
3D绘图
import matplotlib as mpl
import numpy as np
import tushare as ts
import matplotlib.pyplot as plt
from mpl_toolkits.mplot3d import Axes3D
%matplotlib inline
data = ts.get_hist_data('000520','2017-05-01')
data[:3]
|
open |
high |
close |
low |
volume |
price_change |
p_change |
ma5 |
ma10 |
ma20 |
v_ma5 |
v_ma10 |
v_ma20 |
turnover |
| date |
|
|
|
|
|
|
|
|
|
|
|
|
|
|
| 2017-06-22 |
6.05 |
6.12 |
5.93 |
5.93 |
208646.98 |
-0.24 |
-3.89 |
5.994 |
6.016 |
5.896 |
184798.66 |
137050.85 |
117687.91 |
2.06 |
| 2017-06-21 |
5.86 |
6.45 |
6.17 |
5.86 |
417674.03 |
0.31 |
5.29 |
6.024 |
6.017 |
5.882 |
160692.81 |
125899.51 |
113080.97 |
4.13 |
| 2017-06-20 |
5.88 |
5.96 |
5.86 |
5.84 |
108470.15 |
-0.08 |
-1.35 |
6.002 |
5.997 |
5.869 |
97083.63 |
100541.90 |
95995.89 |
1.07 |
mat_data = data.as_matrix()
ma5 = mat_data[:, 7]
ma10 = mat_data[:, 8]
close = mat_data[:, 2]
m5, m10 = np.meshgrid(ma5, ma10)
m5
array([[ 5.994,  6.024,  6.002, ...,  6.414,  6.412,  6.406],
       [ 5.994,  6.024,  6.002, ...,  6.414,  6.412,  6.406],
       [ 5.994,  6.024,  6.002, ...,  6.414,  6.412,  6.406],
       ...,
       [ 5.994,  6.024,  6.002, ...,  6.414,  6.412,  6.406],
       [ 5.994,  6.024,  6.002, ...,  6.414,  6.412,  6.406],
       [ 5.994,  6.024,  6.002, ...,  6.414,  6.412,  6.406]])
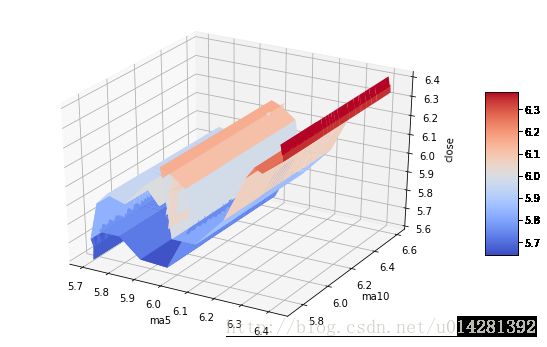
fig = plt.figure(figsize=(10,6))
ax = fig.gca(projection='3d')
surf = ax.plot_surface(m5, m10, close, cmap=plt.cm.coolwarm, linewidth=0.5, antialiased=True)

ax.set_xlabel('ma5')
ax.set_ylabel('ma10')
ax.set_zlabel('close')
fig.colorbar(surf, shrink=0.5, aspect=5)
matplotlib展厅:http://matplotlib.org/gallery.html
matplotlib2D绘图教程:http://matplotlib.org/users/pyplot_tutorial.html
matplotlib3D绘图教程:http://matplotlib.org/mpl_toolkits/mplot3d/tutorial.html


