Python做函数拟合
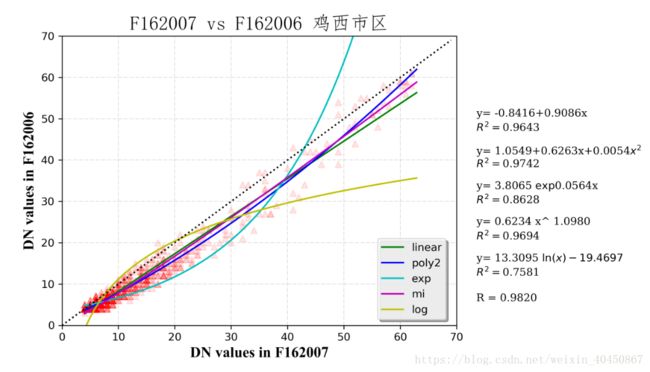
读一幅影像指定位置的一些点与另外一幅图相同位置的点做拟合,包括一次函数、二次函数、指数函数、幂函数、对数函数,计算R方,并绘制散点图,在图上显示保存为图片。
# -*- coding: utf-8 -*-
"""
Created on Mon Jul 23 14:40:18 2018

@author: Administrator
"""

import gdal
import os
import numpy as np
import matplotlib.pyplot as plt
#import matplotlib.gridspec as gridspec
import scipy.stats as stats
#from sklearn import linear_model
from scipy.optimize import curve_fit
from matplotlib import rcParams
rcParams['savefig.dpi'] = 300
#from sklearn.metrics import mean_squared_error, r2_score
#from sklearn.pipeline import Pipeline
#from sklearn.preprocessing import PolynomialFeatures

def image(path):
    dataset = gdal.Open(path)
    band = dataset.GetRasterBand(1)
    nXSize = dataset.RasterXSize #列数
    nYSize = dataset.RasterYSize #行数
    data= band.ReadAsArray(0,0,nXSize,nYSize).astype(np.float)
    return data
def getListFiles(path):
    assert os.path.isdir(path),'%s not exist,'%path
    ret=[]
    for root,dirs,files in os.walk(path):
        for filespath in files:
            ret.append(os.path.join(root,filespath))
    return ret

a=getListFiles("F:\\DMSPchuli\\1.proj\\")
files=[]
paras={}
dR2={}
for i in a:
    if (i[-3:]=="dat"):
        files.append(i)

f1="F:\\DMSPchuli\\1.proj\\F162007_proj.dat"
#f1为参考影像
#files= ["F:\\DMSPchuli\\proj\\F101992_proj.dat" ]

#f1= "F:\\DMSPchuli\\projsub\\xixili\\F121999.dat"
#f2="F:\\DMSPchuli\\projsub\\xixili\\F121998.dat"
#indeximage=image("F:\\DMSPchuli\\projsub\\xixili\\xixili10.dat" )
def writeimage(dst_filename,data):
    filename=f1
    dataset=gdal.Open(filename)
    projinfo=dataset.GetProjection()
    geotransform = dataset.GetGeoTransform()
    format = "ENVI"
    driver = gdal.GetDriverByName( format )
    dst_ds = driver.Create( dst_filename,dataset.RasterXSize, dataset.RasterYSize,
                           1, gdal.GDT_Float32 )
    dst_ds.SetGeoTransform(geotransform )
    dst_ds.SetProjection( projinfo )
    dst_ds.GetRasterBand(1).WriteArray( data )
    dst_ds = None
fileslist=[]
for f2 in files:
    indeximage=image("F:\\DMSPchuli\\important\\cityindexj.dat")
    light=image(f1)
    index=np.where(indeximage==1)
    light1=image(f2)
    jx1=light[index]
    jx2=light1[index]
    del light,light1,indeximage
    nozeroindex=np.where((jx1>0) &(jx2>0))
    jxnz1=jx1[nozeroindex]
    jxnz2=jx2[nozeroindex]

    x=jxnz1
    y=jxnz2


    #相关系数
    corre=stats.pearsonr(x,y)


    #一次函数
    def fun1(x,a,b):
        return a+b*x
    #二次函数
    def fun2(x,a,b,c):
        return a+b*x+c*x*x
    #指数
    #def fune(x, a, b,c):
    #    return a * np.exp(b * x) + c
    #幂函数
    def funm(x,a,b):
        return a*(x**b)
    #对数
    def funlog(x,a,b):
        return a*np.log(x)+b

    #计算R2
    def R2(y_test, y_true):
        return 1 - ((y_test - y_true)**2).sum() / ((y_true - y_true.mean())**2).sum()
    x_=np.arange(x.min(),x.max()+1,0.1)
    #popt数组中,三个值分别是待求参数a,b,c
    popt1, pcov = curve_fit(fun1, x, y)
    y_1 = [fun1(i, popt1[0],popt1[1]) for i in x_]
    popt2, pcov = curve_fit(fun2, x, y)
    y_2 = [fun2(i, popt2[0],popt2[1],popt2[2]) for i in x_]
    popt3, pcov = curve_fit(fun1, x, np.log(y))
    y_3 = [np.exp( popt3[0]+popt3[1]*i) for i in x_]
    popt4, pcov = curve_fit(funm, x, y)
    y_4 = [funm(i, popt4[0],popt4[1]) for i in x_]
    popt5, pcov = curve_fit(funlog, x, y)
    y_5 = [funlog(i, popt5[0],popt5[1]) for i in x_]
    R21=R2([fun1(i, popt1[0],popt1[1]) for i in x] ,y)
    R22=R2([fun2(i, popt2[0],popt2[1],popt2[2]) for i in x],y )
    #R23=R2([np.exp( popt3[0]+i*popt3[1]) for i in x],y )
    R23=R2([fun1(i, popt3[0],popt3[1]) for i in x] ,np.log(y))
    R24=R2([funm(i, popt4[0],popt4[1]) for i in x],y )
    R25=R2([funlog(i, popt5[0],popt5[1]) for i in x],y)

    font = {'family' : 'Times New Roman',
            'color'  : 'black',
            'weight' : 'normal',
            'size'   : 14,
            }
    fontf = {'family' : 'Serif',
            'color'  : 'black',
            'weight' : 'normal',
            'size'   : 10,
            }
    fontt = {'family' : 'FangSong',
            'color'  : 'black',
            'weight' : 'normal',
            'size'   : 18,
            }
    fontz = {'family' : 'Times New Roman',
            'color'  : 'black',
            'weight' : 'normal',
            'size'   : 10,
            }
    #画图
    fig = plt.figure(figsize=(9,5))
    #ax1 = fig.add_subplot(111)
    ax1=plt.subplot2grid((1,4),(0,0),colspan=3)
    f1i,f2i=f1.rfind("F"),f2.rfind("F")

    ax1.set_title(f1[f1i:f1i+7]+" vs "+f2[f2i:f2i+7]+u" 鸡西市区",fontdict=fontt)
    #plt.grid(True)

    #ax1.text(0.65,0.2,"y = "+str(round(k,4))+s0+str(round(b,4)),transform=ax1.transAxes)
    #ax1.text(0.65,0.15,"R21 = "+str(round(R21,4)),transform=ax1.transAxes)
    #ax1.text(0.65,0.1,"R22 = "+str(round(R22,4)),transform=ax1.transAxes)
    #相关系数
    p=0.2
    q=1.05
    ax1.text(q,p-0.09,"R = "+"%.4f"%corre[0],  horizontalalignment='left',
            verticalalignment='top',transform=ax1.transAxes,fontdict=fontf)
    #一次函数
    ax1.text(q,p+ 0.55,"y= "+"%.4f"%popt1[0]+"%+.4f"%popt1[1]+"x",
             horizontalalignment='left', verticalalignment='top',
             transform=ax1.transAxes,fontdict=fontf)
    ax1.text(q,p+0.5,r"$R^2=$"+"%.4f"%R21,  horizontalalignment='left',
            verticalalignment='top',transform=ax1.transAxes,fontdict=fontf)
    #二次函数
    ax1.text(q,p+0.425,"y= "+"%.4f"%popt2[0]+"%+.4f"%popt2[1]+"x"+
             "%+.4f"%popt2[2]+r"$x^2$",
             horizontalalignment='left', verticalalignment='top',
             transform=ax1.transAxes,fontdict=fontf)
    ax1.text(q,p+0.375,r"$R^2=$"+"%.4f"%R22,  horizontalalignment='left',
            verticalalignment='top',transform=ax1.transAxes,fontdict=fontf)
    #指数函数
    ax1.text(q,p+0.3,"y= "+"%.4f "%(np.exp(popt3[0]))+r"$\exp$"+"%.4f"%popt3[1]+"x",
             horizontalalignment='left', verticalalignment='top',
             transform=ax1.transAxes,fontdict=fontf)
    ax1.text(q,p+0.25,r"$R^2=$"+"%.4f"%R23,  horizontalalignment='left',
            verticalalignment='top',transform=ax1.transAxes,fontdict=fontf)
    #幂函数
    ax1.text(q,p+0.175,"y= "+"%.4f "%popt4[0]+r"x^ "+"%.4f"%popt4[1],
             horizontalalignment='left', verticalalignment='top',
             transform=ax1.transAxes,fontdict=fontf)
    ax1.text(q,p+0.125,r"$R^2=$"+"%.4f"%R24,  horizontalalignment='left',
            verticalalignment='top',transform=ax1.transAxes,fontdict=fontf)
    #对数函数
    ax1.text(q,p+0.05,"y= "+"%.4f "%popt5[0]+r"$\ln (x) "+("%+.4f"%popt5[1])+"$",
             horizontalalignment='left', verticalalignment='top',
             transform=ax1.transAxes,fontdict=fontf)
    ax1.text(q,p,r"$R^2=$"+"%.4f"%R25,  horizontalalignment='left',
            verticalalignment='top',transform=ax1.transAxes,fontdict=fontf)
    plt.xlabel('DN values in '+f1[f1i:f1i+7],fontdict=font)
    plt.ylabel('DN values in '+f2[f2i:f2i+7],fontdict=font)

    #plt.plot(x,y,'r.')
    #colors = np.random.rand(len(jxnz1))
    plt.plot(x_,y_1,'g-')
    plt.plot(x_,y_2,'b-')
    plt.plot(x_,y_3,'c-')
    plt.plot(x_,y_4,'m-')
    plt.plot(x_,y_5,'y-')
    plt.scatter(x, y,c='r',marker='^',alpha=0.1)
    plt.legend(('linear', 'poly2', 'exp','mi', 'log'),
               shadow=True, loc=(0.8, 0.02))
    #添加y=x
    xxx=np.arange(0,70)
    plt.plot(xxx,xxx,'k:')

    plt.axis([0, 70, 0,70],fontdict=fontz)
    plt.grid(color='k', alpha=0.2, linestyle='dashdot', linewidth=0.5)

#    plt.show()
    print("--"*9,"R = ",corre[0],"--"*9)
    print("y=a+bx:\n",popt1[0]," ",popt1[1],"\n","R2: ",R21,"\n","--"*20)
    print("y=a+bx+cx^2:\n",popt2[0]," ",popt2[1]," ",popt2[2],"\n","R2: ",R22,"\n","--"*20)
    print("y=a*exp(bx):\n",np.exp(popt3[0])," ",popt3[1],"\n","R2: ",R23,"\n","--"*20)
    print("y=a*b^x:\n",popt4[0]," ",popt4[1],"\n","R2: ",R24,"\n","--"*20)
    print("y=a*ln(x)+b:\n",popt5[0]," ",popt5[1],"\n","R2: ",R25,"\n","--"*20)
    plt.savefig("F:\\DMSPchuli\\pic723\\"+f1[f1i:f1i+7]+" vs "+f2[f2i:f2i+7]+".png")
    paras[f2[f2i:f2i+7]]=[popt2[0],popt2[1],popt2[2]]
    dR2[f2[f2i:f2i+7]]=R22
    fileslist.append(f2[f2i:f2i+7])
某个结果如下图:
