数据挖掘--数据预处理(1)
这篇博客总结在数据挖掘,数据预处理阶段常用的方法和技巧,对于kaggle和天池的比赛和适用
import pandas as pd

train_pd = pd.read_csv(path+'training.csv') #读取数据
test_pd = pd.read_csv(path+'sorted_test.csv')

train_pd.info()#查看数据类型
train_pd.describe()#数值型变量的统计信息
train_pd.describe(include=['O'])#String, object类型变量的统计信息

train_pd[['PIDN', 'Depth']]#获取dataframe里的特定列

X_train = train_pd.drop(['PIDN','SOC','pH','Ca','P','Sand'],axis=1)#删除dataframe特定列

X_train['Depth'] = X_train['Depth'].map({'Topsoil':0.0, 'Subsoil':1.0}).astype(float)#把某列里的string类型转为float

train_pd.isnull().sum()#查看每一列,值为空的数据的数量

Y_submit = pd.DataFrame(Y_pred, columns=['Ca','P','pH','SOC','Sand'])#numpy array转成dataframe并且加上对应的列名

Y_submit.insert(loc=0, column='PIDN', value=sample[['PIDN']])#dataframe 按列号插入列(第一列)

Y_submit.to_csv(path+'submission.csv', index=False)#dataframe转excel
#SVR模型的输出只能是一维的,使用MultiOutputRegressor能处理多维输出
from sklearn.svm import SVR
from sklearn.multioutput import MultiOutputRegressor

clf = SVR(gamma='scale', C=1.0, epsilon=0.2)

multi_clf = MultiOutputRegressor(clf)
#划分验证数据集
x_train, x_valid, y_train, y_valid = train_test_split(X_train, Y_train, test_size=0.33, random_state=123)
#按分组以平均值替换缺失值
processed_df['Age'] = processed_df.groupby(['Pclass','Sex','Parch','SibSp'])['Age'].transform(lambda x: x.fillna(x.mean()))

#对title列里的Lady...值全部替换成Rare
dataset['Title'] = dataset['Title'].replace(['Lady', 'Countess','Capt', 'Col',\
 	'Don', 'Dr', 'Major', 'Rev', 'Sir', 'Jonkheer', 'Dona'], 'Rare')

#把Title列里的String类型替换为对应的数值型变量
title_mapping = {"Mr": 1, "Miss": 2, "Mrs": 3, "Master": 4, "Rare": 5}
for dataset in combine:
    dataset['Title'] = dataset['Title'].map(title_mapping)
    dataset['Title'] = dataset['Title'].fillna(0)


#将某列的连续性数值转换为离散型数值
for dataset in combine:
    dataset.loc[ dataset['Age'] <= 16, 'Age'] = 0
    dataset.loc[(dataset['Age'] > 16) & (dataset['Age'] <= 32), 'Age'] = 1
    dataset.loc[(dataset['Age'] > 32) & (dataset['Age'] <= 48), 'Age'] = 2
    dataset.loc[(dataset['Age'] > 48) & (dataset['Age'] <= 64), 'Age'] = 3
    dataset.loc[ dataset['Age'] > 64, 'Age']
#评估模型质量
def plot_confusion_matrix(y_true, y_pred, classes,
                          normalize=False,
                          title=None,
                          cmap=plt.cm.Blues):
    """
    This function prints and plots the confusion matrix.
    Normalization can be applied by setting `normalize=True`.
    """
    if not title:
        if normalize:
            title = 'Normalized confusion matrix'
        else:
            title = 'Confusion matrix, without normalization'

    # Compute confusion matrix
    cm = confusion_matrix(y_true, y_pred)
    # Only use the labels that appear in the data
    #classes = classes[unique_labels(y_true, y_pred)]
    if normalize:
        cm = cm.astype('float') / cm.sum(axis=1)[:, np.newaxis]
        print("Normalized confusion matrix")
    else:
        print('Confusion matrix, without normalization')

    print(cm)

    fig, ax = plt.subplots()
    im = ax.imshow(cm, interpolation='nearest', cmap=cmap)
    ax.figure.colorbar(im, ax=ax)
    # We want to show all ticks...
    ax.set(xticks=np.arange(cm.shape[1]),
           yticks=np.arange(cm.shape[0]),
           # ... and label them with the respective list entries
           xticklabels=classes, yticklabels=classes,
           title=title,
           ylabel='True label',
           xlabel='Predicted label')

    # Rotate the tick labels and set their alignment.
    plt.setp(ax.get_xticklabels(), rotation=45, ha="right",
             rotation_mode="anchor")

    # Loop over data dimensions and create text annotations.
    fmt = '.2f' if normalize else 'd'
    thresh = cm.max() / 2.
    for i in range(cm.shape[0]):
        for j in range(cm.shape[1]):
            ax.text(j, i, format(cm[i, j], fmt),
                    ha="center", va="center",
                    color="white" if cm[i, j] > thresh else "black")
    fig.tight_layout()
    return ax

from sklearn.metrics import confusion_matrix
from sklearn.metrics import accuracy_score

lg = LogisticRegression(solver='lbfgs', random_state=42)
lg.fit(X_train, Y_train)

logistic_prediction = lg.predict(X_test)

score = metrics.accuracy_score(Y_test, logistic_prediction)
#display_confusion_matrix(Y_test, logistic_prediction, score=score)

confusion_matrix(Y_test, logistic_prediction)#绘制混淆矩阵
acc_score = accuracy_score(Y_test, logistic_prediction)
title = 'Accuracy Score: %f' % acc_score

plot_confusion_matrix(Y_test, logistic_prediction, classes=['0','1'] ,title=title)
#K折交叉验证评估模型
from sklearn.model_selection import cross_val_score

n_folds = 10
cv_score_lg = cross_val_score(estimator=lg, X=X_train, y=Y_train, cv=n_folds, n_jobs=-1)
cv_score_dt = cross_val_score(estimator=dt, X=X_train, y=Y_train, cv=n_folds, n_jobs=-1)
cv_score_svm = cross_val_score(estimator=svm, X=X_train, y=Y_train, cv=n_folds, n_jobs=-1)
cv_score_rf = cross_val_score(estimator=rf, X=X_train, y=Y_train, cv=n_folds, n_jobs=-1)

cv_score_ann = cross_val_score(estimator=KerasClassifier(build_fn=build_ann,batch_size=16,epochs=20,verbose=0),
                              X=X_train, y=Y_train, cv=n_folds, n_jobs=-1)

cv_result = {'lg':cv_score_lg, 'dt':cv_score_dt, 'svm':cv_score_svm, 'rf':cv_score_rf,
            'ann':cv_score_ann}
cv_data = {model: [score.mean(), score.std()] for model, score in cv_result.items()}
cv_df = pd.DataFrame(cv_data, index=['Mean_accuracy', 'Variance'])
cv_df
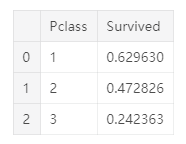
#若处理的是二元分类问题,可以这样来判断某个特征与label之间的相关性
train_df[['Pclass', 'Survived']].groupby(['Pclass'], as_index=False).mean().sort_values(by='Survived', ascending=False)
from sklearn.metrics import classification_report
classification_report(y_test, predictions)#查看模型训练效果
![]()
# Function to calculate correlations with the target for a dataframe
def target_corrs(df):

    # List of correlations
    corrs = []

    # Iterate through the columns
    for col in df.columns:
        print(col)
        # Skip the target column
        if col != 'TARGET':
            # Calculate correlation with the target
            corr = df['TARGET'].corr(df[col])

            # Append the list as a tuple
            corrs.append((col, corr))

    # Sort by absolute magnitude of correlations
    corrs = sorted(corrs, key = lambda x: abs(x[1]), reverse = True)

    return corrs
def count_categorical(df, group_var, df_name): #处理离散特征值,获取其counts and normalized counts
    """Computes counts and normalized counts for each observation
    of `group_var` of each unique category in every categorical variable

    Parameters
    --------
    df : dataframe
        The dataframe to calculate the value counts for.

    group_var : string
        The variable by which to group the dataframe. For each unique
        value of this variable, the final dataframe will have one row

    df_name : string
        Variable added to the front of column names to keep track of columns


    Return
    --------
    categorical : dataframe
        A dataframe with counts and normalized counts of each unique category in every categorical variable
        with one row for every unique value of the `group_var`.

    """

    # Select the categorical columns
    categorical = pd.get_dummies(df.select_dtypes('object'))

    # Make sure to put the identifying id on the column
    categorical[group_var] = df[group_var]

    # Groupby the group var and calculate the sum and mean
    categorical = categorical.groupby(group_var).agg(['sum', 'mean'])

    column_names = []

    # Iterate through the columns in level 0
    for var in categorical.columns.levels[0]:
        # Iterate through the stats in level 1
        for stat in ['count', 'count_norm']:
            # Make a new column name
            column_names.append('%s_%s_%s' % (df_name, var, stat))

    categorical.columns = column_names

    return categorical


