IBM Security Guardium V10的新增功能
编者注:有关V10.1.2的更新和增强,请参阅较新的文章“新的和增强的Guardium离群值检测”。
主要版本-这就是原因!
今天的数据保护世界比以往任何时候都更加复杂。 数据收集持续增长,并且更加动态。 由于数据是如此珍贵,因此它会随着用于不同目的的移动和发展,从在线交易或Web应用程序到数据集市和仓库进行业务报告,再到大数据平台进行深入分析或长期存储。
数据以多种方式使用,因此越来越多的用户和开发人员正在使用此数据。 并非所有人都考虑安全性,他们也不具备从头开始构建安全性的编码技能。 因此,更重要的是,在这种新的,风险更高的环境中,最接近数据的数据保护层要胜任工作。
在版本10中,IBM Security Guardium被正式重命名为IBM Security产品组合的一部分,这反映了全球安全组织对数据保护的重视。 IBM Security Guardium不仅仅是重命名,它在智能和自动化方面也迈出了重要的一步,以保护数据。 重点放在使解决方案在动态IT环境中更具适应性和更易于使用的能力,同时继续发展其分析和情报功能以及覆盖范围,例如文件系统数据保护。
图1. Guardium数据保护任务
本文是对版本10的新增功能和更改的技术概述,包括作为10.1的一部分提供的增强功能,这些增强功能于2016年6月3日开始普遍提供。除了对新功能的描述,文件活动监视之外,大多数功能这里介绍的内容针对对现有功能有一定了解的经验丰富的Guardium用户。 与往常一样,请通过发行说明监视更新,以了解通过服务流或次要发行版提供的其他更改。 通过加入IBM developerWorks上的Guardium社区,随时了解Guardium的最新信息。
通用平台增强
用于数据库,数据仓库,文件系统和应用程序的Guardium解决方案建立在一个通用平台上。 本节描述了通用平台中的增强功能:
- 改善用户体验
- 增强分析和调查能力
- 分类增强
- 合规加速器现已成为基础平台的一部分
- 支持CIDR表示法
- 新的备份位置选项:SoftLayer对象存储
- 设备更新
改善用户体验
版本10的主要重点是现代化和简化用户界面,这项工作将在后续发行版中继续进行。 本节涵盖以下增强功能:
- 您会看到的第一件事...
- 基于方案的任务流,用于发现和保护敏感数据
- 简单的用户界面定制
- 简化的报告管理和发现
- 简化的审核流程构建器
- 服务状态仪表板以及合并的支持和维护视图
- 更轻松地查找和管理数据源
- 在托管环境中改善易用性
您会看到的第一件事...
首次安装Guardium时,您会注意到它具有由现代技术支持的新外观。 让我们看一下您将看到的一些更改。
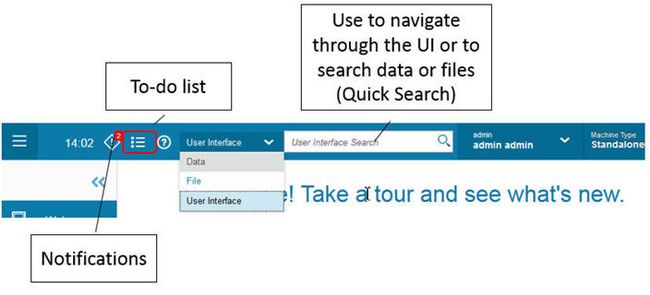
标语是功能强大的控制中心,具有警报,待办事项和增强的搜索栏。 UI搜索栏将是您最好的朋友,可帮助您快速找到名称的工具或报告。
图2.强大的横幅广告可以进行导航和搜索
这些通知将使您了解重要的事情,例如:
- 指向页面的链接,以应用许可证密钥并接受许可证条款(如果尚未安装许可证)
- 内存或处理器或磁盘空间不足
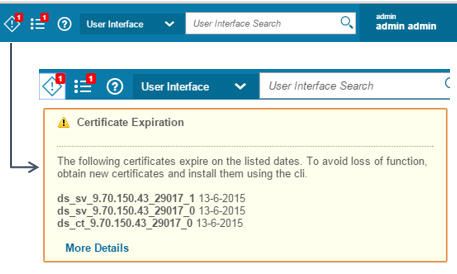
- 证书过期
图3.证书过期通知示例
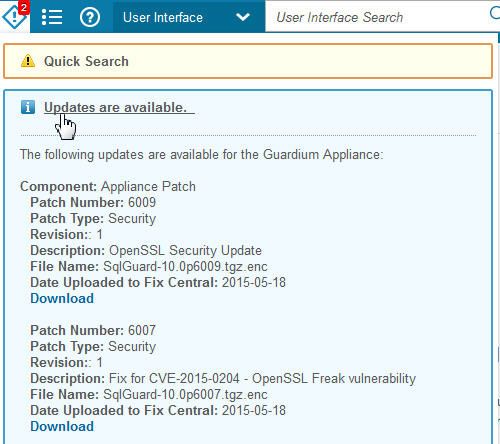
- 软件更新是否可用,并直接链接到IBM支持页面,您可以在其中下载它们,如下图所示:
图4.通知指示可用更新
现在,简化了左侧的导航,并跨管理员和用户角色对其进行了规范化:
图5.导航元素在各个角色中很常见
帮助系统也已经现代化。 它包含您可能已经从ibm.com上的IBM知识中心熟悉的功能,包括改进的导航,更细粒度的打印选项以及大大增强的搜索功能。 您可以从横幅或用户界面中各个页面上的问号图标访问帮助系统。
图6.从Guardium标语访问帮助系统
基于方案的任务流,用于发现和保护敏感数据
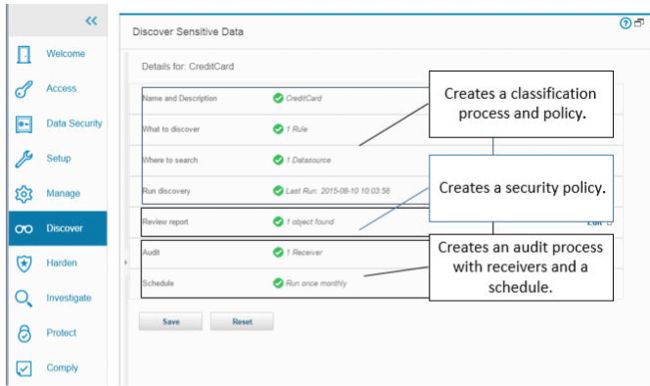
在新的任务流中可以看到Guardium UI采取的方向的一个示例,该任务流将带您通过引导的工作流程从头到尾完成工作,从敏感数据发现到数据保护(定义安全策略)再到合规性(定义审计)。处理); 所有这些都无需用户在用户界面中跳来跳去。
如果您遍历整个工作流程,则会创建相关的工件,例如分类策略,安排分类的审核过程,甚至是具有相关访问规则的安全策略来保护发现的敏感数据。
图7.完成的敏感数据发现过程
简单的用户界面定制
在版本10中,自定义用户界面和管理不同角色的权限的过程大大简化了。所有操作都集中在一个中央位置,并使用简单的“ slushbucket”方法。
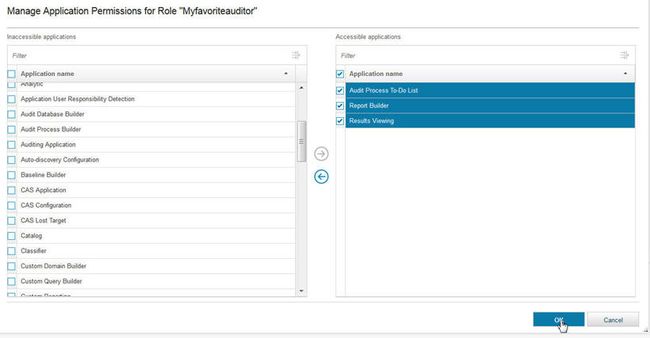
例如,如果您想创建一个非常简单的界面,仅包含针对特定审核员的少量只读报告,则可以快速轻松地完成此操作。 Guardium访问管理器创建一个新角色,称为“ Myfavoriteauditor”。 对于该角色,Guardium访问管理器转到“ 管理权限” ,并向用户授予非常有限的权限,如下图所示,其中包括“审核流程任务列表”,“报表生成器”和“结果查看”。
图8.管理角色的权限
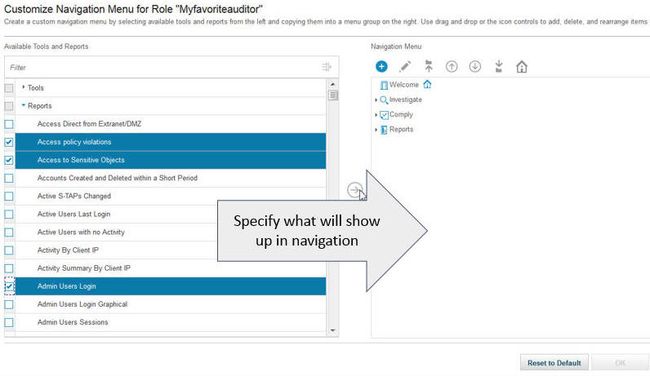
然后,访问管理器转到该角色的“ 定制导航菜单 ”,并指定“ Myfavoriteauditor”可以看到哪些报告。
图9.自定义角色的导航菜单
现在,当为用户分配“ Myfavoriteauditor”角色时,他们将仅在登录时看到简化的导航。
图10. Guardium用户界面很容易定制
在10.1中,添加了以下权限管理增强功能:
- 授予特定报表权限的能力。
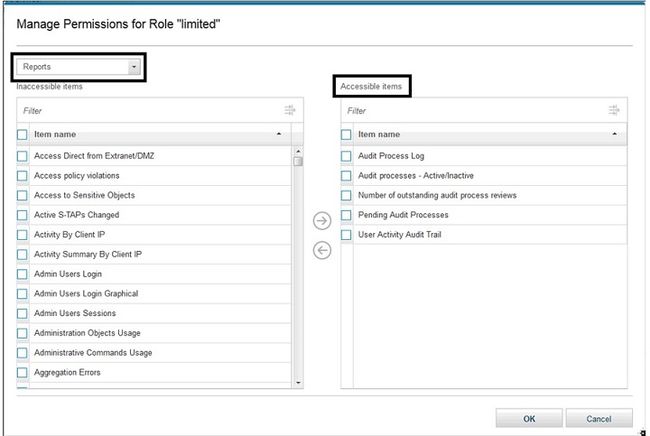
现在,您可以指定某些角色只能看到某些报告。 下面的示例显示,角色为“受限”的人员将仅看到指定的五个报告,而不能将任何其他报告添加到其仪表板。
图11.授予特定报告的权限
- 管理功能的更精细的权限管理。
为了改善对管理功能的控制,V10.1中删除了管理控制台应用程序ID,并用19个更细粒度的ID代替。 这使管理员可以更仔细地选择并选择哪些角色应具有执行诸如安装策略和创建检查引擎之类的权限。
简化的报告管理和发现
Guardium包括数百个内置报告和灵活的报告功能,可让您创建所需数量的自定义报告。 大量报告会使查找自己的重要报告更具挑战性。
版本10引入了“我的仪表板”的概念。 仪表板是用户个性化的空间,您可以在其中放置报告并组织报告以便于访问。 每个用户都可以命名仪表板,并根据需要创建任意数量的仪表板。
下图显示了导航菜单中的“ 我的仪表板 ”。 您可以看到该用户已经创建了多个仪表板,以帮助按主题组织报告。
图12.导航到报告仪表板
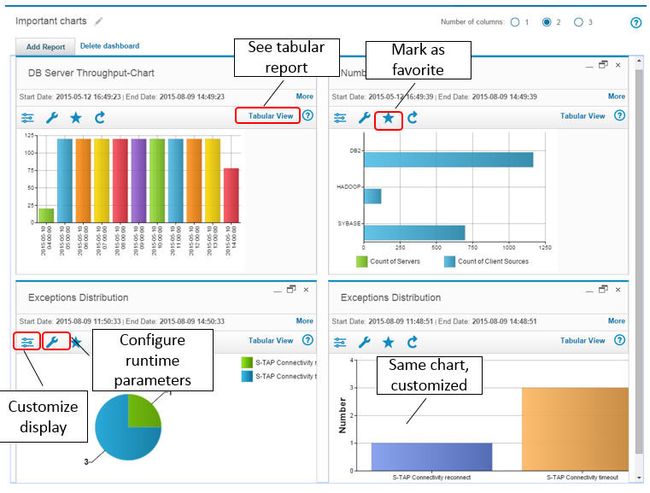
下图显示了一个特别丰富多彩的仪表板,并突出显示了一些小部件,包括自定义现有图形报告的外观,更改运行时参数以及将报告标记为收藏夹。
图13.仪表板示例
通过使用收藏夹,它使您可以在审核过程中或创建新的仪表板时过滤报表,从而无需向下滚动数百个报表或设计自己的命名方案,以确保报表可以过滤到报表的顶部。清单。
将报表添加到仪表板时,可以通过在需要从列表中进行选择的字段中输入前几个字符来按名称轻松找到它们。
简化的审核流程构建器
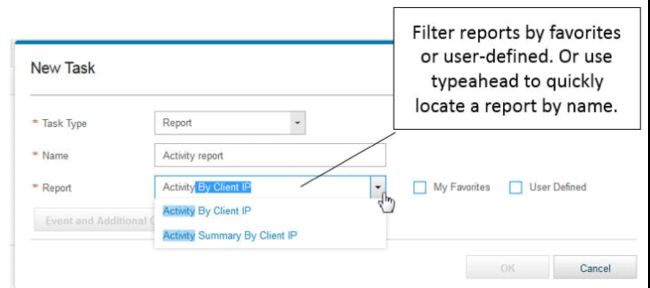
在Guardium中,审计过程用于自动执行许多定期任务,例如报告和扫描,并将结果发送到指定的接收者角色以进行检查或注销。 该构建器经过了改进,可以逐步引导您完成此过程,并包括更智能的默认设置和可用性功能。
例如,在创建报告任务时,您可以过滤收藏夹。 对于报告,安全评估和分类器任务,可以使用预输入来按名称查找报告。
图14.新的审计流程构建器具有许多可用性功能
服务状态仪表板以及合并的支持和维护视图
管理员会喜欢这个新的中心位置,以查看Guardium服务的状态。 它提供了一个一站式启动板,您可以在其中配置服务。
图15.集中式Guardium服务仪表板
现在,支持和诊断工具全部合并在“ 管理” >“ 维护”下,以帮助您维护系统并排除系统故障。
图16.合并维护视图
更轻松地查找和管理数据源
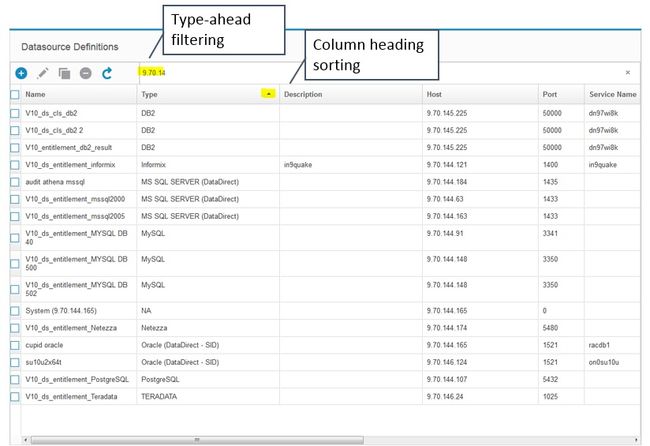
具有成千上万个数据源的企业将特别受益于这种新的数据源管理界面。 您可以快速对该表进行过滤和排序,以按类型,名称或其他典型特征查找数据源。 您也可以从新的数据源管理界面创建,编辑,复制和删除数据源。
要访问新界面,请导航至设置 > 工具和视图 > 数据源定义 。
图17.查找和管理数据源
在托管环境中改善易用性
Guardium具有联合架构,以支持可伸缩性和可管理性。 这种体系结构依靠中央管理器为管理员提供用于管理和控制的单个控制台。 在10.1中,进行了多项增强,以使Guardium管理员的工作更加轻松,并提高了整体效率和效率。
概览部署运行状况
在10.1中,管理员可以一目了然地查看托管环境中是否存在问题,并在问题变得更糟之前加以解决。
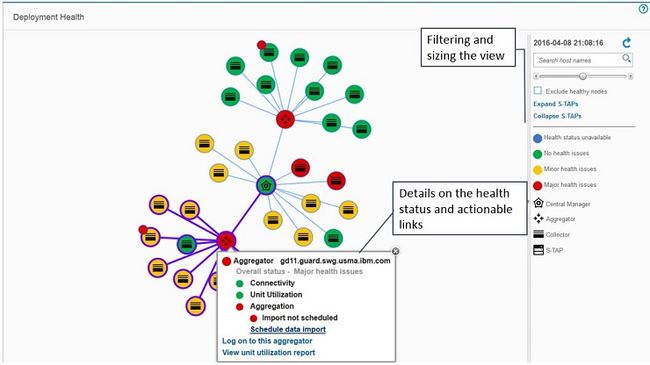
下面的截图是此部署的健康观点,你可以从一个中央管理器导航到管理 > 系统视图 > 部署卫生看到的一个例子。
图18.中央管理运行状况视图
正确配置后,该视图将根据数据导入和导出配置显示节点之间的父子关系。 悬停在节点上将基于连接性,单元利用率和聚合提供有关特定运行状况诊断的更多详细信息。
例如,以下收集器详细信息显示此单元遇到磁盘使用方面的日益严重的问题,并且没有计划的聚合。 通过快速解决此问题,管理员可以在问题变得更严重之前解决此问题。
图19.详细的健康状态和可行的链接
还存在一个健康状况的表格视图,如下图所示。 该表格视图提供了所有详细信息的平面视图,具有可排序的列,并且还可以导出为CSV格式。
图20.表格健康视图
更灵活的配置下推
Guardium旨在进行集中管理,包括能够从单个Central Manager控制台将配置信息推送到受管理单元,而无需更改CM配置本身。 在V10.1之前,此过程可能很复杂,并且没有企业所需的灵活性。
现在,管理员可以使用简单的向导为某些类型的配置创建配置配置文件,并指定哪些受管单元组应接收这些配置文件。 以下屏幕快照显示了配置概要文件构建器。
图21.构建要分发的配置文件
在版本10.1中,支持以下配置类型:
- 单位利用率时间表
- 政策安装
- 资料汇入
- 资料汇出
- 警报器
- IP到主机别名
另外,分发运行日志报告将警告管理员配置文件是否被受管单元正确分发和接收。
配置配置文件可以导入和导出。
在托管环境中简化相关警报的管理
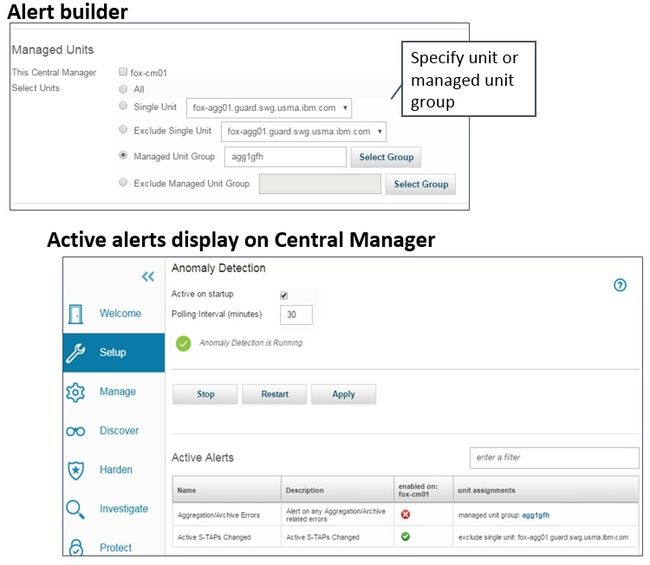
关联警报是Guardium中的一项强大功能,可让您构建可以随时间达到一定阈值的数据库事件触发的警报。 相关警报也经常用于系统事件,以帮助管理员关注系统健康状况。 在10.1中,这些警报的管理要容易得多,因为您可以直接从中央管理器为不同的受管单元(MU)设置单独的警报。 如果您不希望在受管单元上运行特定警报,则需要在该MU上禁用它。
下图显示您可以创建在任何特定单元或一组单元上激活的警报。 异常检测还提供了一个新显示,可以显示部署了哪些警报以及部署在何处。 (在非CM上,显示屏将仅显示该受管单元的警报。)
图22.警报构建器和显示
增强分析和调查能力
Guardium一直在稳定地提供增强功能,以帮助分析师可视化和浏览数据。 Guardium 10.1为数据库和文件活动监视提供了改进的调查功能。 我们不讨论离群值检测,这在另一篇developerWorks文章中已全面介绍。 (请参阅相关主题 。)下面的功能描述如下:
- 快速搜索企业
- 增强型调查仪表板
- 执行概述仪表板,用于数据保护(10.1)
- 攻击威胁检测分析和诊断(V10.1中的新增功能) (本文的“数据库活动监视”部分对此进行了介绍。)
快速搜索企业
此功能是在9.5修补程序中引入的,但是值得重新审视。 以前,“快速搜索”仅适用于每个收集器,要求您知道哪个收集器拥有要搜索的数据。 “企业快速搜索”通过扩展现有的“快速搜索”界面来支持从Central Manager或可能从该环境中的任何Guardium机器跨Guardium环境进行搜索,从而简化了特定数据的标识。
受管环境中的每个收集器都为其自身的数据建立索引。 快速搜索企业版共有三种“模式”:
- 仅CM:
- 这是默认值。 将启用搜索,以便可以从Central Manager提交搜索查询,并从所有启用的收集器返回搜索结果。 也可以从受管单位开始搜索,但仅返回本地结果。
- 所有机器:
- 这使登录到任何收集器,CM或聚合器的用户可以提交搜索查询并从所有收集器获取结果。 请注意,此模式可能导致搜索结果变慢。
- 仅本地:
- 此模式将搜索查询限制为提交搜索的本地计算机。 在Guardium环境中无法从其他计算机获得搜索结果。
使用Guardium API set_enterprise_search_options设置这些模式。
增强型调查仪表板
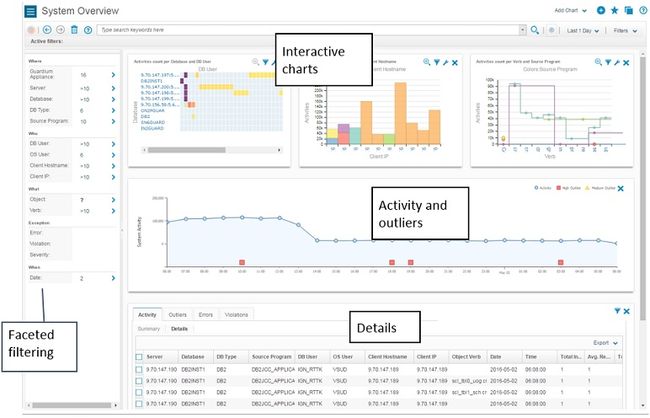
自从首次引入调查仪表板以来,它们就不断发展。 在V10.1中,调查仪表盘得到了增强,以包括新的图表类型和其他功能,例如保存和共享过滤器。
另外,快速搜索数据包含在仪表板上,因此您不再需要在图表和快速搜索之间切换来进行调查。
要访问调查仪表板,有两个选项:
- 导航到“ 调查” >“ 搜索数据活动” (如果具有“文件活动监视”,则搜索“文件活动 ”)。
- 单击用户界面标题中的“ 数据或文件”搜索下拉列表。
调查仪表盘为分析人员提供了一种可视化和交互式的方式,可以与审计数据进行文件和数据库活动的交互。 单击感兴趣的区域,仪表板将被动态过滤,以便您可以深入研究区域。 您还可以创建和保存多个仪表板以支持不同的调查用例,并保存可供其他用户使用的过滤器。
在Guardium YouTube频道上有两个针对特定情况使用调查仪表板的演示。 链接包含在“ 相关主题”中 。
以下仪表板显示了10.1中包含的系统预定义仪表板之一
图23.用于交互式分析的调查仪表板(在10.1中得到了增强)
使用仪表板进行协作
仪表板及其过滤器鼓励组织中的用户之间以及社区中的其他人之间的协作。 过滤器可以是私有的,也可以与组织中的其他人共享,只需指定哪些角色可以使用您保存的过滤器即可。 共享过滤器可以节省时间,因为一个人可以为每个人定义过滤器,您还可以共享过滤器以共享特定的调查案例。 (您可以在过滤器中包括日期/时间,以便其他人可以看到您希望他们看到的确切数据。)
通过导出仪表板定义,可以与其他Guardium用户共享仪表板。 仅仪表板定义被加密并导出,过滤器未加密; 这意味着,如果您的仪表板配置有一组用于调查特定事件类型的图表,则可以与其他Guardium用户共享此知识,而无需包括实际攻击数据或显示过滤器。
新动画图表
V10中添加的动画图表为调查仪表板增加了重要的时间维度。 该调查仪表板可帮助分析人员通过使用动态数据直观地观察一段时间内的活动行为。 此图表使用动画气泡表示过去48小时(最多)的活动。 数据是“自动播放”的,每一帧都是一个小时的时间,可以暂停,就像观看视频时一样。
图表中使用的所有四个维度都是可配置的:气泡,气泡的大小以及X轴和Y轴。 例如,可以将气泡定义为数据库用户,其相对于客户端IP地址数量的位置,相对于ACCESS活动的水平位置以及相对于错误数的垂直位置,如下所示图片。
图24.调查仪表板中的动画图
该视图支持向下钻取的功能; 单击气泡会将选定的数据元素添加到过滤器,并且所有图表都会进行相应过滤。
执行概述仪表板,用于数据保护(10.1)
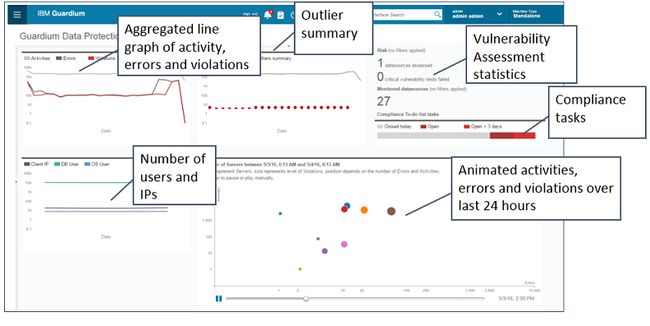
Guardium 10.1版引入了一个新的交互式仪表板,专门用于在安全运营中心或安全主管中显示。 这个新的仪表板(如下图所示)提供了汇总信息,这些信息为CISO提供了有关其当前治理,风险和合规立场的快照视图,并包含以下信息:
- 活动,错误和违规(也显示在动画气泡图中)
- 离群值摘要(汇总离群值信息)
- 数据库用户,操作系统用户和客户端IP的数量
- 风险,基于漏洞评估测试
- 遵从,基于待办事项
图25.数据保护仪表板提供治理,风险和合规性的分析和可视化
该仪表板旨在长时间保持打开状态。 该图表也是交互式的,因此您可以应用搜索过滤器,但是此图表的主要目标是为管理层和高管提供其当前状况的快照,并将后续任务委托给管理员和分析人员。
Guardium YouTube频道上有此仪表板的演示。 请参阅相关主题的链接。
分类增强
如上所述,除了将分类纳入整体工作流程之外,还包括以下增强功能:
- 通过对架构,表和表/列使用“排除组”,可以更好地控制误报。
以前,设置Guardium忽略误报结果以进行将来的分类扫描是一个复杂的过程。 现在,当您查看分类器结果时,您可以轻松地将误报结果添加到排除组,如下图所示,并将该组添加到分类策略中以确保将来的扫描中忽略这些结果。
图26.轻松地将模式,表或列添加到排除组
- 减少数据结果粒度的新选项。
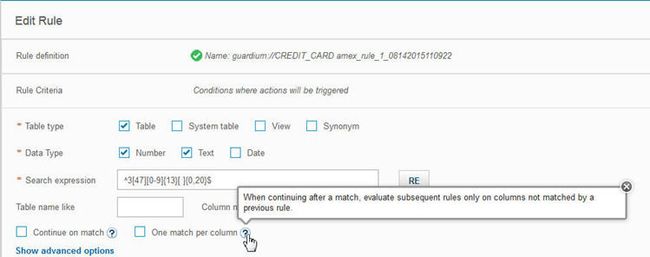
一些组织可能希望对其数据进行调查,以发现哪些表和列包含敏感数据,而不必在该列中查找每种类型的敏感数据。 一个新选项“ 每列一个匹配项”表示,一旦分类器找到该列的匹配项,它将在继续处理时忽略该列。
图27.定制分类器行为的新选项
下表总结了找到与此规则匹配的分类器处理选项。
表1.分类器处理选项
继续比赛 每列一场比赛 结果粒度 没有 不适用 表。 表格中的第一个匹配项之后,分类器将停止处理。 是 是 表和列。 分类器将记录任何给定列的第一个匹配项,此后对于后续规则则将其忽略。 是 没有 详细。 分类器将记录所有规则的所有列的命中。 - 改进的缓存逻辑可提高具有多个规则的任何分类策略的性能。
- 在某些情况下,可以提高Teradata和Oracle分类的性能。 此版本中的优化减少了随机采样所花费的时间,尤其是在正在运行其他进程或不存在表统计信息的情况下。
- 新的CLI命令可以更好地控制超时值:
- 要控制内部查询的超时以收集用于随机搜索的表中的行数,请使用以下CLI命令:
store timeout classifier count_query其中
是秒数(默认为180秒)。 如果查询超时,分类器将恢复为顺序扫描。 - 要控制查询超时以返回样本量的数据,请使用以下CLI命令:
store timeout classifier sample_query其中
是秒数(默认为180秒)。
- 要控制内部查询的超时以收集用于随机搜索的表中的行数,请使用以下CLI命令:
合规加速器现已成为基础平台的一部分
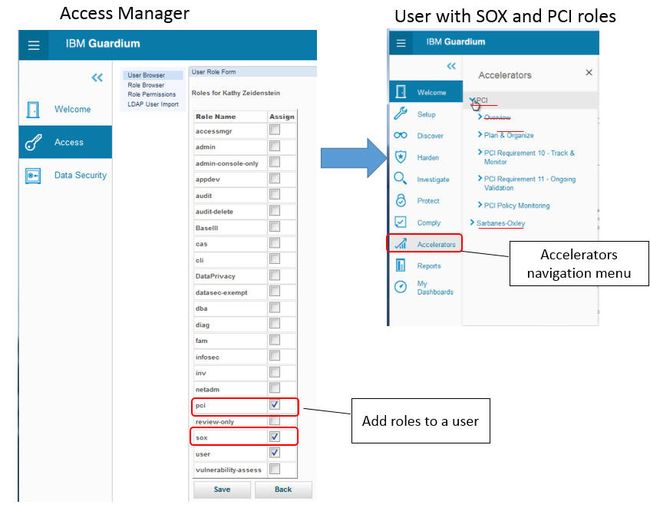
在V10之前,必须使用单独的补丁程序安装合规性加速器(PCI,SOX,Basel II和Data Privacy)。 现在,它们已成为基本产品产品的一部分,可以通过为用户配置任何相应角色(PCI,SOX等)将其添加到用户界面。 下图显示了Guardium访问管理器正在为用户Kathy Zeidenstein提供PCI和SOX角色。 当Kathy登录到Guardium时,她会看到Accelerators导航菜单,并且可以看到两个加速器的内容。
图28.遵从性加速器易于配置
支持CIDR表示法
1993年,创建了无类域间路由(CIDR),并伴随着CIDR表示法。 CIDR表示法是用于指定IP地址及其关联的路由前缀的语法。 它将斜杠字符添加到路由前缀的地址和前导位的十进制数。 例如,IPv4使用192.168.2.0/24,IPv6使用2001:db8 :: / 32(根据Wikipedia。)在Guardium V10之前,不支持CIDR表示法。
为了支持CIDR并在以后的版本中逐步支持IPv6,Guardium掩码字段现在将接受前缀数字或掩码。 稍后显示输入时,它将显示为前缀。 这是您可能在Guardium中看到的输入字段的示例,例如Policy Policy或Access Map Builder 。
图29.可以在UI中使用CIDR表示法
在V10中,您可以在第一个字段中输入1.2.3.4 ,在第二个字段中输入23 ,这将被解释为1.2.3.4/23 。
在第二个字段中输入255.255.254.0是以前在Guardium早期版本中执行的操作。 仍然允许这样做,但是现在更新屏幕时,它将在第二个字段中显示23 。
新的备份位置选项:SoftLayer对象存储
长期存储是满足审核要求的关键考虑因素,审核要求可能需要将审核数据存储长达七年。 归档和备份到云的能力为您提供了另一种非现场存储的选择。
此外,将Guardium设备的配置备份到云对于维护灾难恢复环境很有用,这样,如果本地数据中心发生故障,则可以从存储在云中的映像还原设备的配置。
现在,无论您的Guardium系统是在本地数据中心还是在云中,Guardium都将SoftLayer®Object Storage作为审计数据和配置的存储库来支持。 SoftLayer对象存储可为大量数据提供自我修复存储。 世界各地都有对象存储中心,因此您可以避免跨国家边界移动敏感数据的问题。
图30.在本地和基于云的Guardium系统上,在IBM SoftLayer上存储备份
作业调度依赖性管理
Guardium Collector有许多任务,例如安装正在运行审核过程的策略以及更新计划定期运行的组。 我们将这些过程和任务称为“工作”。 在V10中,Guardium可以检测到作为特定标记作业的先决条件的作业,并在运行标记作业之前按顺序运行这些先决条件作业。 这可以帮助避免计划冲突或在执行标记作业时使用不正确或过时的数据。
通过选中“ 自动运行相关作业 ”复选框,可以在“审核过程生成器”和“策略安装计划程序”中激活此功能。 以下屏幕截图显示了“审核流程构建器”中的此字段。
图31.选择“自动运行依赖作业”来管理该作业的作业依赖
设备更新
设备的硬件配置在很大程度上未更改。 但是,Guardium系统现在基于Red HatLinux®6.5的增强版本,并且只能作为64位平台使用。 不支持从32位平台升级。 您必须使用V10 ISO重建设备,然后应用GPU 100达到10.1。
另一个更改是强制执行以前只是建议在聚合计算机上而不是在收集器上配置中央管理器(CM)的建议。
最后,10.1现在支持新的虚拟机管理程序环境Hyper-V。
文件活动监控-新产品
“文件活动监视”是Guardium产品组合中的一项新的,可单独订购的产品,旨在为敏感文件数据(例如关键知识产权文档)提供安全性和保护-其中包括源代码,财务报告,配置文件等。
用于文件的Guardium活动监视建立在Guardium通用平台上,并且可以与用于数据库的Guardium活动监视相同的设备一起使用,也可以作为独立设备使用。
为什么需要对文件进行活动监视?
在许多情况下需要监视文件的活动,包括:
- 可以通过对应用程序或数据库服务器的后端访问来访问,修改或什至破坏关键的应用程序文件
- 保护包含个人身份信息(PII)或专有信息的文件的要求,同时不影响日常业务
- 阻止后端访问由应用程序管理的文档的要求
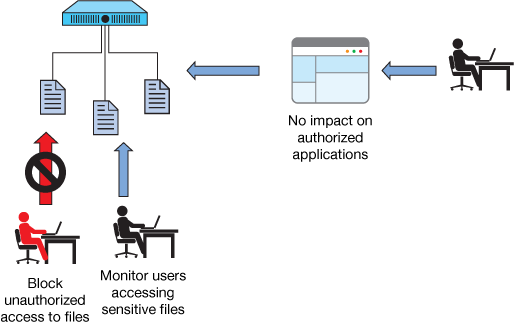
监视和控制不影响业务运营也非常重要。
图32.对文件的活动监视可以防止对应用程序文件或敏感数据的不当访问
文件活动监视概述
文件活动监视在很多方面类似于数据库活动监视。 在这两种情况下,您都将发现服务器上的敏感数据,并配置策略以创建有关数据访问的规则以及在满足规则时应采取的措施。
文件活动监视包含以下功能:
- 发现清单文件和元数据。
- 进行分类以搜寻文件以查找潜在的敏感数据,例如信用卡信息或PII。
- Monitoring , which can be used without discovery and classification, to monitor access to files and, based on policy rules, audit and alert on inappropriate access or even block access to the files to prevent data leakage.
Figure 33. Capabilities of file activity monitoring
File monitoring is supported for a wide variety of Linux platforms (including Power® and S/390® platforms), AIX®, and Windows. Discovery and classification platform support is less extensive.
In 10.1, discovery support was extended to include AIX 6.1 and 7.1. This does not include classification (deep analysis).
Architectural overview
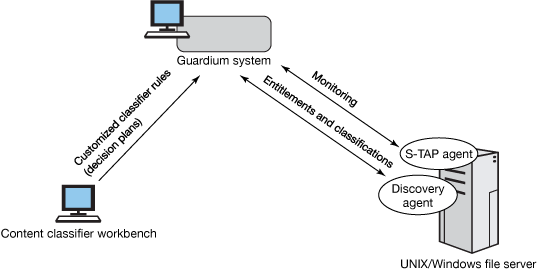
The figure below is a high-level view of the architecture to configure file-activity monitoring capabilities.
Figure 34. High-level architecture of file activity monitoring
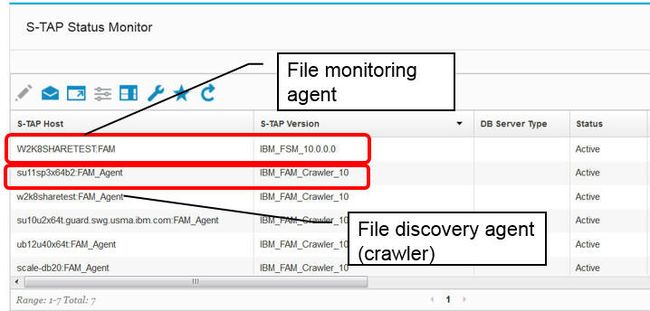
The file system monitoring agent is included in the same bundle as regular database S-TAP® and is distinguished in the Guardium UI with a :FAM suffix appended to the S-TAP host name. The discovery agent, sometimes called the "crawler," is distinguished with the FAM_Agent suffix as shown here.
Figure 35. File activity agents
Discovering files and sensitive data within files
A FAM discovery and classification agent is required if you want to conduct file discovery and classification. It is not required for monitoring activity, but it does require that an S-TAP is already installed on the file server.
Use Guardium Installation Manager to configure this agent to conduct a file discovery (a basic scan) and optional classification. To minimize impact, the scan runs in offline mode and not in real time. Also, after the initial scan, subsequent scans will only pick up new and changed files.
The basic scan includes Owner, Size, Last Change, and Access Privileges to a user or group.
For classification, you use sets of classifier rules known as decision plans . Default decision plans exist for HIPAA, PCI, SOX, and source code and can be activated and configured through the Guardium Installation Manager (GIM).
You can create your own customized decision plans using IBM Content Classification workbench, a Windows™-based system, which is included with Guardium Activity Monitoring for Files. The following screenshot shows the authoring interface.
Figure 36. Workbench to create customized classification rules
Export the newly authored Decision Plans to the Guardium appliance, and use GIM to push them down to the discovery and classification agent.
Viewing discovery and classification results
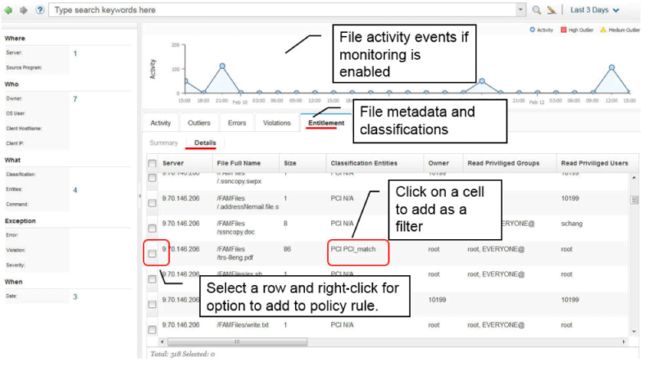
You can see entitlements and classification in online reports or in Quick Search. To view entitlements and classification data for files in Quick Search, choose File in the search drop-down list in the banner. This action opens the Quick Search function and displays file data. The FAM Discovery Agent must be configured to scan and send data to Quick Search.
You can even automatically add discovered files to a security policy rule to set up monitoring, alerting, and blocking.
Figure 37. Classification and file privilege information in quick search
Classification and file privilege information in quick search
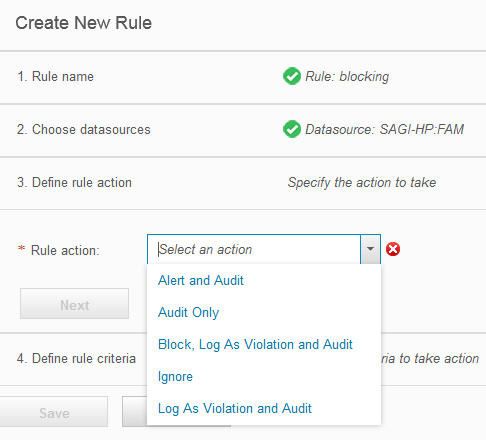
Use security policies to define what actions, if any, that Guardium should take on access to a file or file directory or subdirectories.
An important note if you are familiar with the way Guardium does database activity monitoring: with file monitoring, the rules are pushed to the data source and are evaluated there.
Figure 38. Create a new rule
Actions that you can specify are:
- Alert and Audit
- Send an alert to a designated receiver and log the event.
- Audit only
- Log the event.
- Block, Log as Violation, and Audit
- This blocks access to the file, logs it as a policy violation, and logs the event. It also sends an alert to a designated receiver.
- Ignore
- Ignore this event. This is useful for trusted traffic or applications to reduce the amount of traffic sent to the Guardium system.
- Log as violation and Audit-
- Log this as a policy violation and log the event.
There are several predefined reports that you can use and modify for your own auditing requirements, including a count of activity per client, server, or user.
What's new in activity monitoring for databases
Activity monitoring for databases is the flagship offering in the Guardium portfolio, and provides a wide breadth of capabilities to help you manage your data protection needs, including data discovery and classification, auditing, alerting, compliance workflow, and advanced analytics for proactive detection of threats. Guardium supports a wide variety of relational systems, NoSQL systems, Hadoop-based systems, and data warehouses.
The significant investment in usability and other common platform features are described at the beginning of this article; this section focuses on specific enhancements for Data Activity Monitoring users, including the following:
- Attack threat detection analytics and diagnostics (new in V10.1)
- Enterprise readiness and adaptibility , which includes enterprise load balancing, enhanced instance discovery, and GIM improvements
- Policy-based fine-grained access control
- Using MongoDB as an audit repository
- S-TAP performance and throughput enhancements
- Database platform enhancements
- New S-TAP platforms
Attack threat detection analytics and diagnostics (new in V10.1)
There are a wide variety of database attack mechanisms. In Version 10.1, Guardium includes specialized threat detection analytics that scan and analyze audited data to detect symptoms that may indicate the following database attacks:
- SQL injection , which is usually an attack on the database through improperly coded web applications. These include classic injection techniques such as leveraging the use of escape characters in input fields to inject SQL, blind injection techniques that use automation to piece together information piece by piece based on the logical result of query manipulation, and other SQL injection techniques.
- Malicious stored procedures , such as might be caused by a disgruntled DBA that decides to use a stored procedure to disguise a drop of an important table or extract the contents of a table
Unlike some solutions, Guardium does not rely on comparison against a dictionary of attack signatures, which can change endlessly. Instead, Guardium automates database threat analysis capabilities into the product by analyzing audit data activity, exceptions, and outlier data over time for specific patterns of events that can indicate a SQL injection attack or malicious stored procedure.
Guardium can detect activities that might be suspicious, such as the creation of a stored procedure with a DROP statement with sensitive objects and a DROP verb or SQL exceptions caused by missing objects. Outliers detect that the DBA did something unusual after it was dormant for a while in modifying the stored procedure. Because of the length of time of the attack, and the various different possible events and users, it can be difficult to tie these events together to see the whole picture of the threat. Threat analytics introduces a new, higher level of detection. It tracks the suspicious events over time and correlates them together to create a clearer picture of potential risks.
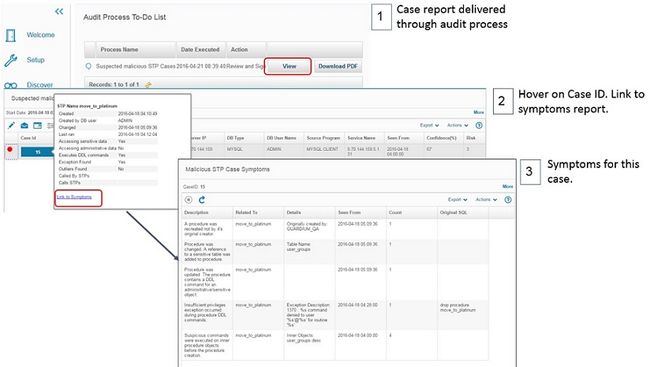
Guardium analyzes symptoms over time, correlates them, and assigns a total score per attack type. If the total score indicates a likely attack, that result becomes a case . Cases are externalized in case reports, which are delivered to analysts by using predefined audit processes that you can tailor. There is one case report for each attack type.
The case report includes a link from each case to the following:
- The detailed symptom report for this specific case. An example is shown here:
Figure 39. Link to case symptoms directly from the case report
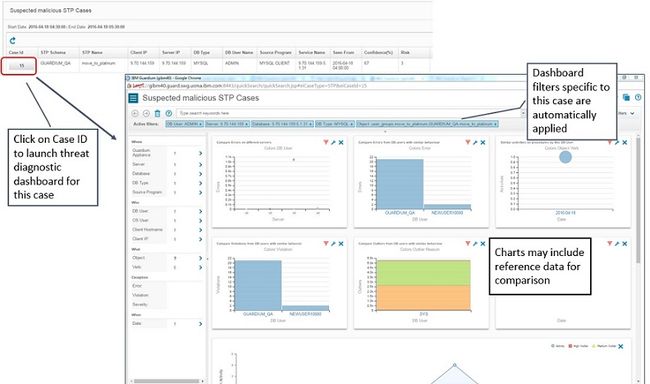
- The investigation dashboard for this specific case. General investigation dashboards were covered in Enhanced analysis and investigative capabilities . These dashboards are tailored for threat detection attack types and are known as threat diagnostic dashboards. Each dashboard launches with the filters set based on best practices for starting an investigation. In addition, specific charts on the dashboard might include reference data , which means data outside of the dashboard filter is included to allow for comparison. The following screenshot is an example of a threat diagnostic dashboard for a suspected malicious stored procedure case.
Figure 40. Link to threat diagnostic dashboard directly from the case report
Note: Currently, threat detection diagnostics are supported only for Oracle, MySQL, and Db2 distributed databases.
Enterprise readiness and adaptibility
Guardium includes capabilities to help automate the management of the Guardium infrastructure. Some enterprise capabilities were covered in the common platform enhancements, such as the new Central Manager deployment health . This section describes the following capabilities:
- Full-featured enterprise load-balancing using Central Manager
- Enhanced instance discovery
- Guardium Installation Manager (GIM) improvements
- Support for OS user and database name in tuple group (10.1)
- Link inspection engine identifiers with logged activity (10.1)
Full-featured enterprise load-balancing using Central Manager
Dynamic load balancing is available in centrally managed environments and reduces the workload on Guardium administrators by automating several tasks that previously required manual tracking and intervention. Dynamic load balancing:
- Eliminates the need to manually evaluate the load of managed units before assigning those managed units to an S-TAP agent.
- Eliminates the need to define fail-over managed units as part of post-installation S-TAP configuration, because the load balancer dynamically manages failover scenarios.
- Eliminates the need to manually relocate S-TAP agents from loaded managed units to less-loaded managed units.
Restrictions: Dynamic load balancing is not supported for z/OS and IBM i S-TAPs.
How enterprise load balancing works
The dynamic load balancer is an application that runs only in the Central Manager (CM). It requires no special configuration to run. The load balancer application is enabled on the Central Manager by setting LOAD_BALANCER_ENABLED=1 . It will only affect the behavior of those S-TAPs that are installed with a value for the load_balancer_IP (or STAP_LOAD_BALANCER_IP if you are using GIM)
10.1 update: In V10.1, the load_balancer_IP can be any managed unit. Previously, it had to be the Central Manager IP. Information that is required for load balancing will be forwarded to the Central Manager by using a proxy on the designated managed unit. This enhancement removes the requirement to open a port between the database server and the Central Manager.
Important: To use the proxy support, you must use a Version 10.1 S-TAP. This capability is not supported in any S-TAP prior to V10.1
The dynamic load balancer performs load collection periodically, which entails getting a snapshot of current activity load for all active managed units and storing it in a load map. This load collection does not affect other activity on the CM. You can specify the load collection by using a fixed interval or dynamical collection. Dynamic collection is the default and recommended setting. With dynamic collection, intervals will be determined by the number of managed units (one additional hour for every 10 managed units). Dynamic intervals will guarantee a more accurate load map without loading the CM with unnecessary load collections.
Figure 41. Central Manager collects snapshots of the current loads on the collectors
If something changes for a particular managed unit that affects its load, such as a reduction or increase in the number of S-TAPs that are connected to it, the load balancer will be notified through a change tracker on the MU and updated information will be sent to the load balancer.
Once the load balancer has the load map, it can make informed decisions about which collectors are best suited to failover, new allocations, or for rebalancing of S-TAPs. (Note that rebalancing can only happen after a full load collection and is controllable via a load-balancer configuration parameter.)
Using groups to manage and control the load balancing environment
It's likely that you have different "zones" for different groupings of database servers/S-TAPs and managed units. You can use the following two types of groups to set up your environment for load balancing:
- S-TAP groups
- MU groups
Figure 42. Use groups to control and manage load balancing
You can create and associate these groups ahead of time in the Central Manager interface. The group names are case-sensitive. For the S-TAP groups, you must specify exactly what you will use to install the S-TAP itself (either the host name or IP). You can use wildcards in your IP addresses, such as 192.168.1.* .
You can also specify these groups during S-TAP installation. (The MU group must exist already. If an S-TAP group doesn't exist at installation, Guardium will create it for you.)
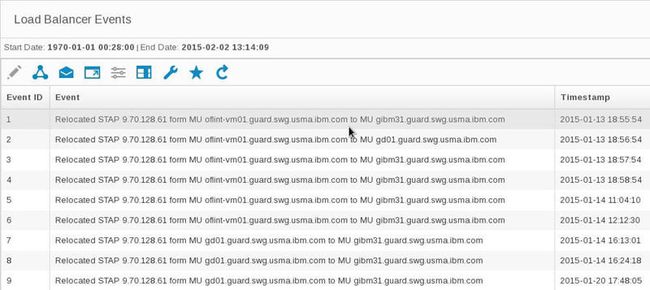
Reporting on load balancing events
Administrators can see whenever rebalancing or failover events have occurred using the S-TAP load balancer report.
Figure 43. Load-balancing event report
In 10.1, there is also a load balancing report that shows a snapshot of the current load distribution. Previously, this data was only available by using GRDAPI commands. Find this report by going to Manage > Reports > Unit Utilization > Load Balancer .
Enhanced instance discovery
Guardium, with auto-discovery enabled, gives you the ability to use the power of S-TAP to discover running instances on that server, including the information that you need to automatically populate the inspection engine definitions. V10 makes it much easier by not requiring Java™ technology or any external libraries to accomplish this task.
To enable instance discovery, use the following flags during S-TAP installation:
- Noninteractive install flag:
-use-discovery - GIM installation: set
STAP_USE_DISCOVERYto 1
When installation is completed, S-TAP will be configured with Inspection Engines for all running databases.
To invoke instance discovery after installation, go to Manage > Activity Monitoring > S-TAP Control and select the Send Command icon as shown in the following screenshot. Notice that you can optionally replace all inspection engines in that S-TAP with the newly discovered configurations.
Figure 44. Run database instance-discovery process to find instances on the server
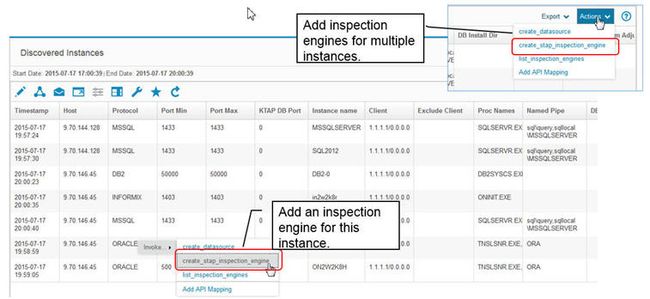
The other option is to review the results in the Discovered Instances report and invoke the create_stap_inspection_engine API for one or more discovered instances.
Figure 45. Create inspection engines directly from Discovered Instances report
Instance discovery is supported for the following database types:
- Sybase
- Oracle
- Teradata
- DB2®
- Informix®
- Postgres
- Netezza®
Guardium Installation Manager (GIM) improvements
GIM eases the burden of maintaining Guardium GIM modules that reside on the database server, such as the configuration audit system agent, the S-TAP, the discovery agent for files, and the discovery module for database instances.
Easier deployment of GIM clients
Before V10, whenever a new database server was configured with the GIM client on it, it was required to know the IP address of the Guardium appliance it was connecting to. For organizations that stand up new database servers, this required additional communication between the DBA and the Guardium administrator, thus slowing down the deployment of the database server with Guardium monitoring.
Now, by using remote activation, a database server can be installed without specifying a Guardium IP address, thereby putting the GIM Client in "listener" mode. Any GIM client in "listener" mode can be remotely activated from a collector ( Manage > Module Installation > Remote Activation ) without requiring additional configuration changes on the database server.
You can also auto-discover any servers that have GIM clients in "listener" mode and then remotely activate any or all of those discovered clients.
In sum, this enhancement enables IT organizations to roll out Guardium on all new servers without requiring further interactions with the Guardium team, which can activate Guardium on the database server on their own.
Improved security by using external certificate authority
Before V10, GIM connections between the database server and the GIM server used Guardium self-signed certificates. With V10, you can now use an external certificate authority to authenticate these connections. It is fully backward compatible with older GIM clients.
GIM client bundles are pre-installed with Guardium self-signed certificates. By default, new installations of GIM clients will attempt to establish secure and authenticated connections with the GIM server over port 8446. You can use your own keys and certificates either by installing the GIM client with the relevant certificate information or by updating it using the GIM GUI or API.
Updating keys/certificates throughout a large site can be a long process. During that time there might be a mismatch between the GIM server and GIM client's keys/certificates. When the GIM client fails to connect to a GIM server (appliance) over port 8446 (secured and authenticated), it will switch to the traditional secured port 8444 and write an event in the GIM Events report.
Support for OS user and database name in tuple group (10.1)
10.1 supports the addition of OS user and database name in tuple-groups used in policy rules. This provides finer granularity for determining which connections would fire a policy rule. The following figure shows the 7-tuple condition in the policy rule builder and examples of what some of the members of the 7-tuple group might look like.
Figure 46. Using 7-tuples in policy and what the group members look like
It's a good idea for this capability to only be used when strictly required as the operation can impact performance on the appliance.
The 7-tuples are only supported for Windows and UNIX® S-TAPs.
Link inspection engine identifiers with logged activity (10.1)
Some organizations would like a reliable and possibly user-defined way to link database activity with the particular inspection engine/database server. Existing methods such as using the port may not always provide the needed information, such as for local connection traffic. Some people may want to use their own identifiers so they can link activity in a meaningful way to downstream systems, such as inventory systems.
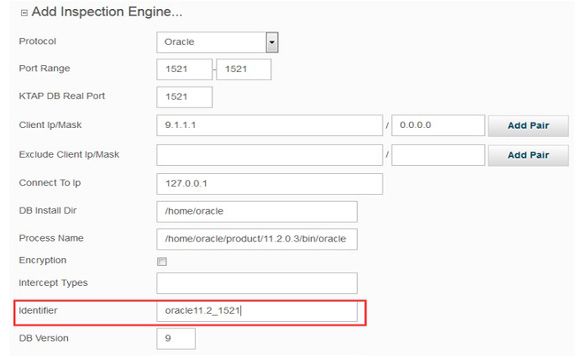
In 10.1, the Tap identifier field for the inspection engine (which you can specify in the S-TAP Control panel of the user interface, as shown below, or in the guard_tap.ini file) will be included in the session traffic sent to Guardium. If no identifier is specified, Guardium creates one based on the inspection engine parameters.
Figure 47. Adding an identifier in the inspection engine configuration of S-TAP Control UI
To pull the identifier information into your access domain reports, add the Tap Identifier attribute from the session entity as shown here. (The identifiers in this report are all system defined.)
Figure 48. Adding the inspection engine identifier to your reports
Prerequisites:
- The Tap identifier capture requires that both the S-TAP and Guardium appliance are on 10.1.
- This is only supported for Windows and UNIX S-TAPs.
- User-defined Tap IDs cannot contain spaces.
Policy-based fine-grained access control
Fine-grained access control is a critical privacy and security feature because it can restrict what data different users can see and under what conditions. A main use case for this capability is dynamic data masking, but you'll see that with Guardium other use cases can be supported.
Fine-grained access control in Guardium provides an extremely powerful and flexible form of access control that allows organizations to quickly address a wide range of security concerns, such as:
- Enforcing security in multitenancy scenarios where multiple users and applications share a single database, but where not all users and applications have access to all data.
- Exposing a database to a production environment for testing purposes without exposing the entire database.
- Rapidly correcting critical security vulnerabilities while permanent solutions are developed at the database or application level.
The Guardium implementation of fine-grained access control has the following characteristics:
- No database changes are required
- No application changes are required
- No network changes or proxies are used
- Masking for local connections is supported (such as Oracle Bequeath)
- Selective connection masking to avoid impact to other applications
- Can be used to prevent access or mask data
With Guardium, you can use its existing policy-based controls over several runtime environmental conditions, such as particular users, client IPs, objects, and commands to determine whether and how data will be masked.
The Guardium implementation of fine-grained access control is known as query rewrite because Guardium can dynamically rewrite the queries between the database client and database server. By rewriting queries, you can:
- Hide data:
- Horizontally by limiting the rows that are returned
- Vertically by limiting the columns that are returned
- Mask field values by replacing values with something else or returning NULL
- Restrict database activity
Table 2. Examples of how SQL commands can be modified to mask data or change behavior
| Access control required... | 行动 | Original query | Modified query |
|---|---|---|---|
| Limit what rows are accesible | Modify or add a WHERE clause | SELECT C FROM T |
SELECT C FROM T WHERE... |
| Limit what columns are accessible | Modify SELECT list (field) | SELECT C1 FROM T SELECT C1, C2 FROM T |
SELECT C2 from T SELECT C2 FROM T |
| Limit what users can do | Modify command (SELECT, INSERT, UPDATE, DELETE, CREATE...) | DROP TABLE T |
UPDATE T SET... |
| Limit what users can do | Modify object (table, view, stored procedure...) | SELECT C FROM T1 |
SELECT C FROM T2 |
Supported databases:
- Oracle (Linux, Unix, and Windows (Windows added in 10.1)
- DB2 (Linux and Unix only)
- Microsoft SQL Server
这个怎么运作
Guardium fine-grained access control relies on the following interacting components:
- Query rewrite definitions , which are rules that tell Guardium how to rewrite a query. The rules are based on syntactical elements in a query: objects, verbs (commands), and fields.
- Query rewrite actions in the runtime security policy. Again, a policy rule is how you tell Guardium under which specific conditions to apply any particular query rewrite definition.
Figure 49, below, is a simple example. In this case, a query rewrite definition exists to rewrite a query that contains SELECT * is rewritten to specify only certain columns by name. The runtime conditions (the policy) specify that this rule is to be applied whenever the runtime object is EMPLOYEE and the user is DB2INST.
The flow at runtime is as follows:
- User issues SQL.
- Guardium S-TAP holds the SQL and checks policy rules for conditions.
- If conditions are met, Guardium rewrites the query and sends it to the S-TAP.
- S-TAP releases rewritten query to database server.
- Results are sent back to the user.
Figure 49. Runtime flow for fine-grained access control (query rewrite)
Creating and testing query rewrite definitions
A query rewrite definition is how you specify to Guardium how you want a query to be rewritten at runtime, assuming the policy runtime conditions are true. Simply add that query rewrite definition to the policy action called Query Rewrite: Apply definition .
To create a query definition, navigate to the Query Rewrite Builder (Protect > Security Policies > Query Rewrite Builder ). The Query Rewrite Builder includes a space for building the query rewrite definitions and a place to test it against actual SQL statements.
Figure 50. Query rewrite builder interface
Important: The select * from customer shown above is a model query, which serves to make it easier to create the definitions. The definition is really a set of directions to the system for rewriting the syntax of a query. So, if we add a WHERE clause to the model query, this is how it is translated in Guardium as a "from-to" definition; it is basically saying that when Guardium sees something at runtime that is defined in query definition, it will change it FROM something TO something else.
Figure 51. Query rewrite builder translates model query to rules
The definition above is saying that for any query, add a WHERE clause in the top level. This is why it's important that you use policy rules to specify which objects (tables or views) you want this WHERE clause to be added to.
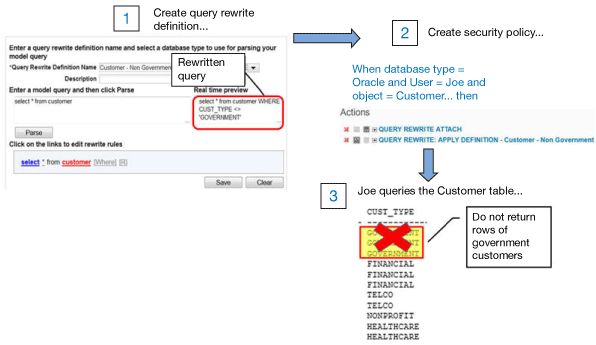
To clarify, the following figure shows an end-to-end view of a query rewrite definition that we created to redact any rows of data that are government customers. The security policy invokes this query rewrite definition whenever the runtime table is customer and the user is Joe.
When Joe issues select * from customer , he will not see any rows of data for government customers.
Figure 52. End-to-end view of masking rows of data
Reporting on query rewrite activity
There is a new report domain, Query Rewrite, that you can use to create activity reports of when a query was rewritten.
Figure 53. Query rewrite report indicates when and how a query was rewritten at runtime
Using MongoDB as an audit repository
Some organizations would like to write audit data outside of Guardium collector for reasons such as:
- "Post-processing" the audit information for fraud and other analytic analysis.
- Storing information into another data store for long online retention requirements.
In Version 10, it's possible to concurrently write audit data to both the collector database and JSON-formatted files that can be transferred to a MongoDB document database.
Important: Unlike the Guardium collector, the MongoDB database is not a hardened repository. You should carefully restrict and monitor access to the audit data by using Guardium.
这个怎么运作
As shown in Figure 54 , when properly configured, the parsed audit data is sent simultaneously to the Guardium collector repository and written in JSON format to a file in the following directory: /var/IBM/Guardium/data/auditlog
When a file is ready to be loaded into MongoDB, it will be marked with the suffix .ready . Use the Guardium API command grdapi mongodb_load to send all ready files to MongoDB.
Figure 54. Audit data is sent simultaneously to the Guardium repository and JSON files
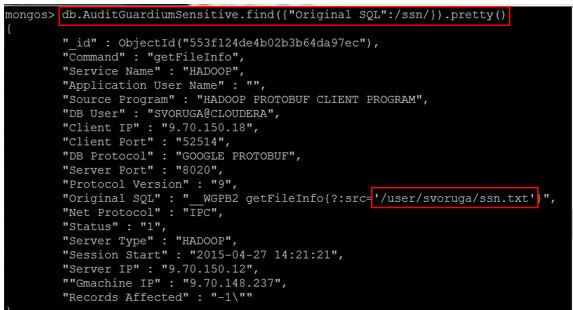
The followig screenshot shows an example of selecting a Guardium audit record after it loads into MongoDB. In this example, the audit data from Hadoop (HDFS) access to a text file is named ssn.txt.
Figure 55. Guardium audit data in MongoDB
Configuring the solution
To enable the collection of audit data in JSON format, you must configure the following:
- To enable the feature, as a CLI user, enter the following command and then restart the inspection core:
store log external state onOther options you can specify on this command include:
- File_size to specify the maximum size for a given file. The default is 4096MB.
- Flush_period to specify how often to mark files ready. The default is 60 seconds.
- To specify which traffic to collect, use the LOG EXTERNAL rule action. (This action will not appear as an option until after the collector enables.)
To send the data to MongoDB, ensure connectivity between the Guardium collector and the MongoDB server and use this command:
grdapi load_mongodb host="
Currently, only the admin database in MongoDB can be specified.
You can disable MongoDB logging by using the CLI. It is not necessary to remove the action from all policy rules.
S-TAP performance and throughput enhancements
This release has a considerable number of enhancements to improve the performance and throughput capabilities of S-TAP.
Considerations for upgrade: If required, a V10 S-TAP can connect to a V9 collector at certain patch levels. However, it is best to follow the recommended upgrade strategies and get the entire environment on to V10.1 as quickly as possible.
S-TAP multithreading
S-TAP multithreading can be used in certain workloads to prevent overrunning buffers in the S-TAP and associated K-TAP. It works by preserving multiple threads from the point of traffic interception to the point at which traffic is sent to the appliance.
To enable S-TAP multi-threading, configure the STAP with participate_in_load_balancing=4 and the number of connections you want by using a parameter in 10.1 called num_main_thread . Both parameters are configurable from the guard_tap.ini file and S-TAP Control UI.
The maximum amount of threads is still five, so you could have one sqlguard section with num_main_thread=5, or two sections with one at 3 and the other at 2. If you specify only one collector, then all traffic goes to the same collector. The total number has to be five or less and this is enforced by the user interface.
Note: When you are using the enterprise load balancer, num_main_thread will always be 1.
When used with pooled connections, the total number of threads to handle data can be up to 50 (that is, 10 * 5).
In 10.1, failover support was added.
Considerations for use: In this configuration, no one Guardium receives all the data from the S-TAP. The distribution is similar to the one used when participate_in_load_balancing is set to 1.
Important: Although participate_in_load_balancing 1 and 4 are similar, they do not send the same sessions to the same place, so if you are using 1 and switch to 4, your sessions will move machines and you'll lose the access information for those sessions.
Also, as when participate_in_load_balancing is set to 1, encrypted and unencrypted A-TAP traffic may not be sent to the same Guardium system.
Make sure to use the same policy on all the connected Guardium systems. If the policies are different, there's no guarantee which policy is in effect on a given session.
64-bit S-TAP binaries (Unix/Linux)
The S-TAP binary for 64-bit platforms is built as a 64-bit binary, which increases the amount of data S-TAP can buffer (approximately 2GB per sqlguard_ip).
New parameters for optimizing performance
S-TAP now ships with the recommended performance parameters:
- ktap_fast_tcp_verdict
- This is an existing parameter that is now on by default. When set to 1, the TCP port information is loaded into K-TAP when S-TAP starts up. The result is that K-TAP is no longer dependent on S-TAP to determine which TCP connections need to be monitored, which reduces the likelihood of experiencing database performance degradation if S-TAP becomes slow. For more information about this parameter, see the IBM Redbook® publication, Deployment Guide for InfoSphere Guardium , listed in Related topics .
- ktap_fast _shmem
- Similar to the behavior that already supported Informix®, this is a new parameter that pushes the recommended information for DB2-shared memory configurations to the K-TAP. This means that K-TAP is not dependent on S-TAP to determine which shared memory connections needs to be monitored. In general, don't turn this off.
Database platform enhancements
This table summarizes the new and changed support for database platforms. More details are included below the table for some of the more substantive changes.
Important: Database support is constantly being enhanced and updated via the service stream. Be sure to check the Release Notes for any patches and GPUs. The system requirements page on ibm.com will also reflect the most current support. See Related topics for a link.
Table 3. Summary of enhancements for databases
| 数据库类型 | Enhancements | 更多信息 |
|---|---|---|
| Apache Cassandra (and DataStax distribution) |
|
See this developerworks article publication for details on configuring and using Guardium with Cassandra. |
| DB2 for Linux, UNIX and Windows |
|
|
| DB2 for i |
|
IBM i enhancements for enterprise-readiness and DB2 for i |
| DB2 for z/OS® |
|
DB2 for z/OS enhancements |
| Data Sets for z/OS |
|
Data sets for z/OS enhancements |
| Hadoop的 |
|
Hadoop enhancements |
| IM小号 |
|
IMS enhancements |
| Informix |
|
|
| MongoDB |
|
MongoDB for VA description. |
| Netezza |
|
|
| Oracle |
|
|
| PostgreSQL |
|
|
| Sharepoint |
|
|
| SQL Server |
|
Improved handling of Microsoft SQL Server encryption |
| Sybase ASE |
|
|
| Sybase IQ |
|
|
| Teradata |
|
|
| Windows Sharepoint |
|
Hadoop enhancements
Guardium continues to evolve its Hadoop support to make it easier to collect events in real time to provide more targeted reporting capability and more protection capabilities. Version 10.1 also introduces phase 1 of integration with HortonWorks through Apache Ranger.
Blocking and redaction for Impala and Hive
S-GATE TERMINATE and redaction are now supported for Impala and Hive activity. This section describes standard S-TAP, not the approach through Apache Ranger.
Important: Because of the way Hive and Impala traffic is processed in Hadoop, you must do the following in the blocking policy rule:
- Specify the DBTYPE in the blocking (S-GATE ATTACH and S-GATE TERMINATE) policy rules; that is, either Impala or Hive.
- Ensure that ATTACH happens on a combination of user and object/command.
The figure below shows the sequence of events involved in blocking hive traffic, in which a privileged user attempting to access customer data has his/her connection terminated and the attempt is logged as a policy violation.
Figure 56. Hive user is prevented from accessing sensitive data
Redaction is configured by using extrusion rules in Guardium policies. Again, be sure to specify Hive or Impala in the DBTYPE for these rules. Here is an example of a Hive query in which social security and credit card numbers were redacted.
Figure 57. Sensitive data can be redacted for Hive and Impala queries
More targeted inspection engines for data collection
New inspection engines that target specific Hadoop components provide improved parsing and reduce the amount of manual work to report on data elements, such as user name. New options for inspection engine protocol are:
- Hive
-
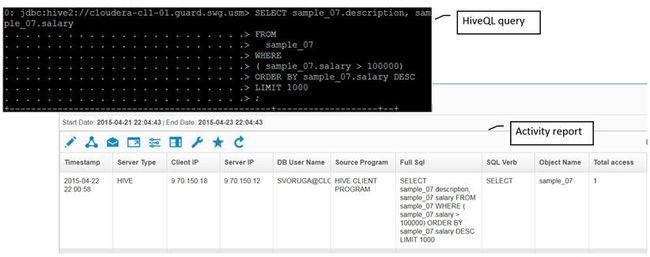
To parse HiveQL through Beeline. Beeline is a JDBC client based on the SQLLine CLI — although the JDBC driver communicates with HiveServer2 by using HiveServer2's Thrift APIs. Before, V10 HiveQL traffic required you to create computed attributes. Parsing also improved to parse the traffic just as other relational databases. An example query and associated activity report is shown below:
Figure 58. HiveQL reporting is improved
- Hue
-
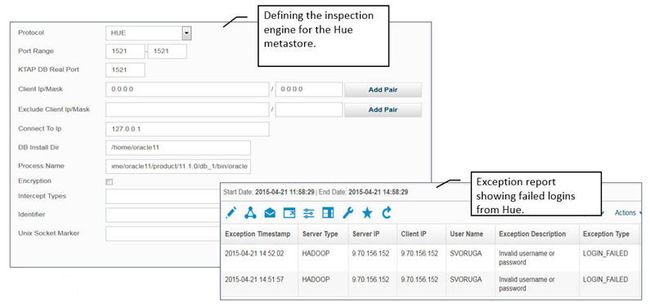
To capture failed logins from Hue requires correct configuration of the HUE inspection engine based on the Hue metastore you use (MySQL, Postgres, or Oracle). The following figure shows the inspection engine when Oracle is used as the Hue metastore and an example exception report that shows the failed logins.
Figure 59. Hue inspection engine configuration and exception report
- Impala
-
For improved parsing of Impala traffic. Before V10, the user would be returned as an object. The report example below shows the user in the appropriate field.
Figure 60. Improved reporting of Impala user names
- WebHDFS
-
For improved parsing of WebHDFS traffic, you no longer need to create a computed attribute to extract the DB user name. See the following report example.
Figure 61. WebHDFS activity report
Improved Hadoop prebuilt reports
Based on feedback from our customers, Guardium now includes built-in reports that more succinctly address required reporting requirements, including the following:
- 权限
- Privileged User Activity
- Privileged Users Accessing Sensitive Objects
- Sensitive Data Activity
- Unauthorized Yarn Jobs
- User Login
- User Sessions
- Yarn Jobs
Phase 1 of Apache Ranger integration for Hortonworks (V10.1)
Apache Ranger is used in Hortonworks for native access control and auditing. Guardium introduces an integration with Ranger that enables Ranger audit data to be directed to Guardium and also enables Guardium to leverage Ranger access control policies for blocking. The following are benefits that can be gained from using this integration:
- Support for capturing SSL-encrypted traffic
- Support for capturing Kafka traffic
- Blocking for Hive (also available using regular S-TAP), HDFS, and HBase
- Simplified deployment for auditing
Restrictions:
- Redaction of result data is not supported
- S-TAP failover is not supported
This integration is available for Hortonworks 2.3 or later releases and Guardium 10.1 or later releases.
DB2 for z/OS enhancements
Guardium activity monitoring support for the z/OS® platform in V10 delivers increased scalability, performance, blocking and quarantining, and more options for collection of events. This section provides a high-level overview.
Performance and scalability improvements
- Multistream load balancing
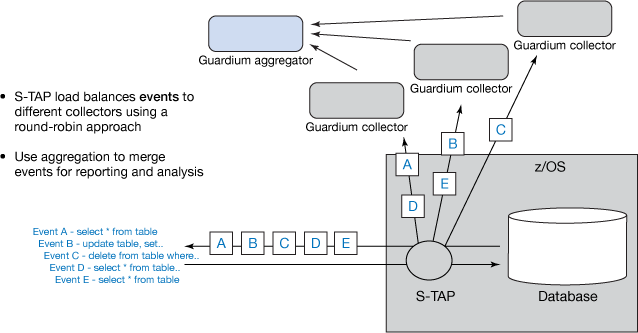
As shown in the following graphic, multistream load balancing support enables the distribution of monitoring events in a round-robin fashion across up to six Guardium collectors. This helps to increase the scalability of the overall solution by offloading events quickly from z/OS and reducing the load on individual collectors.
Figure 62. Streaming events to multiple collectors
- The default for stage 1 filtering was changed to YES, which enables better performance without having to modify the configuration file.
- Improve separation of duties and reduce processor usage by removing reliance on IFI Trace for collection of DB2 commands, negative SQL Code events, SET CURRENT SQLID, and with a follow-on PTF, DB2 utility events.
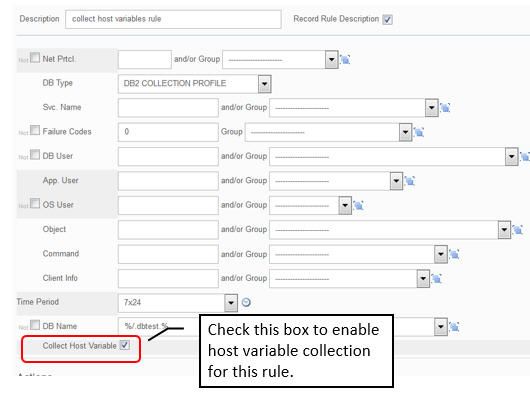
- The collection of host variable data was turned off by default. This improves security because host variables contain data, which you might not wish to be exposed, and reduces processor usage by not requiring the S-TAP to collect that information unnecessarily. You can enable host variable collection on a rule-by-rule basis, as shown in this sample DB2 Collection Profile policy rule.
Figure 63. Enable host variable collection on a rule-by-rule basis
More options for collecting security events
There are many enhancements that increase flexibility and improve the level of detail for auditing.
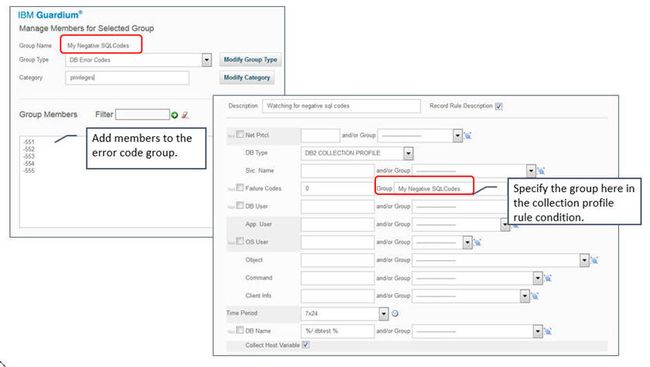
- Significant improvements in flexibility to collect events that are related to negative SQL Codes. Similar to how it is specified on the distributed platforms, administrators create groups of negative SQL Codes in the Guardium appliance and specify that group on the DB2 Collection Profile policy rule as a white list or black list:
Figure 64. Creating negative SQL Code groups and specifying in a policy rule
You no longer need to enable IFI Audit class 1 to audit negative return codes, which might improve performance on the DB2 subsystem as well.
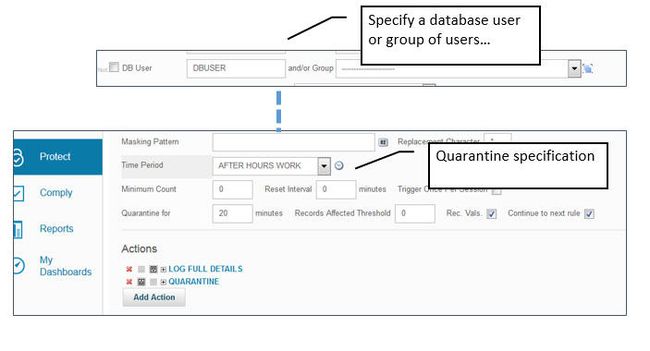
- Quarantine suspicious users to blocked access until investigation is complete. Some organizations would like to enforce policies that restrict privileged user access at certain hours and on certain subsystems. Quarantining is set on a regular collector access rule ( not a DB2 collection profile rule), as shown in the following screenshot. This quarantine rule applies only after the events are received from the S-TAP.
Figure 65. Quarantine users policy
At runtime, S-TAP will check the database user against the quarantine policy on the Guardium collector. To avoid performance impacts to all other users, the SQL will still be processed. However, as soon as the verdict comes back from the Guardium collector, any subsequent activity by that user will be blocked. The figure below shows this flow.
Figure 66. Quarantining DB2 for z/OS users
- User issues SQL.
- If the SQL passes the collection profile filter, the event is streamed to the Guardium collector.
- If it is a match on the policy rule, the collector adds this user to a quarantine list and sends it to the S-TAP.
- The S-TAP stops further access from this user until the quarantine period is up.
Important: Because quarantining depends on data that passes the z/OS-side filtering, the z/OS collection profile must be a superset of the events that would match the quarantine policy. If this is not heeded, it is possible that S-TAP would never send an event to the collector that would match the policy rule, rendering the quarantine rule basically a no-op.
Quarantined connections appear in the Connections Quarantined report.
- Database name filtering on DB2 collection profile rules. You can now specify the database name (or group of database names), including wild carding, as an additional filtering option. To be effective, include the filter on all rules in the policy.
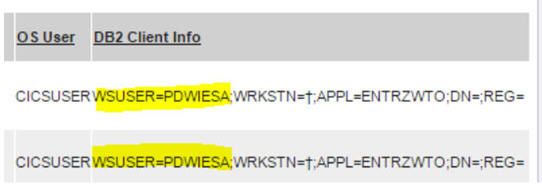
- Ability to capture CICS login user. Previously, the S-TAP would capture the CICS user that was used to access DB2, which might be a common ID. Now, the real login user is captured from the DB2 client info fields for DB2 CICS applications.
Figure 67. CICS login user ID is captured in client info fields
Prerequisites:
- Supported for CICS Versions TS 4.2, TS 5.1, and TS 5.2.
- CICS login user ID reporting is not enabled by default. Enable it by adding the CICS_USERID parameter to the ADHPARM file and setting the parameter to Y. Example:
CICS_USERID(Y) - In the CICS Connection definition, ATTACHSEC parameter must be set to ATTACHSEC(IDENTIFY) to pass the user ID from the Terminal-Owning Region (TOR) to the Application-Owning Region (AOR), which makes it available for collection.
IMS enhancements
In addition to supporting IMS V14, Guardium V10 offers the enhancements described here.
Reduce processor usage and improve performance
Here is a summary of performance improvements:
- Multi-streaming load balancing support. The support is nearly identical to that provided for DB2 for z/OS, described above in Performance and scalability improvements .
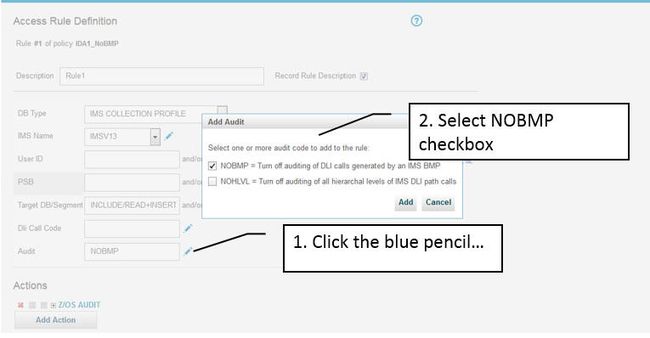
- Reduce overhead by optionally declaring BMP as "trusted" and disable auditing. To disable BMP auditing, select the blue pencil in the Audit field of the IMS Collection profile rule definition and select the NOBMP check box as shown below.
Figure 68. Disabling the collection of IMS BMP events
- Reduce processor usage by limiting auditing to the lowest hierarchical level of a DLI path call. This limits monitoring only to the last segment of the hierarchical path instead of multiple segments when not required. Currently, if you do a path call that touches 15 segments, you would get 15 audit events. By disabling the higher level audits, you can reduce that to one.
Disable higher level collection by clicking NOHLVL on the Audit field of the IMS Collection Profile policy in the same dialog box as shown in Figure 68 .
Simplify installation and configuration
In V10, the S-TAP no longer requires a VSAM repository on the IMS host. All the definitions are now stored in the Guardium collector database.
Auditing improvements
- There is a new built-in report for IMS checkpoints, an example of which is shown here:
Figure 69. Disabling the collection of IMS BMP events
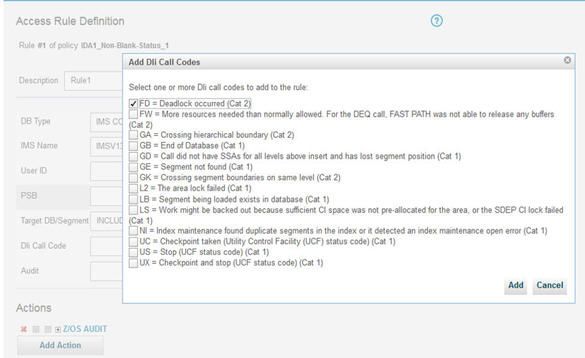
- Before V10, only successful DLI calls were audited. In V10, you can capture certain failure cases as well, which might help uncover attempts to discover the system topology or otherwise gain knowledge about the system. To add codes to the IMS collection profile rule, click the blue pencil of the DLI Call Code field and check the ones that you want audited, as shown in the following image.
Figure 70. Indicate which call codes to audit
- Support collection of application events that would not otherwise be audited. There are some cases in which it is desirable to gather non-database insights about such things as application or user events, including, but not limited to:
- An alternate user name, such as those cases in which IMS Connect uses a generic name to connect to the database.
- A user-friendly application name.
- A change ticket number for whenever DBA changes need to be reconciled with a change ticketing system.
This collection does require some application and configuration changes that will signal the IMS S-TAP that a "special" event is being sent. The syntax and rules for the application event are consistent with other platforms and are documented in the Guardium Knowledge Center (see Related topics ). To summarize, the first two bytes of the string is the ccsid of the encoding in hex format (only UTF-8 is supported). Following these first 2 bytes is a UTF-8 string in the following format.
Listing 1. String used to pass event information to the Guardium collector
SELECT

'GuardAppEvent:Start',
'GuardAppEventType:type',
'GuardAppEventUserName:name',
'GuardAppEventStrValue:string',
'GuardAppEventNumValue:number',
'GuardAppEventDateValue:date'

FROM  DUAL
Data sets for z/OS enhancements
Data sets auditing includes enhancements for load balancing, auditing enhancements, and setup configuration validation.
Load balancing provides the ability to offload data set events to multiple collectors and is nearly identical to that described for DB2 for z/OS.
Audit events can now be collected for data sets that reside on tape. No special configuration is required to enable this. An example report is shown below:
Figure 71. Events on tape data sets can be collected
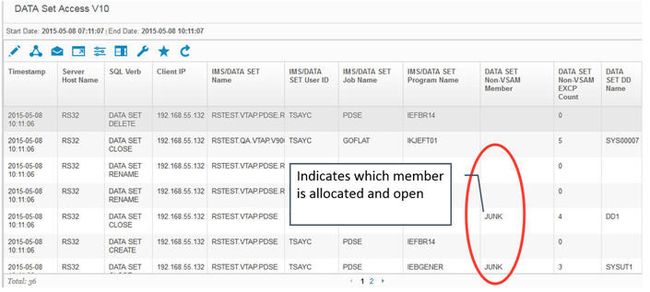
Another thing you'll see on that report is the execute channel program (EXCP) counts for non-VSAM data sets, which basically tells you the number of reads and writes against these non-VSAM data sets. This allows for more granular reporting of access to partitioned data sets. Previously, you could not tell which specific member of a PDS or PDSE library was being accessed. In V10, the specific member name is reported.
Figure 72. The allocated member name for a PDSE is reported
You can now specify the DDNAME (as used in JCL) as a rule condition in the Data Set Collection Profile policy (see figure below).
Figure 73. DDNAME filter field in the Data Set Collection Profile policy rule
You can also add the DATA SET DDNAME as a column in the access report. Find it under the FULL SQL domain in the Query Builder.
Finally, a new setup check was added at agent startup to ensure that the proper SMF records are activated for auditing. The agent will continue to operate but without proper SMF setup, audit data cannot be collected. Here is an example that shows where SMF Records 17, 18, and 62 are not activated.
Figure 74. SMF test at agent startup notifies you if there is a problem
IBM i enhancements for enterprise-readiness
The S-TAP for IBM i was re-architected to support the following critical enterprise readiness features for scalability, high availability, and security:
- S-TAP load balancing to support:
- Failover of monitoring traffic to another collector if the primary collector is unavailable.
- Round-robin session data among a list of available collectors.
- Send duplicate data to multiple collectors for high availability.
- TLS encryption between the S-TAP and the Guardium collector.
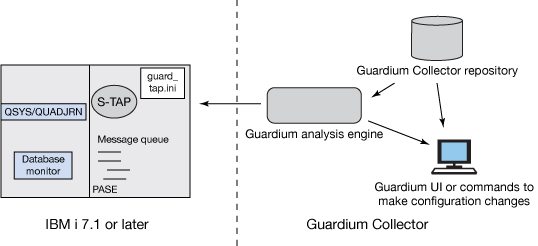
As shown in the following figure, the overall architecture is largely unchanged from prior releases except that now most S-TAP configuration parameters are now stored in a guard_tap.ini file in the /usr/local/guardium directory on the IBM i server, similar to other database S-TAPs. Previously, they were stored in a table on the DB2 for the i database. Parameters that are related to filtering are still in the original table.
Figure 75. IBM i with Guardium architecture
Administrators configure the S-TAP using the same APIs and UI (S-TAP Control) as other UNIX S-TAPS. When the GUI or API is used to change the S-TAP configuration, the Guardium analysis engine (sniffer) sends a message to the S-TAP, which backs up the old .ini file, saves the configuration to the new .ini file and then restarts itself.
Administrators can set up encrypted communication and load balancing options by using the S-TAP configuration controls and grdapi, such as update_stap_config . Continue to use the update_istap_config API for controlling filtering parameters on the IBM i server.
Improved handling of Microsoft SQL Server encryption
Microsoft SQL server encrypts all of its logins by default. Optionally, all data can be encrypted by using the force-encryption option. Guardium must decrypt login (and optional) data traffic to be able to detect, for example, which database user is performing the activity. It did this on the appliance by correlating decrypted login information with incoming data streams.
In V10.1, Guardium significantly enhanced this capability. Now, decryption is occurring on the database client side. Client-side correlation eliminates all of the problems of appliance-side correlation by providing only decrypted network streams to the Guardium appliance. The appliance can inspect the contents of the traffic immediately, make decisions that are based on loaded policies, and then trigger actions based on those decisions.
This capability produces negligible processor usage on the server in initial performance testing in IBM lab. Your results might vary and I recommend that you test this in your own environment.
There are no configuration changes required, and it supports all Guardium-supported versions of SQL Server.
New S-TAP platforms
As always, see the V10 System Requirements document on ibm.com for the latest information. The following are new platforms supported by S-TAP:
- RHEL 7 x86_64
- RHEL 7.1 PPC64LE (PowerPC little endian, added in 10.1)
- SUSE 12 x86_64
- Ubuntu 14 (x86_64)
- Debian (supported via Ubuntu installer)
The following platforms are no longer supported:
- AIX 5.3
- SUSE 9
- Solaris 9
What's new in Vulnerability Assessment
IBM Security Guardium Vulnerability Assessment offers a comprehensive database vulnerability testing solution. In V9.5, the capabilities that were formerly only available in the Advanced Edition were made available to all current license holder for Vulnerability Assessment. Specifically, database entitlement reporting and the configuration audit system are now part of the single offering.
With V10, Guardium is including over 2000 tests. Guardium has a strong portfolio of tests that dig deep into hardening database security across many DBMS types. In many of these DBMS types, Guardium is either the first in the market or the only one who offers a solution.
New in V10 is several new database platforms, including DB2 for i, MongoDB, SAP HANA, Aster, new STIG Benchmarks for Oracle and SQL Server, and operational enhancements.
New database platforms
The following new database platforms can now be tested by using Guardium Vulnerability Assessment:
- MongoDB
- DB2 for i
- SAP HANA
- Teradata Aster
MongoDB
MongoDB is a popular NoSQL document-style database, which uses JSON-formatted documents for storing data. Guardium is the first and, as of this writing, only solution to support vulnerability testing for MongoDB. Supported releases include MongoDB 2.6 and 3.0.
Guardium includes over 50 tests that cover CVE patches, configuration best practices, and for users with elevated privileges. The figure below shows an improvement over time and an example of the kind of detailed recommendation you get with Guardium.
Figure 76. Test results include detailed remediation steps
Entitlement reporting and query builder are not supported for MongoDB.
DB2 for i
DB2 for i is a widely used database system across a variety of industries. Guardium has worked closely with the security subject matter experts in DB2 for i to come up with a comprehensive set of over 130 tests and entitlement reporting for IBM i 6.1, 7.1 and 7.2 partitions.
Types of tests include:
- Profiles with Special Authorities
- Profiles with access to Database Function Usage
- Password policies
- Database Objects privilege granted to PUBLIC
- Database Objects privilege granted to individual user
- Database Objects privilege granted with grant option
- Security APARs.
Entitlement reports include:
- Profiles with Special Authorities.
- Group granted to user
- Database Objects privilege granted to PUBLIC
- Database Executable Objects privileges granted to PUBLIC
- Database Objects privilege granted to individual user
- Database Objects privilege granted with grant option
Note: Configuration audit system is not supported for DB2 for i.
Ensure that you have proper prerequisites installed before running VA tests:
- IBM i 7.1 partitions:
- PTF Group SF99701 Level 26 or PTF Group SF99701 Level 25 with enabling PTFs SI50237, SI50251, SI50301 and SI51156.
- IBM i 6.1 partitions:
- PTF Group SF99601 Level 30
SAP HANA
SAP HANA is an in-memory, column-oriented, relational database management system developed and marketed by SAP. Guardium is the first offering in this space for SAP HANA. Guardium has a suite of 65 tests. Types of tests include:
- Password policies
- Default SYSTEM password
- System privileges and roles
- Database Object privileges granted to PUBLIC
- Database Object privileges granted to individual user
- Database Object privileges granted with grant option
- Version and patches
- CAS (File permission and ownership)
Entitlement reporting is not currently available.
Teradata Aster
Teradata Aster is a database platform that is typically used for data warehousing and analytic applications. No other vendor offers vulnerability assessments for Aster.
Guardium supports Aster 5.1 and 6.1 and includes the following types of tests:
- Default password
- System privileges and roles
- Database Object privileges granted to PUBLIC
- Database Object privileges granted with grant option
- Version and patches
- CAS (File permission and ownership)
Create security assessments to run on the queen node as all database connections for Aster Data goes through the queen node only. Testing on worker and loader nodes is only required when performing CAS tests (file permission and file ownership).
Privilege tests loop through all the databases in a given Aster's instance.
DISA STIG Benchmarks for Oracle 11gr2 and SQL Server 2012
The Defense Information System Agency (DISA) publishes security technical implementation guides (STIGs), which are configurations that make existing applications or databases more secure. In Guardium Vulnerability Assessment Version 10, the external references for all existing and new STIG tests are in sync with the latest STIG benchmark.
- There are 34 new Oracle tests (authorization, privileges, and configuration) and five new SQL Server 2012 tests created from the latest STIG benchmark.
- The logic for many existing tests were modified to sync up with latest STIG recommendations.
- Tests that reference STIG now have a separate STIG reference and STIG severity fields. For Oracle, there is a also a STIG IA (Information Assurance) Control field (see Figure 77). For SQL Server, there is an SRG (Security Requirements Guide) reference.
- A STIG external reference for SQL Server now begins with SQL% instead of DG% or DM%.
Figure 77. Example STIG test for Oracle
Operational enhancements
The following configuration controls provide greater control over the behavior of VA tests:
- Configurable privilege test timeout value.
To avoid having entire test suites fail because of a problem with one test, there is now a query timeout configuration for both query-based and Java-based privilege tests. When a test takes more than 10 minutes to execute, it will time out with a message specific to the DBMS type driver. This mechanism can be turned off or modified by using the following CLI commands:
-
show va query_timeout -
store va query_timeout off -
store va query_timeout on
A GUI restart is required.
Recommendation: Do not set the timeout value to greater than 30 minutes.
Restriction: Not supported for Aster, Informix, and SAP HANA.
-
- Configurable output limit for privilege tests.
To avoid the rare condition, which excessive violations cause memory issues, Guardium is limiting the number of rows returned per test to 20,000 rows. This default can be overridden by using the following CLI commands:
-
show va max_detail -
store va max_detail off -
store va max_detail onwhereis the number of rows
-
A GUI restart is required.
Restriction: Not supported for SAP HANA.
结论
The purpose of this article was to give Guardium users a relatively detailed overview of the new features in the Guardium data security and protection portfolio. I hope that I accomplished that mission and that you will consider trying V10.1 yourself, which is really the best way for technical users to learn the product. Over time, we will continue to publish more articles, videos, and tech talks to help you get up to speed on this exciting new version.
翻译自: https://www.ibm.com/developerworks/security/library/se-guardium-v10/index.html

