小白学习图像处理8——使用matlab的hough变换函数
@ [toc]
一、hough函数
1、语法
[H,theta,rho] = hough(BW)
[H,theta,rho] = hough(BW,Name,Value,...)
详细说明:
** [H,theta,rho] =霍夫(BW)**计算二值图像BW的标准霍夫变换(SHT)。 该函数返回rho(沿垂直于线的矢量从原点到直线的距离)和theta(x轴与该矢量之间的角度,以度为单位)。该函数返回函数还返回标准Hough变换H,它是[H,theta,rho] =霍夫(BW,名称,值,…)计算二值图像BW的标准霍夫变换(SHT),其中指定的参数影响计算。
可选的参数有
| 参数 | 主题 |
|---|---|
| ‘RhoResolution’ | Hough变换沿rho轴的bin的间距,交替为1 |
| ‘Theta’ | 输出矩阵H的对应列的Theta值,其中包含’Theta’和[-90,90)范围内的实数数值向量,最小-90:89 |
2,举个栗子
RGB  = imread('septagon.tif');
I = im2double(RGB);
BW = edge(I,'canny');
figure, imshow(BW);

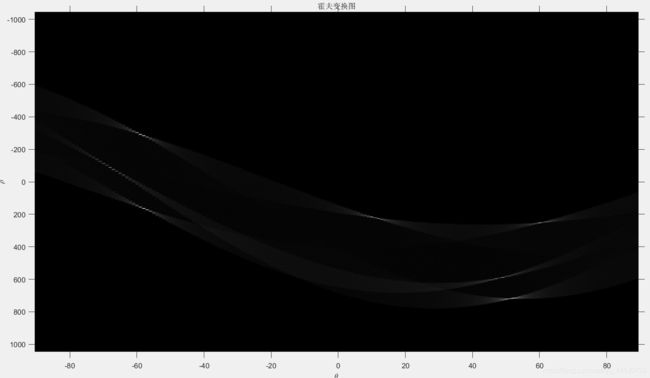
[H, theta, rho] = hough(BW, 'RhoResolution', 0.5, 'Theta', -90:0.2:89);

figure
imshow(H,[],'XData',theta,'YData',rho,'InitialMagnification','fit');
title('霍夫变换图'), xlabel('\theta'), ylabel('\rho');
axis on , axis normal
hold on
- 代码的第6行设置了ρ和θ的分辨率
- 代码的第9行imshow函数里面,
[]表示将结果标定化(即用H除以H的最大值),设置x和y轴为theta和rho,'InitialMagnification','fit'的目的是显示H的时候让长宽自适应的调整
结果如下:可以发现,参数空间中含有很多正弦曲线

查看rho、theta和H的矩阵大小:
>> size(rho)
ans =
     1   523
>> size(theta)
ans =
     1   180
>> size(H)
ans =
   523   180
二、houghpeaks函数
听名字就知道这个函数是寻找霍夫变换得到的结果中的一些极大值
1、语法
peaks = houghpeaks(H,numpeaks)
peaks = houghpeaks(H,numpeaks,Name,Value)
详细说明
(1)peaks = houghpeaks(H,numpeaks) locates peaks in the Hough transform matrix, H, generated by the hough function. numpeaks specifies the maximum number of peaks to identify. The function returns peaks a matrix that holds the row and column coordinates of the peaks.
(2)peaks = houghpeaks(H,numpeaks,Name,Value) controls aspects of the operation using name-value pair arguments.
参数说明
| 参数 | 含义 |
|---|---|
| H | 霍夫变换得到的矩阵 |
| numpeaks | 限定要识别的峰值的个数,默认值为1 |
| ‘Threshold’ | 可被认为是峰值的最小值,比如0.2*max(max(H)) |
2、举个栗子
# 接上上面的代码
% Find peaks in the Hough transform of the image.
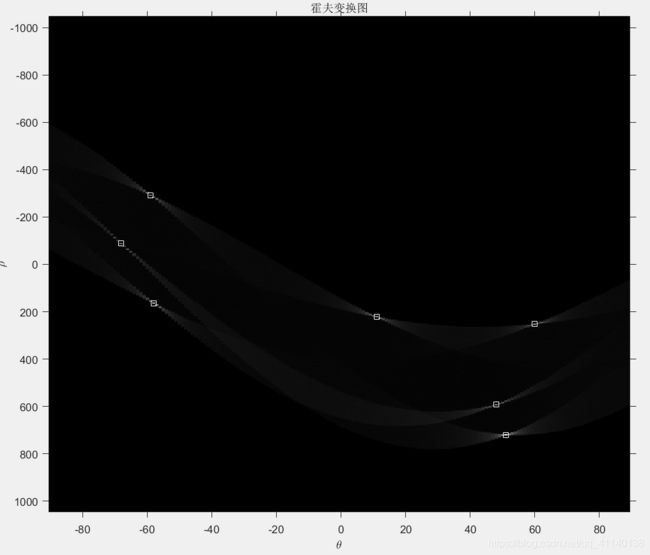
P  = houghpeaks(H,8,'threshold', ceil(0.3*max(H(:))));
x = theta(P(:,2));
y = rho(P(:,1));
plot(x,y,'s','color','white');
- 这里将threshold设置为0.3倍的最大值,目的是防止很短的直线也被检测出来,影响视觉效果
- 绘图的时候用方块square标出返回的peaks在参数平面中的位置(注意P的第1列表示ρ,第二列表示θ)
P =
   442   142
   303    33
   189    32
   325   151
   317   102
   410   139
   240    23
三、houghlines函数
houghlines函数基于hough变换来提取线段
1、语法
lines = houghlines(BW,theta,rho,peaks)
lines = houghlines(___,Name,Value,...)
说明
(1) lines = houghlines(BW,theta,rho,peaks) 提取图像 BW 中与 Hough 变换中的特定 bin 相关联的线段。theta 和 rho 是函数 hough 返回的向量。peaks 是由 houghpeaks 函数返回的矩阵,其中包含 Hough 变换 bin 的行和列坐标,用于搜索线段。返回值 lines 是结构体数组,其长度等于找到的合并后的线段数。
(2)lines = houghlines(___,Name,Value,…) 提取图像 BW 中的线段,其中指定的参数影响运算。
参数说明
| 参数 | 含义 |
|---|---|
| ‘FillGap’ | 与同一 Hough 变换 bin 相关联的两个线段之间的距离,默认值为20,当线段之间的距离小于指定值时,houghlines 函数会将这些线段合并为一条线段 |
| ‘MinLength’ | 最小线条长度,指定为正实数标量。houghlines 丢弃短于指定值的线条,double类型 |
返回值
lines 为找到的线条,以结构体数组形式返回,其长度等于找到的合并线段数。结构体数组的每个元素都有以下字段:

2、举个栗子
lines = houghlines(BW,theta,rho,P,'FillGap',10,'MinLength',5);
查看lines的返回值:
>> lines
lines =
1x7 struct array with fields:
    point1
    point2
    theta
    rho

>> size(lines)
ans =
     1     7

>> lines.point1
ans =
   414   591
ans =
   404    61
ans =
   144   426
ans =
   191   183
ans =
   192   181
ans =
   539   312
ans =
   539   312
lines为结构体类型,包含四个矩阵,其中point1为线段的起始点坐标,point2为线段的终点坐标,theta和rho就是hough得到的theta和rho
四、绘制线段
% Find lines and plot them.
lines = houghlines(BW,theta,rho,P,'FillGap',10,'MinLength',5);
figure, imshow(RGB), hold on
max_len = 0;
for k = 1 : length(lines)
   xy = [lines(k).point1; lines(k).point2];     % k=1, xy=[539 312; 685 374]
   plot(xy(:,1),xy(:,2),'LineWidth',2,'Color','green');

   % Plot beginnings and ends of lines
   plot(xy(1,1),xy(1,2),'x','LineWidth',2,'Color','yellow');
   plot(xy(2,1),xy(2,2),'x','LineWidth',2,'Color','red');

   % Determine the endpoints of the longest line segment
   len = norm(lines(k).point1 - lines(k).point2);
   if ( len > max_len)
      max_len = len;
      xy_long = xy;
   end
end
%通过将最长的线段着色为青色突出显示。
plot(xy_long(:,1),xy_long(:,2),'LineWidth',2,'Color','cyan');
霍夫变换的原理可以参考 小白学习图像处理7——Hough变换检测直线
hough变换部分完结〜

