Matlab-study-10-数值微积分
Differentiation微分
微分表示polyval()
a = [9,-5,3,7]; x = -2:0.01:5;
f = polyval(a,x);
plot(x,f,'LineWidth', 2);
xlabel('x'); ylabel('f(x)');
set(gca, 'FontSize', 14);
求导 polyder()
f(x) = 5x^ 4 − 2x^ 2 + 1
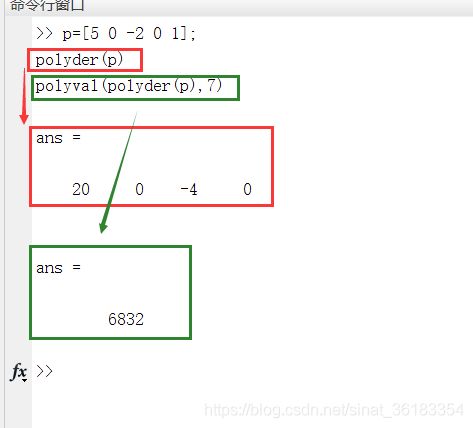
p=[5 0 -2 0 1];
polyder(p)
polyval(polyder(p),7)                 %在x=7时候的微分
练习
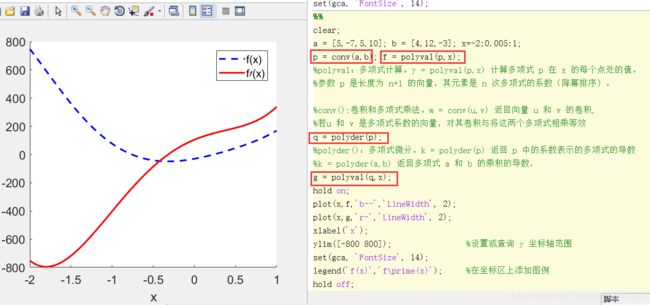
a = [5,-7,5,10]; b = [4,12,-3]; x=-2:0.005:1;
p = conv(a,b); f = polyval(p,x);
%polyval:多项式计算。y = polyval(p,x) 计算多项式 p 在 x 的每个点处的值。
%参数 p 是长度为 n+1 的向量,其元素是 n 次多项式的系数(降幂排序)。

%conv():卷积和多项式乘法。w = conv(u,v) 返回向量 u 和 v 的卷积,
%若u 和 v 是多项式系数的向量,对其卷积与将这两个多项式相乘等效
q = polyder(p);
%polyder():多项式微分。k = polyder(p) 返回 p 中的系数表示的多项式的导数
%k = polyder(a,b) 返回多项式 a 和 b 的乘积的导数,
g = polyval(q,x);
hold on;
plot(x,f,'b--','LineWidth', 2);    %绘制f(x)
plot(x,g,'r-','LineWidth', 2);     %绘制f '(x)
xlabel('x');
ylim([-800 800]);                   %设置或查询 y 坐标轴范围
set(gca, 'FontSize', 14);
legend('f(x)','f\prime(x)');      %在坐标区上添加图例
hold off;
多项式积分polyint()
q = polyint(p,k) 使用积分常量 k 返回 p 中系数所表示的多项式积分。
p=[5 0 -2 0 1];
polyint(p, 3)
polyval(polyint(p, 3),7) %在x=7时,f(x)的积分
数值的微分diff()
diff():差分和近似导数
Y = diff(X) 计算沿大小不等于 1 的第一个数组维度的 X 相邻元素之间的差分:
如果 X 是长度为 m 的向量,则 Y = diff(X) 返回长度为 m-1 的向量。Y 的元素是 X 相邻元素之间的差分。
Y = [X(2)-X(1) X(3)-X(2) … X(m)-X(m-1)]
如果 X 是不为空的非向量 p×m 矩阵,则 Y = diff(X) 返回大小为 (p-1)×m 的矩阵,其元素是 X 的行之间的差分。
Y = [X(2,:)-X(1,:); X(3,:)-X(2,:); … X(p,:)-X(p-1,:)]
如果 X 是 0×0 的空矩阵,则 Y = diff(X) 返回 0×0 的空矩阵

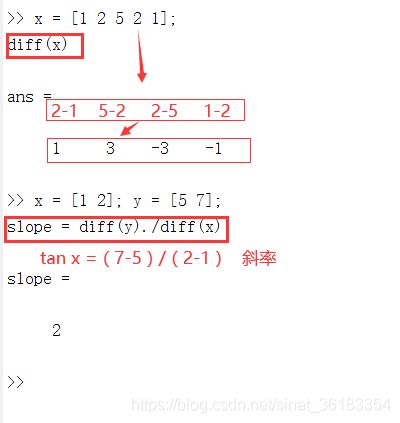
示例
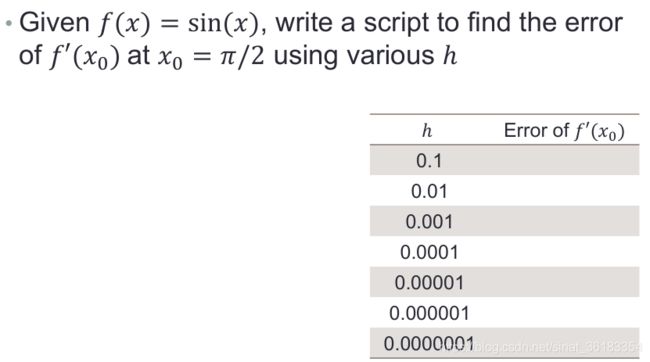
要求

x0 = pi/2; h = 0.1;
x = [x0 x0+h];
y = [sin(x0) sin(x0+h)];
m = diff(y)./diff(x)
%%
%有误
clear;
x0 = pi/2;
m = [0 0 0 0 0 0 0];
h = [0.1 0.01 0.001 0.0001 0.00001 0.000001 0.0000001];

%h = [0.1 0.01 0.001 0.0001 0.00001 0.000001 0.0000001];

x = [x0 x0+h];
y = [sin(x0) sin(x0+h)];
m = diff(y)./diff(x);
format long;


%%
%正确答案
clear;
x0 = pi/2;
h = 10^ -1;
m = [0 0 0 0 0 0 0];
for n = 1:7
    h = 10^(-n);
    x = [x0 x0+h];
    y = [sin(x0) sin(x0+h)];
    m(n) = diff(y)./diff(x);
    n = n + 1;
end
format long;
额外说明(其余)
B=A(end: -1:1,:)表示将A的行的顺序从尾到头排列构成B,也就是B的第一行对应至A的最后一行,B的第二行到对应A的倒数第二行,以此类推。 C=A(:,end: -1:1)则是对A的列做类似倒的排列,得到C。
示范
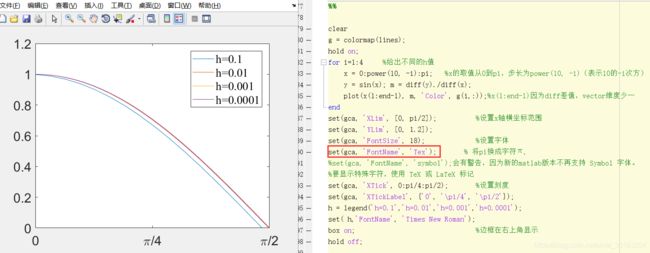
g = colormap(lines);
hold on;
for i=1:4     %给出不同的h值
    x = 0:power(10, -i):pi;   %x的取值从0到pi,步长为power(10, -i)(表示10的-i次方)
    y = sin(x); m = diff(y)./diff(x);
    plot(x(1:end-1), m, 'Color', g(i,:));%x(1:end-1)因为diff差值,vector维度少一
end
set(gca, 'XLim', [0, pi/2]);          %设置x轴横坐标范围
set(gca, 'YLim', [0, 1.2]);
set(gca, 'FontSize', 18);             %设置字体
set(gca, 'FontName', 'Tex');       % 将pi换成字符π,
%set(gca, 'FontName', 'symbol');会有警告,因为新的matlab版本不再支持 Symbol 字体。
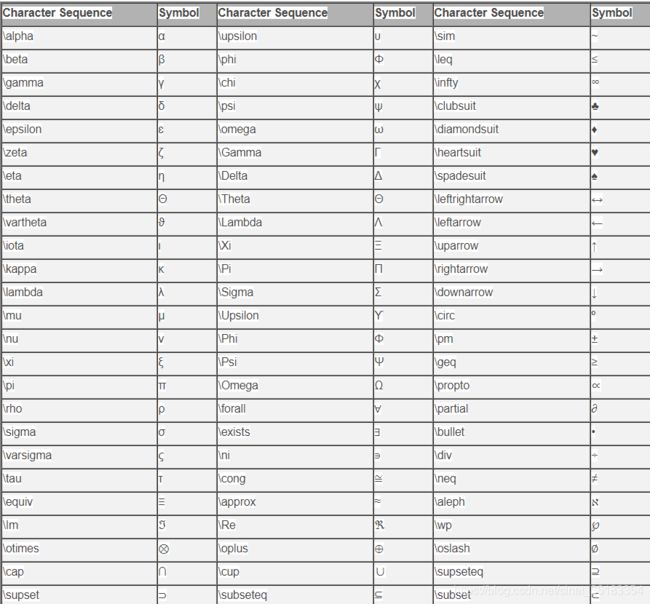
%要显示特殊字符,使用 TeX 或 LaTeX 标记
set(gca, 'XTick', 0:pi/4:pi/2);       %设置刻度
set(gca, 'XTickLabel', {'0', '\pi/4', '\pi/2'});
h = legend('h=0.1','h=0.01','h=0.001','h=0.0001');
set( h,'FontName', 'Times New Roman');
box on;                               %边框在右上角显示
hold off;
附录:Tex代码列表
下面是Matlab官方列出来的Tex代码列表,包含了绝大部分的希腊字母和数学符号。

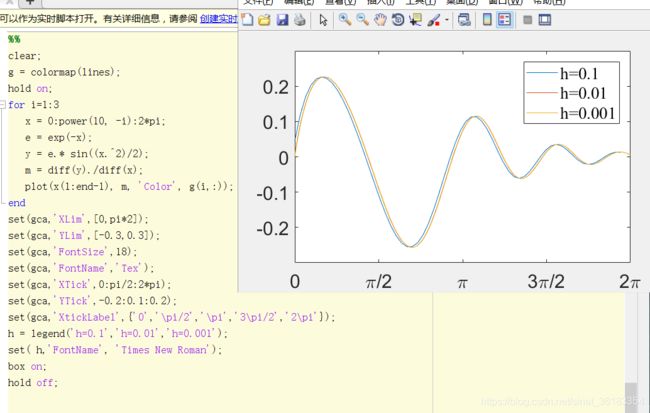
练习
g = colormap(lines);
hold on;
for i=1:3
   x = 0:power(10, -i):2*pi;
   e = exp(-x);
   y = e.* sin((x.^2)/2);
   m = diff(y)./diff(x);
   plot(x(1:end-1), m, 'Color', g(i,:));
end
set(gca,'XLim',[0,pi*2]);
set(gca,'YLim',[-0.3,0.3]);
set(gca,'FontSize',18);
set(gca,'FontName','Tex');
set(gca,'XTick',0:pi/2:2*pi);
set(gca,'YTick',-0.2:0.1:0.2);
set(gca,'XtickLabel',{'0','\pi/2','\pi','3\pi/2','2\pi'});
h = legend('h=0.1','h=0.01','h=0.001');
set( h,'FontName', 'Times New Roman');
box on;
hold off;
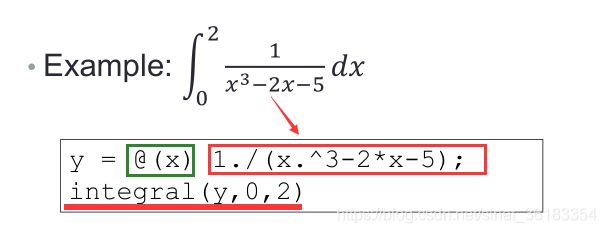
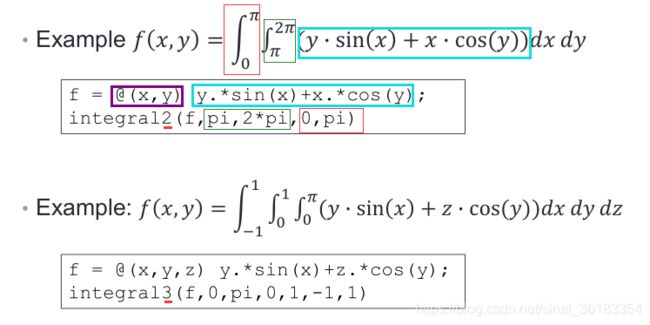
数值的积分(三种方法)
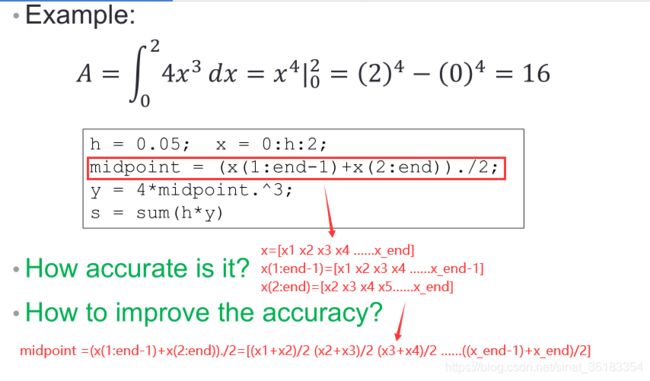
Midpoint Rule(矩形求积分)
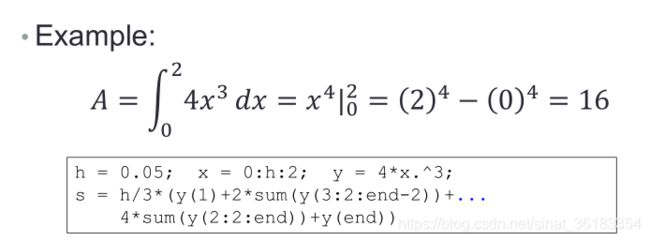
h = 0.05; x = 0:h:2;
midpoint = (x(1:end-1)+x(2:end))./2;
y = 4*midpoint.^3;
s = sum(h*y)
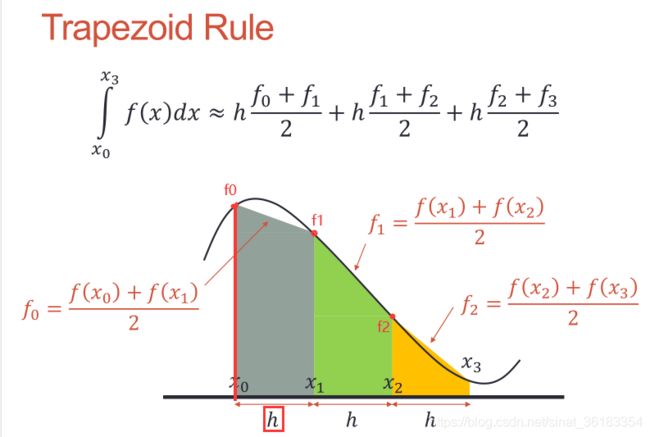
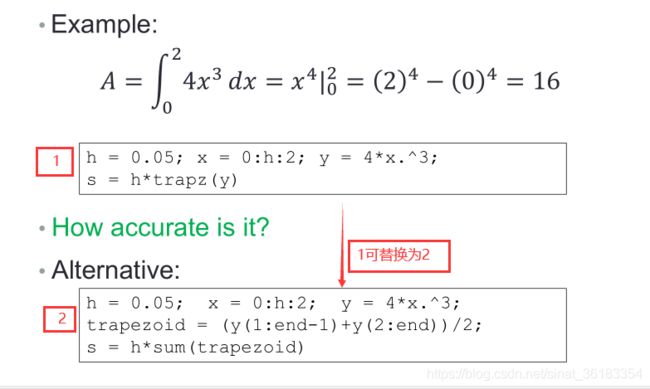
Trapezoid Rule(梯形求积分)——trapz()
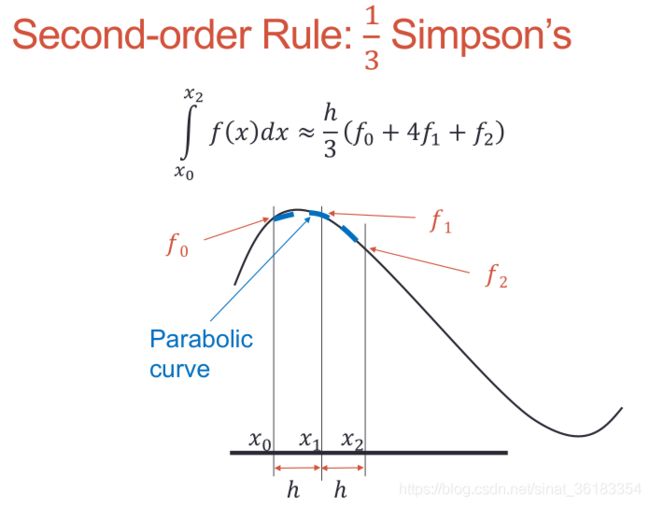
Second-order Rule: 1/3 Simpson’s
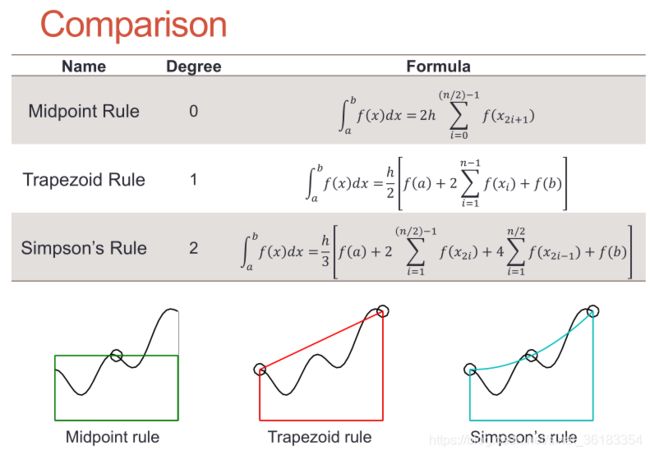
比较三种求积分方式
Review of Function Handles (@)
@可以呼叫已有的函数(这么说会迷糊,举个例子)
示例:
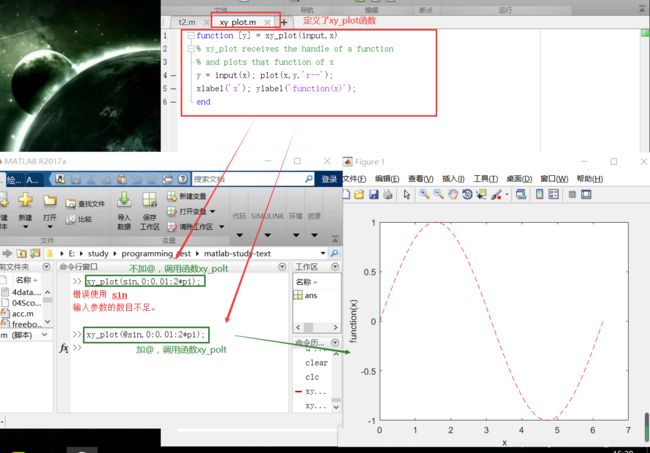
定义一个函数function [y] = xy_plot(input,x)。
function [y] = xy_plot(input,x)
% xy_plot receives the handle of a function
% and plots that function of x
y = input(x); plot(x,y,'r--');
xlabel('x'); ylabel('function(x)');
end
如果要使用该函数画出sin的图像的时候,不加@是会报错的,而加了手柄@就可以成功使用xy_plot(input,x)函数,如:
xy_plot(sin,0:0.01:2*pi);   %报错,无法使用该函数
xy_plot(@sin,0:0.01:2*pi);    %成功绘图,可以使用该函数
xy_plot(@cos,0:0.01:2*pi);    %成功绘图,可以使用该函数
xy_plot(@exp,0:0.01:2*pi);    %成功绘图,可以使用该函数


