Linear Regression
import matplotlib.pyplot as plt
import numpy as np
"""
Desc:
加载数据
Parameters:
filename - 文件名
Returns:
xArr - x数据集
yArr - y数据集
"""
def loadDataSet(filename):
numFeat = len(open(filename).readline().split('\t')) - 1
xArr = []
yArr = []
fr = open(filename)
for line in fr.readlines():
lineArr = []
curLine = line.strip().split('\t')
for i in range(numFeat):
lineArr.append(float(curLine[i]))
xArr.append(lineArr)
yArr.append(float(curLine[-1]))
return xArr, yArr
"""
Desc:
计算回归系数w
Parameters:
xArr - x数据集
yArr - y数据集
Returns:
ws - 回归系数
"""
def standRegres(xArr, yArr):
xMat = np.mat(xArr)
yMat = np.mat(yArr).T
xTx = xMat.T * xMat
if np.linalg.det(xTx) == 0.0:
print("矩阵为奇异矩阵,不能求逆")
return
ws = (xTx.I) * (xMat.T) * yMat
return ws
"""
Desc:
绘制数据集
Parameters:
None
Returns:
None
"""
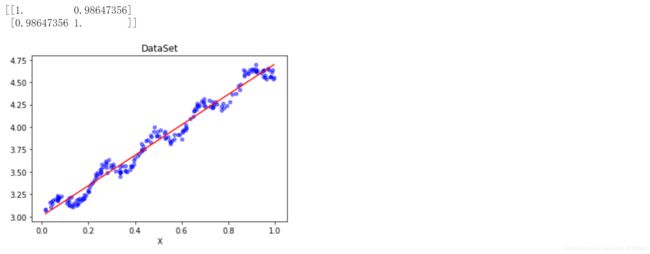
def plotDataSet():
xArr, yArr = loadDataSet('ex0.txt')
ws = standRegres(xArr, yArr)
xMat = np.mat(xArr)
yMat = np.mat(yArr)
xCopy = xMat.copy()
xCopy.sort(0)
yHat = xCopy * ws
yHat1 = xMat * ws
print(np.corrcoef(yHat1.T, yMat))
fig = plt.figure()
ax = fig.add_subplot(111)
ax.plot(xCopy[:, 1], yHat, c='red')
ax.scatter(xMat[:, 1].flatten().A[0], yMat.flatten().A[0], s=20, c='blue', alpha=.5)
plt.title('DataSet')
plt.xlabel('X')
plt.show()
if __name__ == '__main__':
plotDataSet()

from matplotlib.font_manager import FontProperties
import matplotlib.pyplot as plt
import numpy as np
"""
Desc:
加载数据
Parameters:
filename - 文件名
Returns:
xArr - x数据集
yArr - y数据集
"""
def loadDataSet(filename):
numFeat = len(open(filename).readline().split('\t')) - 1
xArr = []
yArr = []
fr = open(filename)
for line in fr.readlines():
lineArr = []
curLine = line.strip().split('\t')
for i in range(numFeat):
lineArr.append(float(curLine[i]))
xArr.append(lineArr)
yArr.append(float(curLine[-1]))
return xArr, yArr
"""
Desc:
使用局部加权线性回归计算回归系数w
Parameters:
testPoint - 测试样本点
xArr - x数据集
yArr - y数据集
k - 高斯核的k,自定义参数
Returns:
ws - 回归系数
"""
def lwlr(testPoint, xArr, yArr, k=1.0):
xMat = np.mat(xArr)
yMat = np.mat(yArr).T
m = np.shape(xMat)[0]
weights = np.mat(np.eye((m)))
for j in range(m):
diffMat = testPoint - xMat[j, :]
weights[j, j] = np.exp(diffMat * diffMat.T / (-2.0 * k**2))
xTx = xMat.T * (weights * xMat)
if np.linalg.det(xTx) == 0.0:
print("矩阵为奇异矩阵,不能求逆")
return
ws = (xTx.I) * (xMat.T * (weights * yMat))
return testPoint * ws
"""
Desc:
局部加权线性回归测试
Parameters:
testArr - 测试数据集
xArr - x数据集
yArr - y数据集
k - 高斯核的k,自定义参数
Returns:
ws - 回归系数
"""
def lwlrTest(testArr, xArr, yArr, k=1.0):
m = np.shape(testArr)[0]
yHat = np.zeros(m)
for i in range(m):
yHat[i] = lwlr(testArr[i], xArr, yArr, k)
return yHat
"""
Desc:
绘制多条局部加权回归曲线
Parameters:
None
Returns:
None
"""
def plotlwlrRegression():
font = FontProperties(fname=r"C:\Windows\Fonts\simsun.ttc", size=14)
xArr, yArr = loadDataSet('ex0.txt')
yHat_1 = lwlrTest(xArr, xArr, yArr, 1.0)
yHat_2 = lwlrTest(xArr, xArr, yArr, 0.01)
yHat_3 = lwlrTest(xArr, xArr, yArr, 0.003)
xMat = np.mat(xArr)
yMat = np.mat(yArr)
srtInd = xMat[:, 1].argsort(0)
xSort = xMat[srtInd][:, 0, :]
fig, axs = plt.subplots(nrows=3, ncols=1, sharex=False, sharey=False, figsize=(10, 8))
axs[0].plot(xSort[:, 1], yHat_1[srtInd], c='red')
axs[1].plot(xSort[:, 1], yHat_2[srtInd], c='red')
axs[2].plot(xSort[:, 1], yHat_3[srtInd], c='red')
axs[0].scatter(xMat[:, 1].flatten().A[0], yMat.flatten().A[0], s=20, c='blue', alpha=.5)
axs[1].scatter(xMat[:, 1].flatten().A[0], yMat.flatten().A[0], s=20, c='blue', alpha=.5)
axs[2].scatter(xMat[:, 1].flatten().A[0], yMat.flatten().A[0], s=20, c='blue', alpha=.5)
axs0_title_text = axs[0].set_title(u'局部加权回归曲线,k=1.0', FontProperties=font)
axs1_title_text = axs[1].set_title(u'局部加权回归曲线,k=0.01', FontProperties=font)
axs2_title_text = axs[2].set_title(u'局部加权回归曲线,k=0.003', FontProperties=font)
plt.setp(axs0_title_text, size=8, weight='bold', color='red')
plt.setp(axs1_title_text, size=8, weight='bold', color='red')
plt.setp(axs2_title_text, size=8, weight='bold', color='red')
plt.xlabel('X')
plt.show()
if __name__ == '__main__':
plotlwlrRegression()

import numpy as np
"""
Desc:
加载数据
Parameters:
filename - 文件名
Returns:
xArr - x数据集
yArr - y数据集
"""
def loadDataSet(filename):
numFeat = len(open(filename).readline().split('\t')) - 1
xArr = []
yArr = []
fr = open(filename)
for line in fr.readlines():
lineArr = []
curLine = line.strip().split('\t')
for i in range(numFeat):
lineArr.append(float(curLine[i]))
xArr.append(lineArr)
yArr.append(float(curLine[-1]))
return xArr, yArr
"""
Desc:
使用局部加权线性回归计算回归系数w
Parameters:
testPoint - 测试样本点
xArr - x数据集
yArr - y数据集
k - 高斯核的k,自定义参数
Returns:
ws - 回归系数
"""
def lwlr(testPoint, xArr, yArr, k=1.0):
xMat = np.mat(xArr)
yMat = np.mat(yArr).T
m = np.shape(xMat)[0]
weights = np.mat(np.eye((m)))
for j in range(m):
diffMat = testPoint - xMat[j, :]
weights[j, j] = np.exp(diffMat * diffMat.T / (-2.0 * k**2))
xTx = xMat.T * (weights * xMat)
if np.linalg.det(xTx) == 0.0:
print("矩阵为奇异矩阵,不能求逆")
return
ws = (xTx.I) * (xMat.T * (weights * yMat))
return testPoint * ws
"""
Desc:
局部加权线性回归测试
Parameters:
testArr - 测试数据集
xArr - x数据集
yArr - y数据集
k - 高斯核的k,自定义参数
Returns:
ws - 回归系数
"""
def lwlrTest(testArr, xArr, yArr, k=1.0):
m = np.shape(testArr)[0]
yHat = np.zeros(m)
for i in range(m):
yHat[i] = lwlr(testArr[i], xArr, yArr, k)
return yHat
"""
Desc:
计算回归系数w
Parameters:
xArr - x数据集
yArr - y数据集
Returns:
ws - 回归系数
"""
def standRegres(xArr, yArr):
xMat = np.mat(xArr)
yMat = np.mat(yArr).T
xTx = xMat.T * xMat
if np.linalg.det(xTx) == 0.0:
print("矩阵为奇异矩阵,不能求逆")
return
ws = (xTx.I) * (xMat.T) * yMat
return ws
"""
Desc:
误差大小评价函数
Parameters:
yArr - 真实数据
yHatArr - 预测数据
Returns:
ws - 回归系数
"""
def rssError(yArr, yHatArr):
return ((yArr - yHatArr)**2).sum()
if __name__ == '__main__':
abX, abY = loadDataSet('abalone.txt')
print("训练集与测试集相同:局部加权线性回归,核k的大小对预测的影响:")
yHat01 = lwlrTest(abX[0:99], abX[0:99], abY[0:99], 0.1)
yHat1 = lwlrTest(abX[0:99], abX[0:99], abY[0:99], 1)
yHat10 = lwlrTest(abX[0:99], abX[0:99], abY[0:99], 10)
print('k=0.1时,误差大小为:', rssError(abY[0:99], yHat01.T))
print('k=1时,误差大小为:', rssError(abY[0:99], yHat1.T))
print('k=10时,误差大小为:', rssError(abY[0:99], yHat10.T))
print('')
print("训练集与测试集不同:局部加权线性回归,核k的大小是越小越好吗?更换数据集,测试结果如下:")
yHat01 = lwlrTest(abX[100:199], abX[0:99], abY[0:99], 0.1)
yHat1 = lwlrTest(abX[100:199], abX[0:99], abY[0:99], 1)
yHat10 = lwlrTest(abX[100:199], abX[0:99], abY[0:99], 10)
print('k=0.1时,误差大小为:', rssError(abY[100:199], yHat01.T))
print('k=1时,误差大小为:', rssError(abY[100:199], yHat1.T))
print('k=10时,误差大小为:', rssError(abY[100:199], yHat10.T))
print('')
print("训练集与测试集不同:简单的线性回归与k=1时的局部加权线性回归对比:")
print('k=1时,误差大小为:', rssError(abY[100:199], yHat1.T))
ws = standRegres(abX[0:99], abY[0:99])
yHat = np.mat(abX[100:199]) * ws
print('简单的线性回归误差大小:', rssError(abY[100:199], yHat.T.A))

import numpy as np
from bs4 import BeautifulSoup
import random
"""
Desc:
从页面读取数据,生成retX和retY列表
Parameters:
retX - 数据X
retY - 数据Y
inFile - HTML文件
yr - 年份
numPce - 乐高部件数目
origPrc - 原价
Returns:
None
"""
def scrapePage(retX, retY, inFile, yr, numPce, origPrc):
with open(inFile, encoding='utf-8') as f:
html = f.read()
soup = BeautifulSoup(html)
i = 1
currentRow = soup.find_all('table', r='%d' % i)
while(len(currentRow) != 0):
currentRow = soup.find_all('table', r='%d' % i)
title = currentRow[0].find_all('a')[1].text
lwrTitle = title.lower()
if(lwrTitle.find('new') > -1) or (lwrTitle.find('nisb') > -1):
newFlag = 1.0
else:
newFlag = 0.0
soldUnicde = currentRow[0].find_all('td')[3].find_all('span')
if len(soldUnicde) == 0:
print("商品#%d没有出售" % i)
else:
soldPrice = currentRow[0].find_all('td')[4]
priceStr = soldPrice.text
priceStr = priceStr.replace('$', '')
priceStr = priceStr.replace(',', '')
if len(soldPrice) > 1:
priceStr = priceStr.replace('Free shipping', '')
sellingPrice = float(priceStr)
if sellingPrice > origPrc * 0.5:
print('%d\t%d\t%d\t%f\t%f' % (yr, numPce, newFlag, origPrc, sellingPrice))
retX.append([yr, numPce, newFlag, origPrc])
retY.append(sellingPrice)
i += 1
currentRow = soup.find_all('table', r='%d' % i)
"""
Desc:
依次读取六种乐高套装的数据,并生成数据矩阵
Parameters:
retX - 数据X
retY - 数据Y
Returns:
None
"""
def setDataCollect(retX, retY):
scrapePage(retX, retY, './lego/lego8288.html', 2006, 800, 49.99)
scrapePage(retX, retY, './lego/lego10030.html', 2002, 3096, 269.99)
scrapePage(retX, retY, './lego/lego10179.html', 2007, 5195, 499.99)
scrapePage(retX, retY, './lego/lego10181.html', 2007, 3428, 199.99)
scrapePage(retX, retY, './lego/lego10189.html', 2008, 5922, 299.99)
scrapePage(retX, retY, './lego/lego10196.html', 2009, 3263, 249.99)
"""
Desc:
数据标准化
Parameters:
xMat - x数据集
yMat - y数据集
Returns:
inxMat - 标准化后的x数据集
inyMat - 标准化后的y数据集
"""
def regularize(xMat, yMat):
inxMat = xMat.copy()
inyMat = yMat.copy()
yMean = np.mean(yMat, 0)
inyMat = yMat - yMean
inMeans = np.mean(inxMat, 0)
inVar = np.var(inxMat, 0)
print(inMeans)
inxMat = (inxMat - inMeans) / inVar
return inxMat, inyMat
"""
Desc:
计算平方误差
Parameters:
yArr - 预测值
yHatArr - 真实值
Returns:
平方误差
"""
def rssError(yArr, yHatArr):
return ((yArr - yHatArr)**2).sum()
"""
Desc:
计算回归系数w
Parameters:
xArr - x数据集
yArr - y数据集
Returns:
ws - 回归系数
"""
def standRegres(xArr, yArr):
xMat = np.mat(xArr)
yMat = np.mat(yArr).T
xTx = xMat.T * xMat
if np.linalg.det(xTx) == 0.0:
print("矩阵为奇异矩阵,不能求逆")
return
ws = (xTx.I) * (xMat.T) * yMat
return ws
"""
Desc:
岭回归
Parameters:
xMat - x数据集
yMat - y数据集
lam - 缩减系数
Returns:
ws - 回归系数
"""
def ridgeRegres(xMat, yMat, lam=0.2):
xTx = xMat.T * xMat
demon = xTx + np.eye(np.shape(xMat)[1]) * lam
if np.linalg.det(demon) == 0.0:
print("矩阵为奇异矩阵,不能求逆")
return
ws = (demon.I) * (xMat.T) * yMat
return ws
"""
Desc:
岭回归测试
Parameters:
xArr - x数据集
yArr - y数据集
Returns:
wMat - 回归系数矩阵
"""
def ridgeTest(xArr, yArr):
xMat = np.mat(xArr)
yMat = np.mat(yArr).T
yMean = np.mean(yMat, axis=0)
yMat = yMat - yMean
xMeans = np.mean(xMat, axis=0)
xVar = np.var(xMat, axis=0)
xMat = (xMat - xMeans) / xVar
numTestPts = 30
wMat = np.zeros((numTestPts, np.shape(xMat)[1]))
for i in range(numTestPts):
ws = ridgeRegres(xMat, yMat, np.exp(i - 10))
wMat[i, :] = ws.T
return wMat
"""
Desc:
使用简单的线性回归
Parameters:
None
Returns:
None
"""
def useStandRegres():
lgX = []
lgY = []
setDataCollect(lgX, lgY)
data_num, features_num = np.shape(lgX)
lgx1 = np.mat(np.ones((data_num, features_num+1)))
lgx1[:, 1:5] = np.mat(lgX)
ws = standRegres(lgx1, lgY)
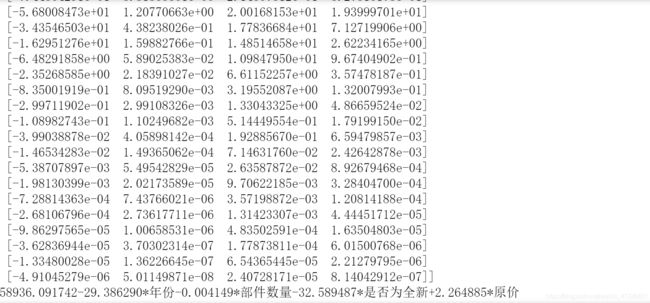
print("%f%+f*年份%+f*部件数量%+f*是否为全新%+f*原价" % (ws[0], ws[1], ws[2], ws[3], ws[4]))
"""
Desc:
交叉验证岭回归
Parameters:
xArr - x数据集
yArr - y数据集
numVal - 交叉验证次数
Returns:
wMat - 回归系数矩阵
"""
def crossValidation(xArr, yArr, numVal=10):
m = len(yArr)
indexList = list(range(m))
errorMat = np.zeros((numVal, 30))
for i in range(numVal):
trainX = []
trainY = []
testX = []
testY = []
random.shuffle(indexList)
for j in range(m):
if j < m * 0.9:
trainX.append(xArr[indexList[j]])
trainY.append(yArr[indexList[j]])
else:
testX.append(xArr[indexList[j]])
testY.append(yArr[indexList[j]])
wMat = ridgeTest(trainX, trainY)
for k in range(30):
matTestX = np.mat(testX)
matTrainX = np.mat(trainX)
meanTrain = np.mean(matTrainX, 0)
varTrain = np.var(matTrainX, 0)
matTestX = (matTestX - meanTrain) / varTrain
yEst = matTestX * np.mat(wMat[k, :]).T + np.mean(trainY)
errorMat[i, k] = rssError(yEst.T.A, np.array(testY))
meanErrors = np.mean(errorMat, 0)
minMean = float(min(meanErrors))
bestWeights = wMat[np.nonzero(meanErrors == minMean)]
xMat = np.mat(xArr)
yMat = np.mat(yArr).T
meanX = np.mean(xMat, 0)
varX = np.var(xMat, 0)
unReg = bestWeights / varX
print("%f%+f*年份%+f*部件数量%+f*是否为全新%+f*原价" % ((-1 * np.sum(np.multiply(meanX, unReg)) + np.mean(yMat)), unReg[0, 0], unReg[0, 1], unReg[0, 2], unReg[0, 3]))
if __name__ == '__main__':
lgX = []
lgY = []
setDataCollect(lgX, lgY)
print(ridgeTest(lgX, lgY))
crossValidation(lgX, lgY)

Ridge Regression
from matplotlib.font_manager import FontProperties
import matplotlib.pyplot as plt
import numpy as np
"""
Desc:
加载数据
Parameters:
filename - 文件名
Returns:
xArr - x数据集
yArr - y数据集
"""
def loadDataSet(filename):
numFeat = len(open(filename).readline().split('\t')) - 1
xArr = []
yArr = []
fr = open(filename)
for line in fr.readlines():
lineArr = []
curLine = line.strip().split('\t')
for i in range(numFeat):
lineArr.append(float(curLine[i]))
xArr.append(lineArr)
yArr.append(float(curLine[-1]))
return xArr, yArr
"""
Desc:
岭回归
Parameters:
xMat - x数据集
yMat - y数据集
lam - 缩减系数
Returns:
ws - 回归系数
"""
def ridgeRegres(xMat, yMat, lam=0.2):
xTx = xMat.T * xMat
demon = xTx + np.eye(np.shape(xMat)[1]) * lam
if np.linalg.det(demon) == 0.0:
print("矩阵为奇异矩阵,不能求逆")
return
ws = (demon.I) * (xMat.T) * yMat
return ws
"""
Desc:
岭回归测试
Parameters:
xArr - x数据集
yArr - y数据集
Returns:
wMat - 回归系数矩阵
"""
def ridgeTest(xArr, yArr):
xMat = np.mat(xArr)
yMat = np.mat(yArr).T
yMean = np.mean(yMat, axis=0)
yMat = yMat - yMean
xMeans = np.mean(xMat, axis=0)
xVar = np.var(xMat, axis=0)
xMat = (xMat - xMeans) / xVar
numTestPts = 30
wMat = np.zeros((numTestPts, np.shape(xMat)[1]))
for i in range(numTestPts):
ws = ridgeRegres(xMat, yMat, np.exp(i - 10))
wMat[i, :] = ws.T
return wMat
"""
Desc:
绘制岭回归系数矩阵
Parameters:
None
Returns:
None
"""
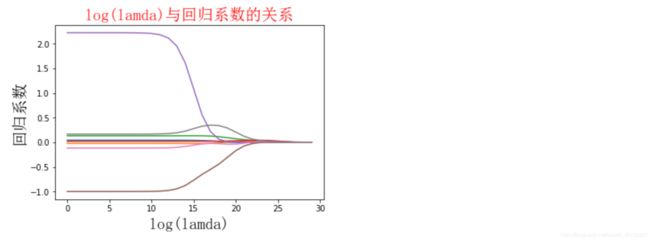
def plotwMat():
font = FontProperties(fname=r"C:\Windows\Fonts\simsun.ttc", size=14)
abX, abY = loadDataSet('abalone.txt')
redgeWeights = ridgeTest(abX, abY)
fig = plt.figure()
ax = fig.add_subplot(111)
ax.plot(redgeWeights)
ax_title_text = ax.set_title(u'log(lamda)与回归系数的关系', FontProperties=font)
ax_xlabel_text = ax.set_xlabel(u'log(lamda)', FontProperties=font)
ax_ylabel_text = ax.set_ylabel(u'回归系数', FontProperties=font)
plt.setp(ax_title_text, size=20, weight='bold', color='red')
plt.setp(ax_xlabel_text, size=20, weight='bold', color='black')
plt.setp(ax_ylabel_text, size=20, weight='bold', color='black')
plt.show()
if __name__ == '__main__':
plotwMat()

from matplotlib.font_manager import FontProperties
import matplotlib.pyplot as plt
import numpy as np
"""
Desc:
加载数据
Parameters:
filename - 文件名
Returns:
xArr - x数据集
yArr - y数据集
"""
def loadDataSet(filename):
numFeat = len(open(filename).readline().split('\t')) - 1
xArr = []
yArr = []
fr = open(filename)
for line in fr.readlines():
lineArr = []
curLine = line.strip().split('\t')
for i in range(numFeat):
lineArr.append(float(curLine[i]))
xArr.append(lineArr)
yArr.append(float(curLine[-1]))
return xArr, yArr
"""
Desc:
数据标准化
Parameters:
xMat - x数据集
yMat - y数据集
Returns:
inxMat - 标准化后的x数据集
inyMat - 标准化后的y数据集
"""
def regularize(xMat, yMat):
inxMat = xMat.copy()
inyMat = yMat.copy()
yMean = np.mean(yMat, 0)
inyMat = yMat - yMean
inMeans = np.mean(inxMat, 0)
inVar = np.var(inxMat, 0)
inxMat = (inxMat - inMeans) / inVar
return inxMat, inyMat
"""
Desc:
计算平方误差
Parameters:
yArr - 预测值
yHatArr - 真实值
Returns:
平方误差
"""
def rssError(yArr, yHatArr):
return ((yArr - yHatArr)**2).sum()
"""
Desc:
前向逐步线性回归
Parameters:
xArr - x输入数据
yArr - y输入数据
eps - 每次迭代需要调整的步长
numIt - 迭代次数
Returns:
returnMat - numIt次迭代的回归系数矩阵
"""
def stageWise(xArr, yArr, eps=0.01, numIt=100):
xMat = np.mat(xArr)
yMat = np.mat(yArr).T
xMat, yMat = regularize(xMat, yMat)
m, n = np.shape(xMat)
returnMat = np.zeros((numIt, n))
ws = np.zeros((n, 1))
wsTest = ws.copy()
wsMax = ws.copy()
for i in range(numIt):
lowestError = float('inf')
for j in range(n):
for sign in [-1, 1]:
wsTest = ws.copy()
wsTest[j] += eps * sign
yTest = xMat * wsTest
rssE = rssError(yMat.A, yTest.A)
if rssE < lowestError:
lowestError = rssE
wsMax = wsTest
ws = wsMax.copy()
returnMat[i, :] = ws.T
return returnMat
"""
Desc:
绘制岭回归系数矩阵
Parameters:
None
Returns:
None
"""
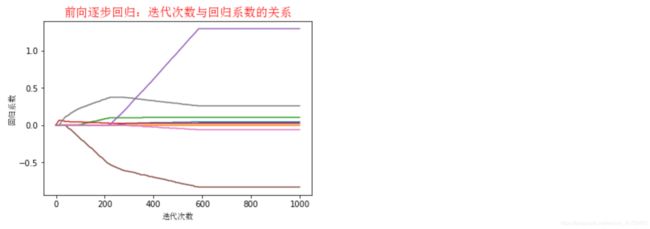
def plotstageWiseMat():
font = FontProperties(fname=r"C:\Windows\Fonts\simsun.ttc", size=14)
xArr, yArr = loadDataSet('abalone.txt')
returnMat = stageWise(xArr, yArr, 0.005, 1000)
fig = plt.figure()
ax = fig.add_subplot(111)
ax.plot(returnMat)
ax_title_text = ax.set_title(u'前向逐步回归:迭代次数与回归系数的关系', FontProperties=font)
ax_xlabel_text = ax.set_xlabel(u'迭代次数', FontProperties=font)
ax_ylabel_text = ax.set_ylabel(u'回归系数', FontProperties=font)
plt.setp(ax_title_text, size=15, weight='bold', color='red')
plt.setp(ax_xlabel_text, size=10, weight='bold', color='black')
plt.setp(ax_ylabel_text, size=10, weight='bold', color='black')
plt.show()
if __name__ == '__main__':
plotstageWiseMat()

from sklearn import linear_model
from bs4 import BeautifulSoup
"""
Desc:
从页面读取数据,生成retX和retY列表
Parameters:
retX - 数据X
retY - 数据Y
inFile - HTML文件
yr - 年份
numPce - 乐高部件数目
origPrc - 原价
Returns:
None
"""
def scrapePage(retX, retY, inFile, yr, numPce, origPrc):
with open(inFile, encoding='utf-8') as f:
html = f.read()
soup = BeautifulSoup(html)
i = 1
currentRow = soup.find_all('table', r='%d' % i)
while(len(currentRow) != 0):
currentRow = soup.find_all('table', r='%d' % i)
title = currentRow[0].find_all('a')[1].text
lwrTitle = title.lower()
if(lwrTitle.find('new') > -1) or (lwrTitle.find('nisb') > -1):
newFlag = 1.0
else:
newFlag = 0.0
soldUnicde = currentRow[0].find_all('td')[3].find_all('span')
if len(soldUnicde) == 0:
print("商品#%d没有出售" % i)
else:
soldPrice = currentRow[0].find_all('td')[4]
priceStr = soldPrice.text
priceStr = priceStr.replace('$', '')
priceStr = priceStr.replace(',', '')
if len(soldPrice) > 1:
priceStr = priceStr.replace('Free shipping', '')
sellingPrice = float(priceStr)
if sellingPrice > origPrc * 0.5:
print('%d\t%d\t%d\t%f\t%f' % (yr, numPce, newFlag, origPrc, sellingPrice))
retX.append([yr, numPce, newFlag, origPrc])
retY.append(sellingPrice)
i += 1
currentRow = soup.find_all('table', r='%d' % i)
"""
Desc:
依次读取六种乐高套装的数据,并生成数据矩阵
Parameters:
retX - 数据X
retY - 数据Y
Returns:
None
"""
def setDataCollect(retX, retY):
scrapePage(retX, retY, './lego/lego8288.html', 2006, 800, 49.99)
scrapePage(retX, retY, './lego/lego10030.html', 2002, 3096, 269.99)
scrapePage(retX, retY, './lego/lego10179.html', 2007, 5195, 499.99)
scrapePage(retX, retY, './lego/lego10181.html', 2007, 3428, 199.99)
scrapePage(retX, retY, './lego/lego10189.html', 2008, 5922, 299.99)
scrapePage(retX, retY, './lego/lego10196.html', 2009, 3263, 249.99)
"""
Desc:
使用sklearn
Parameters:
None
Returns:
None
"""
def usesklearn():
reg = linear_model.Ridge(alpha=.5)
lgX = []
lgY = []
setDataCollect(lgX, lgY)
reg.fit(lgX, lgY)
print("%f%+f*年份%+f*部件数量%+f*是否为全新%+f*原价" % (reg.intercept_, reg.coef_[0], reg.coef_[1], reg.coef_[2], reg.coef_[3]))
if __name__ == '__main__':
usesklearn()


