<
template
>
<
div
>
<
div
:style="{width:
'90%',height:
height,}"
class=
"map"
ref=
"myEchart"
>
div
>
div
>
template
>
<
script
>
import
api
from
'@/fetch/api'
import
echarts
from
'echarts'
export
default {
props: {
areaCode: {
type:
String,
default:
"22"
},
max: {
type:
String,
default:
'500'
},
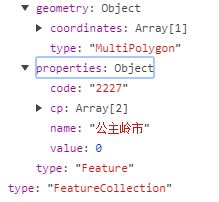
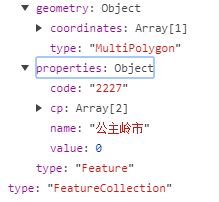
mapData: {// geo.json数据
type:
Object,
default: []
},
list: {
type:
Array,
default: []
},
height: {
type:
String,
default:
document.
documentElement.
clientHeight-
320+
'px'
}
},
data() {
return {
chart:
null,
chartData: [],
option: {
title : {
left:
'center',
textStyle:{
fontSize:
16,
}
}
},
}
},
mounted() {
this.
initChart();
},
methods: {
initChart() {
// 初始化
this.
chart =
echarts.
init(
this.
$refs.
myEchart);
this.
getAreaMapInfoList();
},
getAreaMapInfoList () {
// 获取地图数据
for(
var
i=
0;
i<
this.
mapData.
features.
length;
i++ ){
let
name =
this.
mapData.
features[
i].
properties.
name;
let
code =
this.
mapData.
features[
i].
properties.
code;
let
cp =
this.
mapData.
features[
i].
properties.
cp;
var
totalCount =
0;
for(
var
j=
0;
j<
this.
list.
length;
j++ ){
if(
this.
list[
j].
code ==
code){
totalCount =
this.
list[
j].
entNum;
break;
}
}
this.
chartData.
push({
name:
name,
value:
cp.
concat(
totalCount),
code:
code
});
}
//注册地图
echarts.
registerMap(
'jilin',
this.
mapData);
this.
renderMap(
'jilin',
this.
chartData);
},
renderMap(
map,
data){
//绘制地图
this.
option.
title.
subtext =
"";
//地理坐标系组件
this.
option.
geo = {
//引入地图 ,渲染地图凹凸显示
map:
map,
label: {
normal: {
show:
true,
color:
'#fff'
},
emphasis: {
show:
false,
color:
'#fff'
}
},
roam:
false,
//禁止缩放
zoom:
1,
itemStyle: {
normal: {
borderColor:
'#387ba7',
//地图边界线的颜色
areaColor:
'#1c3c63',
//地图整体区域的颜色
shadowColor:
'rgba(0, 0, 0, 0.5)',
shadowBlur:
10,
shadowOffsetX:
10
},
emphasis: {
areaColor:
'#132845'
//鼠标滑过的颜色
}
}
},
// 地图标点
this.
option.
series = [
{
name:
'点',
type:
'scatter',
coordinateSystem:
'geo',
symbol:
'pin',
//关系图节点标记的图形
symbolSize: [
30,
30],
symbolOffset: [
0,
'-40%'],
//关系图节点标记相对于原本位置的偏移。[0, '50%']
large :
true,
label: {
normal: {
show:
true,
textStyle: {
color:
'#fff',
fontSize:
9,
}
}
},
itemStyle : {
//===============图形样式,有 normal 和 emphasis 两个状态。normal 是图形在默认状态下的样式;emphasis 是图形在高亮状态下的样式,比如在鼠标悬浮或者图例联动高亮时。
normal : {
//默认样式
label : {
show :
true
},
borderType :
'solid',
//图形描边类型,默认为实线,支持 'solid'(实线), 'dashed'(虚线), 'dotted'(点线)。
borderColor :
'rgba(255,215,0,0.4)',
//设置图形边框为淡金色,透明度为0.4
borderWidth :
2,
//图形的描边线宽。为 0 时无描边。
opacity :
1
// 图形透明度。支持从 0 到 1 的数字,为 0 时不绘制该图形。默认0.5
},
emphasis : {
//高亮状态
}
},
lineStyle : {
//==========关系边的公用线条样式。
normal : {
color :
'rgba(255,0,255,0.4)',
width :
'3',
type :
'dotted',
//线的类型 'solid'(实线)'dashed'(虚线)'dotted'(点线)
curveness :
0.3,
//线条的曲线程度,从0到1
opacity :
1
// 图形透明度。支持从 0 到 1 的数字,为 0 时不绘制该图形。默认0.5
},
emphasis : {
//高亮状态
}
},
label : {
//=============图形上的文本标签
normal : {
show :
true,
//是否显示标签。
position :
'inside',
//标签的位置。['50%', '50%'] [x,y]
textStyle : {
//标签的字体样式
color :
'#cde6c7',
//字体颜色
fontStyle :
'normal',
//文字字体的风格 'normal'标准 'italic'斜体 'oblique' 倾斜
fontWeight :
'bolder',
//'normal'标准'bold'粗的'bolder'更粗的'lighter'更细的或100 | 200 | 300 | 400...
fontFamily :
'sans-serif',
//文字的字体系列
fontSize :
12,
//字体大小
}
},
emphasis : {
//高亮状态
}
},
edgeLabel : {
//==============线条的边缘标签
normal : {
show :
false
},
emphasis : {
//高亮状态
}
},
zlevel:
12,
data:
data,
}
];
//渲染地图
this.
chart.
setOption(
this.
option);
}
}
}
script
>


