内核调试器
Section #1. Kernel Debuggers
The instruction-level Kernel DeBugger (kdb) and the source-level Kernel GNU DeBugger (kgdb) are the two main Linux kernel debuggers. Whether to include a debugger as part of the stock kernel has been an oft-debated point in kernel mailing lists, but a lightweight version of kgdb has finally been integrated with the mainline kernel starting with the 2.6.26 release. Even if you prefer to stay away from the seemingly esoteric operation of kernel debuggers, you can glean information about kernel panics and peek at kernel variables via the plain GNU DeBugger (gdb). JTAG debuggers use hardware-assisted debugging and are powerful but expensive.
Kernel debuggers make kernel internals more transparent. You can single-step through instructions, disassemble instructions, display and modify kernel variables, and look at stack traces. In this section, let’s learn the basics of kernel debuggers with the help of some examples.
指令级内核DeBugger(kdb)和源代码级内核GNU DeBugger(kgdb)是两个主要的Linux内核调试器。是否将调试器作为内核的一部分,这是一个在内核邮件列表中经常被争论的问题,但是从2.6.26版本开始,kgdb的轻量级版本最终已经与主线内核集成在一起。即使您更喜欢远离看似神秘的内核调试器操作,您也可以通过GNU DeBugger(gdb)收集有关内核panic的信息并查看内核变量。 JTAG调试器使用硬件辅助调试,功能强大但价格昂贵。
内核调试器使内核更加透明。您可以单步执行指令,反汇编指令,显示和修改内核变量,以及查看堆栈跟踪。在本节中,我们将借助一些示例了解内核调试器的基础知识。
Entering a Debugger启动调试器
You can enter a kernel debugger in multiple ways. One way is to pass command-line arguments that ask the kernel to enter the debugger during boot. Another way is via software or hardware breakpoints. A breakpoint is an address where you want execution stopped and control transferred to the debugger. A software breakpoint replaces the instruction at that address with something else that causes an exception. You can set software breakpoints either using debugger commands or by inserting them into your code. For x86-based systems, you can set a software breakpoint in your kernel source code as follows:
您可以通过多种方式启动内核调试程序。一种方法是通过命令行参数启动,要求内核在引导期间启动调试器。 另一种方法是通过软件或硬件断点。 断点是您希望执行停止并将控制权转移到调试器的地址。软件断点将该地址处的指令替换为导致异常的其他内容。您可以使用调试器命令或将它们插入代码来设置软件断点。对于基于x86的系统,您可以在内核源代码中设置软件断点,如下所示:
asm(" int $3");
Alternatively, you can invoke the BREAKPOINT macro, which translates to the appropriate architecture-dependent instruction.
或者,您可以调用BREAKPOINT宏,该宏转换为适当的体系结构相关指令。
You can use hardware breakpoints in place of software breakpoints if the instruction where you need to stop is in flash memory, where it cannot be replaced by the debugger. A hardware breakpoint needs processor support. The corresponding address needs to be added to a debug register. You can only have as many hardware breakpoints as the number of debug registers supported by the processor.
如果需要停止的指令位于闪存中,则可以使用硬件断点代替软件断点,调试器无法用软件断点取代硬件断点。硬件断点需要处理器支持。需要将相应的地址添加到调试寄存器中。 您拥有的硬件断点的数量取决于处理器支持的调试寄存器的数量。
You can also ask a debugger to set a watchpoint on a variable. The debugger stops execution whenever an instruction modifies data at the watchpoint address.
您还可以要求调试器在变量上设置观察点。只要指令修改观察点地址处的数据,调试器就会停止执行。
Yet another common method to enter a debugger is by pressing an attention key, but this won’t work in many instances. If your code is sitting in a tight loop after disabling interrupts, the kernel will not get a chance to process the attention key and enter the debugger. For example, you can’t enter the debugger via an attention key if your code does something like this:
进入调试器的另一种常用方法是按下功能键,但这在许多情况下不起作用。如果在禁用中断后代码处于高速循环中,内核将无法响应功能键并进入调试器。例如,如果您的代码执行如下操作,则无法通过功能键进入调试器:
unsigned long flags;
local_irq_save(flags);
while (1) continue;
local_irq_restore(flags);
When control is transferred to the debugger, you can start your analysis using various debugger commands.
当控制转移到调试器时,您可以使用各种调试器命令进行分析。
Kernel Debugger (kdb)内核调试器(KDB)
Kdb is an instruction-level debugger used for debugging kernel code and device drivers. Before you can use it, you need to patch your kernel sources with kdb support and recompile the kernel. (Refer to the section “Downloads” for information on downloading kdb patches.) The main advantage of kdb is that it’s easy to set up, because you don’t need an additional machine to do the debugging (unlike kgdb). The main disadvantage is that you need to correlate your sources with disassembled code (again, unlike kgdb).
Kdb是一个指令级调试器,用于调试内核代码和设备驱动程序。在使用kdb之前,需要把kdb的补丁打到内核源代码上并重新编译内核。(有关下载kdb补丁的信息,请参阅“下载”部分。)kdb的主要优点是它易于设置,因为您不需要额外的机器来进行调试(与kgdb不同)。主要缺点是您需要将源代码与反汇编代码关联起来(同样,与kgdb不同)。
Let’s wet our toes in kdb with the help of an example. Here’s the crime scene: You have modified a kernel serial driver to work with your x86-based hardware, but the driver isn’t working, and you want kdb to help nab the culprit.
让我们借助一个例子熟悉kdb。这是场景:您已经修改了内核串行驱动程序以使用基于x86的硬件,但驱动程序无法正常工作,您希望kdb帮助找到根本原因。
Let’s start our search for fingerprints by setting a breakpoint at the serial driver open() entry point. Remember, because kdb is not a source-level debugger, you need to open your sources and try to match the instructions with your C code. Let’s list the source snippet in question:
让我们在串行驱动程序open()入口点设置断点进行搜索。请记住,因为kdb不是源代码级调试器,所以您需要打开源代码并尝试将指令与C代码匹配。下面是有问题的源代码段:
Press the Pause key and enter kdb. Let’s find out how the disassembled rs_open() looks. The debug sessions shown here attach explanations using the → symbol.
按“暂停”键并输入kdb。 让我们看看rs_open()反汇编代码。 此处显示的反汇编代码使用→符号附加说明。
Point A in the source code is a good place to attach a breakpoint because you can peek at both the tty structure and the info structure to see what’s going on.
源代码中的A点是附加断点的好地方,因为您可以在此处查看tty结构体和info结构体的具体值,以查看发生了什么。
Looking side by side at the source and the disassembly, rs_open+0x5a corresponds to Point A. Note that correlation is easier if the kernel is compiled without optimization flags.
并排查看源代码和反汇编,rs_open + 0x5a对应于A点。请注意,如果在没有优化标志的情况下编译内核,则源代码和反汇编代码更容易对应。
Set a breakpoint at rs_open+0x5a (which is address 0xc01cce5a) and continue execution by exiting the debugger:
在rs_open + 0x5a(地址0xc01cce5a)设置断点,然后退出调试器继续执行:
![]()
Now you need to get the kernel to call rs_open() to hit the breakpoint. To trigger this, execute an appropriate user-space program. In this case, echo some characters to the corresponding serial port (/dev/ttySX):
现在你需要让内核调用rs_open()来命中断点。要触发此操作,请执行适当的用户空间程序。在这种情况下,将一些字符写入到相应的串口(/ dev / ttySX):
bash> echo "Anjali loves kerala monsoons" > /dev/ttySX
This results in the invocation of rs_open(). The breakpoint gets hit, and kdb assumes control:
这将调用rs_open()。命中断点,kdb调试器控制内核:
Entering kdb on processor 0 due to Breakpoint @ 0xc01cce5a kdb>
Let’s now find out the contents of the info structure. If you look at the disassembly, one instruction before the breakpoint (rs_open+0x56), you see that the EAX register contains the address of the info structure. Let’s look at the register contents:
现在让我们找出info结构体的内容。 如果查看反汇编,从断点前的一条指令(rs_open + 0x56),您会看到EAX寄存器包含info结构体的地址。我们来看看寄存器内容:
So, 0xcf1ae680 is the address of the info structure. Dump its contents using the md command:
所以,0xcf1ae680是info结构体的地址。使用md命令转储其内容:
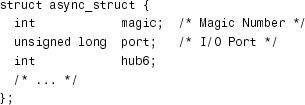
To make sense of this dump, let’s look at the corresponding structure definition. info is defined as struct async_struct in include/linux/serialP.h as follows:
为了理解这个转储,让我们看一下相应的结构体定义。info在include / linux / serialP.h中定义为struct async_struct,如下所示:
If you match the dump with the definition, 0x5301 is the magic number and 0xABC is the I/O port. Well, isn’t this interesting! 0xABC doesn’t look like a valid port. If you have done enough serial port debugging, you know that the I/O port base addresses and IRQs are configured in include/asmx86/serial.h for x86-based hardware. Change the port definition to the correct value, recompile the kernel, and continue your testing!
如果将转储与结构体定义匹配,则0x5301是幻数,0xABC是I/O端口。嗯,这是不是很有趣!0xABC看起来不像一个有效端口。如果您有足够的串口调试经验,您就会知道在基于x86硬件的include/asmx86/serial.h中配置了I/O端口基地址和IRQ。将端口定义更改为正确的值,重新编译内核,然后继续测试!
Kernel GNU Debugger (kgdb)内核GNU调试器
Kgdb is a source-level debugger. It is easier to use than kdb because you don’t need to spend time correlating assembly code with your sources. However, it’s more difficult to set up because an additional machine is needed to front-end the debugging.
Kgdb是一个源代码级调试器。它比kdb更容易使用,因为您不需要花时间将汇编代码与源代码关联。但是,Kgdb设置起来比较困难,因为需要另外的机器来进行前端调试。
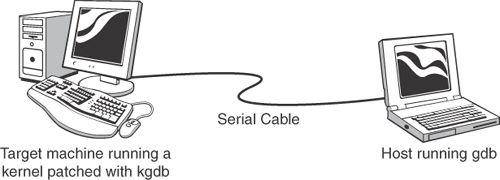
You have to use gdb in tandem with kgdb to step through kernel code. gdb runs on the host machine, whereas the kgdb-enabled kernel runs on the target hardware. The host and the target are connected via a serial null-modem cable, as shown in Figure 1.1.[1]
[1] You can also launch kgdb debug sessions over Ethernet.
您必须把kgdb与gdb一起使用来单步执行内核代码。gdb在主机上运行,而启用kgdb的内核在目标硬件上运行。主机和目标硬件通过串行零调制解调器电缆连接,如图1.1所示。
Figure 1.1. Kgdb setup
You have to inform the kernel about the identity and baud rate of the serial port via command-line arguments. Depending on the bootloader used, add the following kernel arguments to either syslinux.cfg, lilo.conf, or grub.conf:
您必须通过命令行参数通知内核有关串行端口的标识和波特率。根据所使用的引导加载程序,将以下内核参数添加到syslinux.cfg,lilo.conf或grub.conf:
kgdbwait kgdb8250=X,115200
kgdbwait asks the kernel to wait until a connection is established with the host-side gdb, X is the serial port connected to the host, and 115200 is the baud rate used for communication.
kgdbwait要求目标硬件内核等待与主机端gdb建立连接,X是连接到主机的串行端口,115200是用于通信的波特率。
Now configure the same baud rate on the host side:
在主机端配置相同的波特率:
bash> stty speed 115200 < /dev/ttySX
If your host computer is a laptop that does not have a serial port, you can use a USB-to-serial converter for the debug session. In that case, instead of /dev/ttySX, use the /dev/ttyUSBX node created by the usbserial driver.
如果您的主机是没有串行端口的笔记本电脑,则可以使用USB转串口转换器进行调试。 在这种情况下,使用usbserial驱动程序创建的/dev/ttyUSBX节点而不是/dev/ttySX。
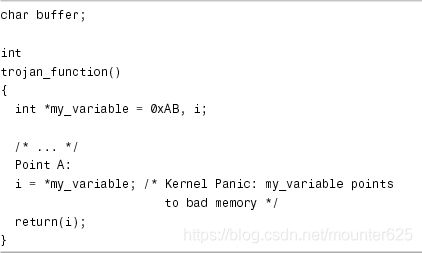
Let’s learn kgdb basics using the example of a buggy kernel module. Modules are easier to debug because the entire kernel need not be recompiled after making code changes, but remember to compile your module with the -g option to generate symbolic information. Because modules are dynamically loaded, the debugger needs to be informed about the symbolic information that the module contains. Listing 1.1 contains a buggy trojan_function(). Assume that it’s defined in drivers/char/my_module.c.
让我们使用有bug的内核模块作为例子来学习kgdb基础知识。模块更容易调试,因为在更改代码后无需重新编译整个内核,但请记住使用-g选项编译模块以生成符号信息。由于模块是动态加载的,因此需要通知调试器模块包含的符号信息。 清单1.1包含一个buggy函数 trojan_function()。假设它在drivers/char/my_module.c中定义。
Listing 1.1. Buggy Function
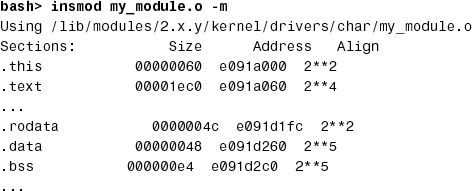
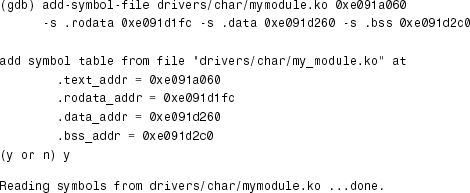
Insert my_module.ko on the target and look inside /sys/module/my_module/sections/ to decipher ELF (Executable and Linking Format) section addresses.[2] The .text section in ELF files contains code, .data contains initialized variables, .rodata contains initialized read-only variables such as strings, and .bss contains variables that are not initialized during startup. The addresses of these sections are available in the form of the files .text, .data, .rodata, and .bss in /sys/module/my_module/sections/ if you enable CONFIG_KALLSYMS during kernel configuration. To obtain the code section address, for instance, do this:
在目标机器上插入my_module.ko并查看/sys/module/my_module/sections/以解析ELF(可执行文件和链接格式)地址。[2] ELF文件中的.text部分包含代码,.data包含初始化变量,.rodata包含初始化的只读变量(如字符串),而.bss包含在启动期间未初始化的变量。如果在内核配置期间启用CONFIG_KALLSYMS,则可以在/sys/module/my_module/sections/中以文件.text,.data,.rodata和.bss的形式提供这些部分的地址。例如,要获取代码段地址,请执行以下操作:
[2] If you still use a 2.4 kernel, get the section addresses using the –m option to insmod instead:
bash> cat /sys/module/my_module/sections/.text
0xe091a060
More module load information is available from /proc/modules and /proc/kallsyms.
After you have the section addresses, invoke gdb on the host-side machine:
从/proc/modules和/proc/kallsyms获得更多模块加载信息。
获得section地址后,在主机端计算机上调用gdb:
bash> gdb vmlinux → vmlinux is the uncompressed kernel vmlinux是未压缩的内核
(gdb) target remote /dev/ttySX → Connect to the target
Because you passed kgdbwait as a kernel command-line argument, gdb gets control when the kernel boots on the target. Now inform gdb about the preceding section addresses using the add-symbol-file command:
因为您将kgdbwait作为内核命令行参数传递,所以当内核在目标机器上启动时,gdb会获得控制权。现在使用add-symbol-file命令通知gdb有关上一section的地址:
To debug the kernel panic, let’s set a breakpoint at trojan_function():
要调试内核panic,让我们在trojan_function()中设置一个断点:
![]()
When kgdb hits the breakpoint, let’s look at the stack trace, single-step until Point A, and display the value of my_variable:
当kgdb到达断点时,让我们看一下堆栈跟踪,单步运行到A点,然后显示my_variable的值:
There is an obvious bug here. my_variable points to NULL because trojan_function() forgot to allocate memory for it. Let’s just allocate the memory using kgdb, circumvent the kernel crash, and continue testing:
这里有一个明显的错误。my_variable指向NULL,因为trojan_function()忘记为它分配内存。让我们使用kgdb分配内存,避免内核崩溃,并继续测试:
Note
Kgdb ports are available for several architectures such as x86, ARM, and PowerPC. When you use kgdb to debug a target embedded device (instead of the PC shown in Figure 1.1), the gdb front-end that you run on your host system needs to be compiled to work with your target platform. For example, to debug a device driver developed for an ARM-based embedded device from your x86-based host development system, you need to use the appropriately generated gdb, often named arm-linux-gdb. The exact name depends on the distribution you use.
注意
Kgdb端口可用于多种体系结构,例如x86,ARM和PowerPC。使用kgdb调试嵌入式设备(而不是图1.1中所示的PC)时,需要编译在目标主机系统上运行的gdb前端以与目标平台一起使用。例如,从x86的主机开发系统调试为基于ARM的嵌入式设备开发的驱动程序,您需要使用基于ARM的gdb,通常名为arm-linux-gdb。 确切的名称取决于您使用的Linux发行版。
GNU Debugger (gdb)
As previously mentioned, you can use plain gdb to gather some kernel debug information. However, you can’t step through kernel code, set breakpoints, or modify kernel variables. Let’s use gdb to debug the kernel panic caused by the buggy function in Listing 1.1, but assume this time that trojan_function() is compiled as part of the kernel and not as a module, because you can’t easily peek inside modules using gdb.
如前所述,您可以使用gdb来收集一些内核调试信息。但是,您无法单步执行内核代码,设置断点或修改内核变量。 让我们使用gdb来调试由清单1.1中的buggy函数引起的内核panic。假设这次trojan_function()被编译为内核的一部分而不是模块,因为你不能轻易地使用gdb查看模块内部。
This is part of the “oops” message generated when trojan_function() is executed:
这是执行trojan_function()时生成的“oops”消息的一部分:
Copy this cryptic “oops” message to oops.txt and use the ksymoops utility to obtain more verbose output. You might need to hand-copy the message if the system is hung:
将这个神秘的“oops”消息复制到oops.txt并使用ksymoops应用程序获取更详细的输出。 如果系统挂起,您可能需要手动复制消息:
2.6 kernels emit “oops” output that can be used as is without the need of decoding using ksymoops if you enable CONFIG_KALLSYMS during kernel configuration.
2.6内核产生“oops”输出,如果在内核配置期间启用CONFIG_KALLSYMS,则可以按原样使用,而无需使用ksymoops进行解码。
Looking at the preceding dump, the “oops” has occurred inside trojan_-function(). Let’s use gdb to obtain more information. In the following invocation, vmlinux is the uncompressed kernel image, and /proc/kcore is the kernel address space:
查看前面的转储,“oops”发生在trojan_-function()中。让我们使用gdb来获取更多信息。在下面的调用中,vmlinux是未压缩的内核,而/proc/kcore是内核地址空间:
Repeated access to the same variable will not yield refreshed values due to gdb’s cached access. You can force a fresh access by rereading the core file using gdb’s core-file command. Let’s now look at the disassembly of trojan_function():
由于gdb的缓存访问,重复访问同一变量不会刷新改变量。您可以使用gdb的core-file命令重新读取核心文件,从而强制进行刷新。现在让我们看一下trojan_function()的反汇编代码:
trojan_function() looks laconic when seen in assembly due to compiler optimizations. It’s effectively copying the contents of address 0xab to the EAX register, which holds the return value from functions on x86-based systems. But 0xab does not look like a valid kernel address! Fix the bug by allocating valid memory space to my_-variable, recompile, and continue your testing.
由于编译器优化,trojan_function()在汇编中看起来很简洁。它将地址0xab的内容复制到EAX寄存器,该寄存器保存来自基于x86的系统上的函数的返回值。但0xab看起来不像一个有效的内核地址!通过为my_-variable分配有效的内存空间,重新编译并继续测试来修复错误。
JTAG Debuggers
JTAG debuggers use hardware-assist to debug code. You need specialized monitor hardware[3] and a front-end user interface (some JTAG debuggers use gdb as the front-end) to step through code. JTAG can also be used for purposes other than debugging, such as burning code onto onboard flash memory. JTAG connectors are common on development boards but are usually not part of production units.
JTAG调试器使用硬件来辅助调试代码。您需要专门的监视器硬件[3]和前端用户界面(一些JTAG调试器使用gdb作为前端)来单步执行代码。JTAG还可用于调试以外的目的,例如将代码刻录到板载闪存上。JTAG连接器在开发板上很常见,但通常不是生产系统的一部分。
[3] Some JTAG debuggers work with several processor architectures if you suitably replace the probe that connects the debugger to the target board.
JTAG debuggers usually connect to target hardware via serial port, USB, or Ethernet. With Ethernet, you can remotely access the JTAG debugger, and therefore the target board, even if the board itself does not possess a network interface.
JTAG调试器通常通过串行端口,USB或以太网连接到目标硬件。使用以太网,即使电路板本身没有网络接口,您也可以通过远程访问JTAG调试器,从而远程访问目标板。
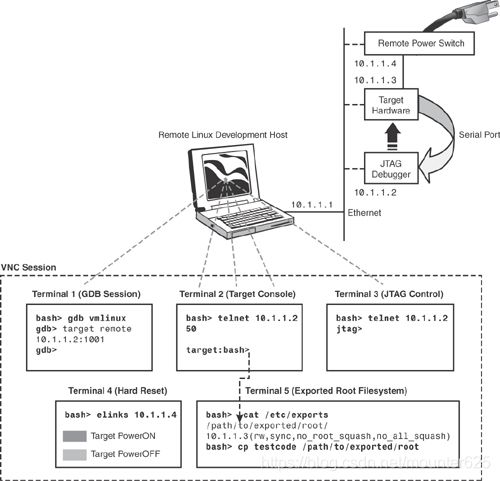
Figure 1.2 shows a JTAG-based remote debugging session in action. The JTAG debugger used in this scenario supports a gdb front end. The development host and the JTAG hardware are connected to an Ethernet LAN. The debug serial port on the target hardware is connected to the serial port on the JTAG box. Figure 1.2 achieves remote debugging on the Linux development host using five terminal sessions. Terminal 1 runs gdb, which connects to the JTAG box over the network using telnet:
图1.2显示了一个基于JTAG的远程调试会话。此方案中使用的JTAG调试器支持gdb前端。开发主机和JTAG硬件连接到以太网LAN。目标硬件上的调试串行端口连接到JTAG盒上的串行端口。图1.2使用五个终端会话在Linux开发主机上实现远程调试。终端1运行gdb,它使用telnet通过网络连接到JTAG盒:
Figure 1.2. An example JTAG-based remote debug setup
To debug boot portions of the kernel, for example, set a gdb breakpoint at start_kernel(). (You can find its address from System.map, which is generated in the root of your source tree when you build the kernel.)
例如,要调试内核的引导部分,请在start_kernel()中设置gdb断点。(您可以从System.map中找到它的地址,这是在构建内核时在源代码树的root目录中生成的。)
Terminal 2 attaches a serial console to the target. A telnet client running on Terminal 2 connects to a prespecified TCP port on the JTAG box, which is configured (using Terminal 3) to tunnel data arriving via its serial port:
终端2将串行控制台连接到目标机器。在终端2上运行的telnet客户端连接到JTAG盒上的预先指定的TCP端口,该端口被配置(使用终端3)为封装通过其串行端口到达的数据:
This is equivalent to running an emulator such as minicom after directly connecting the target’s debug serial port to the host (instead of to the JTAG box, as shown in Figure 1.2), but that’ll constrain the host to be physically adjacent to the target.
这相当于在将目标机器的串行端口直接连接到主机(而不是JTAG盒,如图1.2所示)之后运行模拟器(如minicom),但这种情况需要主机在物理上与目标机器相邻。
Terminal 3 telnets to the JTAG box and offers debugger-specific semantics. You can use it, for example, to do the following:
终端3 telnet到JTAG盒并提供调试器特定的语义。 例如,您可以使用它来执行以下操作:
• Pull a JTAG definition script over TFTP from the host and execute it during JTAG boot. A JTAG definition script usually initializes the processor, clock registers, chip select registers, and memory banks. After this is done, the JTAG hardware is ready to download code onto the target and execute it. The JTAG manufacturer usually provides definition files for all supported platforms, so you are likely to have a close starting point for your board. 从主机上通过TFTP获得JTAG定义脚本,并在JTAG引导期间执行它。 JTAG定义脚本通常初始化处理器,时钟寄存器,芯片选择寄存器和存储体。完成此操作后,JTAG硬件就可以将代码下载到目标机器并执行它。JTAG制造商通常为所有支持的平台提供定义文件,因此您可能会为您的电路板提供一个紧密的起点。
• Download your bootloader, kernel, or stand-alone code from the host over TFTP, to flash memory, or RAM on the target. File formats such as ELF and binary are usually supported by JTAG debuggers. 通过TFTP从主机下载引导加载程序,内核或独立代码,到目标机器上的闪存或RAM。JTAG调试器通常支持ELF和二进制等文件格式。
• Single-step code, set breakpoints, examine registers, and dump memory regions. 单步执行代码,设置断点,检查寄存器和转储内存区域。
• Reset the target. 重置目标机器。
JTAG debugging can be flaky at times, so if you are debugging remotely, it might be a good idea to power the target via a remote power control switch, as shown in Figure 1.2. That way, you can hard-reset the target from the host using a web browser, as shown in Terminal 4. You can also choose to power the JTAG hardware via a remote power switch. That enables you to test run a bootloader directly from flash without the intervention of JTAG and its definition files.
JTAG调试有时可能不稳定,因此如果您进行远程调试,最好通过远程电源控制开关为目标机器供电,如图1.2所示。这样,您可以使用Web浏览器从主机硬重置目标机器,如终端4所示。您还可以选择通过远程电源开关为JTAG硬件供电。这使您可以直接从闪存测试运行引导加载程序,而无需JTAG及其定义文件的干预。
If the target board possesses a network interface, it can mount its root filesystem over NFS from the development host. Terminal 5 on the host operates locally on the exported root filesystem.[4]
[4] You might have more such terminals depending on your debug scenario. If you use an oscilloscope that has remote display capabilities, for example, you can operate it via a web browser on another terminal.
如果目标板拥有网络接口,它可以从开发主机通过NFS挂载其root文件系统。主机上的终端5在导出的root文件系统上本地运行。[4]
If your team is scattered geographically, run Terminals 1 through 5 within an environment such as Virtual Network Computing (VNC). If VNC is not already part of your distribution, download it from www.realvnc.com. With such a setup, you can debug the electrons on your remote board from the comfort of your home! Some JTAG vendors provide a sophisticated integrated development environment[5] that encompasses all the functionalities previously detailed, so you don’t need to manage VNC terminal sessions if you’re using one of those.
如果您的团队在地理位置上分散,请在虚拟网络计算(VNC)等环境中运行终端1到5。 如果VNC尚未成为您的发行版的一部分,请从www.realvnc.com下载安装。通过这样的设置,您可以在舒适的家中远程调试电路板!一些JTAG供应商提供了一个复杂的集成开发环境[5],它包含了之前详细介绍的所有功能,因此如果您使用其中一个,则无需管理VNC终端会话。
[5] Although JTAG hardware is independent of the target operating system, the front-end interface is likely to have OS dependencies.
During hardware bring up, when you are porting your bootloader or other stand-alone code to the target, it’s a good idea to first generate an ELF image and debug it from RAM before running it from flash. Remember, however, to eliminate bootloader initializations that duplicate the ones performed by the JTAG definition script.
在硬件启动期间,当您移植bootloader或其他独立代码到目标机器时,最好首先生成ELF映像并从RAM调试它,在移植成功后,再从闪存运行它。但请记住,要消除重复执行JTAG定义脚本带来的bootloader多次初始化的影响。
A key advantage of JTAG debuggers is that you can use a single tool to debug the different pieces that constitute your firmware solution. So, you can use the same debugger to debug the BIOS, bootloader, base kernel, device driver modules, and user-space applications, at source level.
JTAG调试器的一个关键优势是您可以使用单个工具来调试固件(Firmware)的不同部分。 因此,您可以使用相同的调试器在源代码级别调试BIOS,bootloader,基本内核,设备驱动程序模块和用户空间应用程序。
Downloads
You can download kdb patches for the x86 and IA64 architectures from http://oss.sgi.com/projects/kdb. Each supported kernel version needs two patches: a common one and an architecture-dependent one.
您可以从http://oss.sgi.com/projects/kdb下载x86和IA64体系结构的kdb补丁。每个被支持的内核版本都需要两个补丁:一个是普通的,另一个是与体系结构相关的。
The home page for the kgdb project is http://kgdb.sourceforge.net. The website also has documentation on configuring and using kgdb.
kgdb项目的主页是http://kgdb.sourceforge.net。该网站还提供配置和使用kgdb的文档。
If your Linux distribution does not already contain gdb, you can obtain it from www.gnu.org/software/gdb/gdb.html.
如果您的Linux发行版尚未包含gdb,则可以从www.gnu.org/software/gdb/gdb.html获取。


