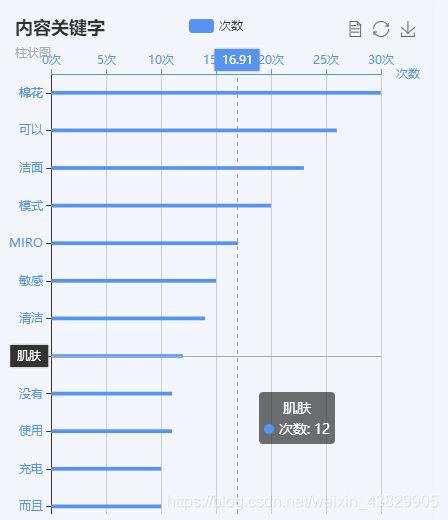
vue cli 使用echart组件
vue cli 使用echart组件
- 柱状图
- 词云图
柱状图
在package.json添加echarts,保存后运行npm install 或者其他方法添加
  "dependencies": {
    "echarts": "^4.2.1",   //添加echarts
  },
在main.js配置
import echarts from 'echarts'
Vue.prototype.$echarts = echarts
在vue页面使用
       //声明一个id="myChart1"的div ,设宽高

data(){
return{
      xdatas1:[5, 20, 36, 10, 10, 20, 30, 21, 3, 6, 9, 56, 67, 2],
      ydatas1: [
        "更新天数",
        "粉丝量",
        "粉丝新增",
        "阅读数",
        "视频播放量",
        "推荐量",
        "当天收益",
        "微头条数量",
        "小视频发布数量"],
      max1: 100,
}
},
  mounted: function() {
  //一开始加载数据,或者是取后台返回来的数据
    this.drawLine( this.xdatas1,this.ydatas1,this.max1);
  },
methods:{
 //柱状图
    drawLine(xins1, yins1,max1) {
      // 基于准备好的dom,初始化echarts实例
      let myChart1 = this.$echarts.init(document.getElementById("myChart1"));
      // 绘制图表
      var colors = ["#5793f3"];

      myChart1.setOption({
        title: {
          text: "标题关键字",
          subtext: "柱状图"
        },
        color: colors,
        tooltip: {
          trigger: "axis",
          axisPointer: {
            type: "cross"
          }
        },
        grid: {
          width: "80%"
        },
        toolbox: {
          feature: {
            dataView: { show: true, readOnly: false },
            restore: { show: true },
            saveAsImage: { show: true }
          }
        },
        legend: {
          data: ["次数"]
        },
        xAxis: [
          {
            type: "value",
            name: "次数",
            min: 0,
            max: max1,
            position: "top",
            axisLine: {
              lineStyle: {
                color: colors[0]
              }
            },
            axisLabel: {
              formatter: "{value}次"
            }
          }
        ],
        yAxis: [
          {
            type: "category",
            axisLabel: {
              interval: 0,
              textStyle: {
                color: "#5793f3"
              }
            },
            axisTick: {
              alignWithLabel: true
            },
            data: yins1
          }
        ],
        series: [
          {
            name: "次数",
            type: "bar",
            barWidth: "20%",
            data: xins1
          }
        ]
      });
}
}
词云图
在package.json添加echarts-wordcloud,必须先添加echarts,保存后运行npm install 或者其他方法添加
  "dependencies": {
    "echarts": "^4.2.1",   //添加echarts
     "echarts-wordcloud": "^1.1.3",
  },
在main.js配置
import echarts from 'echarts'
Vue.prototype.$echarts = echarts
// 引入echarts字符云
import 'echarts-wordcloud/dist/echarts-wordcloud'
import 'echarts-wordcloud/dist/echarts-wordcloud.min'
在vue页面使用
       //声明一个id="worldChart1"的div ,设宽高

data(){
return{
worldData1:[],
}
},
  mounted: function() {
 this.worldData1=[
        {
          name: "Sam S Club",
          value: 10000,
          textStyle: {            //这里必须用textStyle,词云图才有多颜色,echarts升级版本后词云图不支持了
            normal: {
              color: "black"
            }
          }
        },
        {
          name: "Macys",
          value: 6181,
          textStyle: this.createRandomItemStyle()
        },
        {
          name: "Amy Schumer",
          value: 4386,
          textStyle: this.createRandomItemStyle()
        },
        {
          name: "Jurassic World",
          value: 4055,
          textStyle: this.createRandomItemStyle()
        },
        {
          name: "Charter Communications",
          value: 2467,
          textStyle: this.createRandomItemStyle()
        },
        {
          name: "Chick Fil A",
          value: 2244,
          textStyle: this.createRandomItemStyle()
        },
        {
          name: "Planet Fitness",
          value: 1898,
          textStyle: this.createRandomItemStyle()
        },
        {
          name: "Pitch Perfect",
          value: 1484,
          textStyle: this.createRandomItemStyle()
        },
        {
          name: "Express",
          value: 1112,
          textStyle: this.createRandomItemStyle()
        },
        {
          name: "Home",
          value: 965,
          textStyle: this.createRandomItemStyle()
        },
        {
          name: "Johnny Depp",
          value: 847,
          textStyle: this.createRandomItemStyle()
        },
        {
          name: "Lena Dunham",
          value: 582,
          textStyle: this.createRandomItemStyle()
        },
        {
          name: "Lewis Hamilton",
          value: 555,
          textStyle: this.createRandomItemStyle()
        }]
  //一开始加载数据,或者是取后台返回来的数据
    this.drawWorld(this.worldData1);
  },
methods:{
    createRandomItemStyle() {      //随机颜色函数
      return {
        normal: {
          color:
            "rgb(" +
            [
              Math.round(Math.random() * 160),
              Math.round(Math.random() * 160),
              Math.round(Math.random() * 160)
            ].join(",") +
            ")"
        }
      };
    },
    drawWorld(worldData1) {
      // 基于准备好的dom,初始化echarts实例
      let worldChart1 = this.$echarts.init(
        document.getElementById("worldChart1")
      );

      worldChart1.setOption({
        title: {
          text: "标题词符云"
          // link: "http://www.google.com/trends/hottrends"
        },
        tooltip: {
          show: true
        },
        series: [
          {
            name: "标题词符云",
            type: "wordCloud",
            size: ["80%", "80%"],
            textRotation: [0, 45, 90, -45],
            textPadding: 0,
            autoSize: {
              enable: true,
              minSize: 14
            },
            data: worldData1
          }
        ]
      });
      }
}

