echarts图表 柱状图、饼图、折线面积图、雷达图,地图样式设置及调整
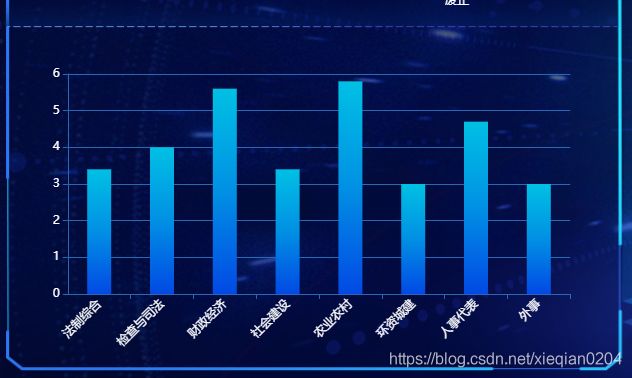
1.柱状图柱子、x轴、y轴、网格线颜色设置 ,包括渐变色
var option = {
            tooltip : {
                trigger: 'axis'
            },
            calculable : true,
            xAxis : [
                {
                    type : 'category',
                    data: ["法制综合","检查与司法","财政经济","社会建设","农业农村","环资城建","人事代表","外事"],
                    axisLabel: {
                        color: "#fff",    //x轴文字的颜色
                        interval: 'auto',
                        rotate:45,            //旋转角度
                        fontWeight: 'normal'
                    },
                    axisLine: {
                        lineStyle: {
                            color: '#2868b4',    //x轴线的颜色
                            width: 1,//这里是为了突出显示加上的  //x轴线的宽度
                        }
                    }
                }
            ],
            yAxis : [
                {
                    type : 'value',
                    axisLabel: {
                        color: "#fff",
                        interval: 'auto',
                        fontWeight: 'normal'
                    },
                    splitLine: {
                        show: true,
                        lineStyle:{
                            color: ['#2868b4'],   //平行于x轴网格线颜色设置
                            width: 1,         //平行于x轴网格线宽度设置
                            type: 'solid'
                        }
                    },
                    axisLine: {
                        lineStyle: {
                            color: '#2868b4',    //y轴线的颜色
                            width: 1,//这里是为了突出显示加上的   //y轴线的宽度
                        }
                    }
                }
            ],
            series : [
                {
                    name:'上位法依据',
                    type:'bar',
                    data:data[i],
                    itemStyle: {
                        normal: {//柱状图柱子的颜色设置-----颜色渐变
                            color: new echarts.graphic.LinearGradient(
                                0, 0, 0, 1,
                                [
                                    {offset: 0, color: '#00c0e4'},
                                    {offset: 0.5, color: '#0190e4'},
                                    {offset: 1, color: '#0249e4'}
                                ]
                            )
                        }
                    },
                    barWidth: 24
                }
            ]
        };
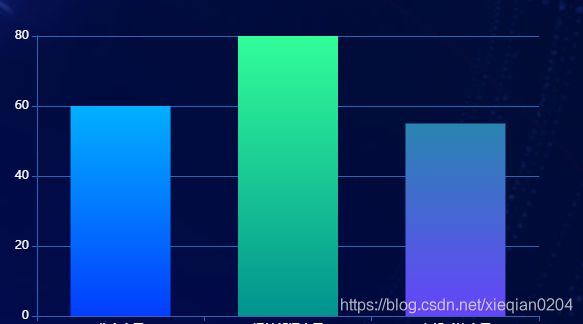
柱状图不同的柱子设置不同的渐变色
series : [
                {
                    name:'正在进行',
                    type:'bar',
                    stack: '状态',
                    data: data[i],
                    itemStyle: {
                        normal: {
                            //每个柱子的颜色即为colorList数组里的每一项,如果柱子数目多于colorList的长度,则柱子颜色循环使用该数组
                            color: function (params) {
                                var colorList = [
                                    ['#01b0ff', '#033dff'],
                                    ['#32fe99', '#01938f'],
                                    ['#2985b1', '#6644fb'],
                                ];
                                var index = params.dataIndex;
                                if (params.dataIndex >= colorList.length) {
                                    index = params.dataIndex - colorList.length;
                                }
                                return new echarts.graphic.LinearGradient(0, 0, 0, 1,
                                    [{
                                        offset: 0,
                                        color: colorList[index][0]
                                    },
                                        {
                                            offset: 1,
                                            color: colorList[index][1]
                                        }
                                    ]);
                            }
                        }
                    },
                    barWidth: 100
                }
            ]
2. 饼图颜色的设置、每个模块设置不同颜色以及渐变色
 myChartcir.setOption({
            title: {
                text: ''
            },
            legend: {
                bottom: 10,
                left: 'center',
                data: ['调研', '储备', '正式'],
                textStyle:{//图例文字的样式
                    color:'#fff'
                }
            },
            avoidLabelOverlap: false,
            series : [
                {
                    name: '访问来源',
                    type: 'pie',
                    radius: ['30%','70%'],      //饼图大小和空心范围设置
                    data:[
                        {
                            value:data[i][0],
                            name:'调研',
                            itemStyle: {
                                normal: {//模块颜色设置----颜色渐变
                                    color: new echarts.graphic.LinearGradient(
                                        0, 0, 0, 1,
                                        [
                                            {offset: 0, color: '#00aee3'},
                                            {offset: 0.5, color: '#017edf'},
                                            {offset: 1, color: '#024bdb'}
                                        ]
                                    )
                                }
                            }
                        },
                        {
                            value:data[i][1],
                            name:'储备',
                            itemStyle: {
                                normal: {//颜色渐变
                                    color: new echarts.graphic.LinearGradient(
                                        0, 0, 0, 1,
                                        [
                                            {offset: 0, color: '#a262e9'},
                                            {offset: 1, color: '#7822d8'}
                                        ]
                                    )
                                }
                            }
                        },
                        {
                            value:data[i][2],
                            name:'正式',
                            itemStyle: {
                                normal: {//颜色渐变
                                    color: new echarts.graphic.LinearGradient(
                                        0, 0, 0, 1,
                                        [
                                            {offset: 0, color: '#fcbf05'},
                                            {offset: 0.5, color: '#f5980e'},
                                            {offset: 1, color: '#f07317'}
                                        ]
                                    )
                                }
                            }
                        }
                    ],
                    itemStyle :{
                        normal : {
                            label : {
                                show : true,
                                position : 'center',
                                formatter : '2020',   //空心位置文字设置
                                textStyle : {
                                    color : '#fff',
                                    fontSize : '24',
                                    fontFamily : '微软雅黑',
                                    fontWeight : 'bold'
                                }
                            },
                            labelLine : {
                                show : false
                            }
                        }
                    },
                }
            ]
        })
3. 雷达图网格线颜色设置、颜色渐变设置
option = {
            title: {
                text: ''
            },
            tooltip: {},
            radar: {
                name: {
                    textStyle: {
                        color: '#fff',
                        padding: [3, 5]
                    }
                },
                indicator: [
                    { name: '新制定', max: 600},
                    { name: '其他', max: 600},
                    { name: '', max: 600},
                    { name: '废止', max: 600},
                    { name: '', max: 600},
                    { name: '修改', max: 600}
                ],
                splitArea : {
                    show : true,
                    areaStyle : {
                        color: ["#01134a"]
                        // 图表背景网格的颜色
                    }
                },
                splitLine : {
                    show : true,
                    lineStyle : {
                        width : 1,
                        color : ['#0b3b89']
                        // 图表背景网格线的颜色
                    }
                },
            },
            series: [{
                name: '',
                type: 'radar',
                itemStyle: {
                    normal: {
                        areaStyle: {type: 'default'}
                    }
                },
                data : [
                    {
                        value : data[i],
                        name : '时效性统计',
                        itemStyle: {
                            normal: {//颜色渐变
                                color: new echarts.graphic.LinearGradient(
                                    0, 0, 0, 1,
                                    [
                                        {offset: 0, color: '#00c0e4'},
                                        {offset: 0.5, color: '#0190e4'},
                                        {offset: 1, color: '#0249e4'}
                                    ]
                                )
                            }
                        }
                    }
                ]
            }]
        };
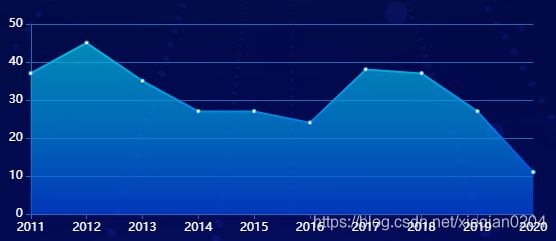
4. 折线面积图
series: [{
            data: [37, 45, 35, 27, 27, 24, 38, 37, 27, 11],
            type: 'line',
            areaStyle: {},
            itemStyle: {
                normal: {//颜色渐变
                    color: new echarts.graphic.LinearGradient(
                        0, 0, 0, 1,
                        [
                            {offset: 0, color: '#00c0e4'},
                            {offset: 0.5, color: '#0190e4'},
                            {offset: 1, color: '#0249e4'}
                        ]
                    )
                }
            },
        }]
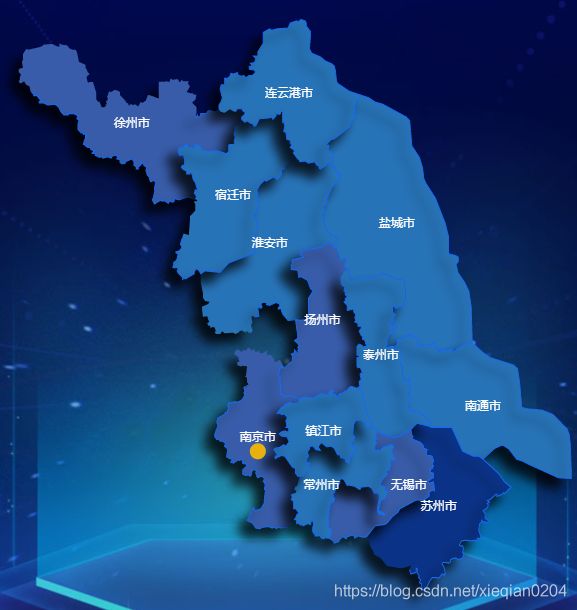
5. 地图样式设置,可以根据值设置
function mapEchart(data,i) {
        //用来给南京设置一个标记,下面的这个markPoint用来设置标注的样式
        var markPointData = [{
            "name": "南京",
            "coord": [
                118.8062,31.8208     //经纬度
            ],
            "runConut": '537',
            "num": '234'
        }
        ];
        //取得json的样式,读取json文件
        $.getJSON("script/echarts/json/jiangsu.json", "", function(datas) {
            //生成地图
            createMap(datas);
        })
        //生成地图
        function createMap(datas){
            echarts.registerMap('jiangsu',datas);
            var chart = echarts.init(document.getElementById('jiangsuMaps'));
            chart.setOption({
                dataRange: {
                    min: 0,//颜色区间的最小值
                    max: 1000,//颜色区间的最大值,和data中的最大值一致
                    x: '-500',
                    y: '-500',
                    text:['高','低'], // 文本,默认为数值文本
                    textStyle : {
                        color : '#fff'
                    },
                    splitList : [
                        {start : 0, end : 0, color : '#2773b7'},
                        {start : 1, end : 2, color : '#385ca9'},
                        {start : 3, end : 4, color : '#154ea1'},
                        {start : 5, end : 6, color : '#0a3286'}

                    ],
                    calculable : false,
                },
                tooltip: {
                    trigger: 'item',
                    formatter: '{b}:{c}(个)'
                },
                visualMap: {
                    show: false
                },
                series:[
                    {
                        name: '江苏各市',
                        type: 'map',//type必须声明为 map 说明该图标为echarts 中map类型
                        map: 'jiangsu', //这里需要特别注意。如果是中国地图,map值为china,如果为各省市则为中文。这里用北京
                        aspectScale: 0.75, //长宽比. default: 0.75
                        zoom: 1.1,
                        itemStyle:{
                            normal:{
                                label:{
                                    show:true
                                },
                                areaStyle:{
                                    color:'white'
                                },
                                borderColor:'#176aee',  //地图边界线颜色
                                borderWidth:1,  //边界线宽度
                                borderType: 'dashed',
                                shadowColor: 'rgba(0,0,0,0.8)',    //地图设置阴影 看起来立体一点
                                shadowBlur: 10,
                                shadowOffsetX: -10,
                                shadowOffsetY: 10
                            },
                            emphasis: {
                                label:{
                                    show:false
                                },
                                borderWidth: 0,
                                borderColor: '#0066ba',
                                areaColor: "#48D1CC",
                                shadowColor: 'rgba(0, 0, 0, 0.5)'
                            }
                        },
                        label: {
                            normal: {
                                textStyle: {
                                    fontSize: 12,
                                    color: 'white'
                                }
                            }
                        },
                        markPoint: { //图表标注。
                            // symbol: 'path://M512 39.384615l169.353846 295.384615 342.646154 63.015385-240.246154 248.123077L827.076923 984.615385l-315.076923-145.723077L196.923077 984.615385l43.323077-334.769231L0 401.723077l342.646154-63.015385L512 39.384615',//星星
                            symbol:'circle', //圆点   为空  默认为定位的图标
                            symbolSize: 16,//图形大小
                            hoverAnimation: true,
                            label: {
                                normal: {
                                    "show": true,
                                },
                                emphasis: {
                                    show: true,
                                }
                            },
                            itemStyle: {
                                normal: {
                                    color: '#e8b110'
                                }
                            },
                            data: markPointData
                        },
                        data: [
                            {name:'盐城市', value: data[i][0]},
                            {name:'徐州市', value: data[i][1]},
                            {name:'南通市', value: data[i][2]},
                            {name:'淮安市', value: data[i][3]},
                            {name:'苏州市', value: data[i][4]},
                            {name:'宿迁市', value: data[i][5]},
                            {name:'连云港市', value: data[i][6]},
                            {name:'扬州市', value: data[i][7]},
                            {name:'南京市', value: data[i][8]},
                            {name:'泰州市', value: data[i][9]},
                            {name:'无锡市', value: data[i][10]},
                            {name:'常州市', value: data[i][11]},
                            {name:'镇江市', value: data[i][12]}
                        ]
                    }
                ]

            });
        }
    }


