python3 用地面雨量计数据校正TRMM/3B43数据之模型建立
本文数据为处理后的TRMM累计年降水量数据和雨量计累计年降水量数据
# -*- coding: utf-8 -*-
"""
Created on Tue Nov 12 19:31:07 2019

@author: BAI Depei
"""

from osgeo import ogr
from osgeo import gdal
import numpy as np
import sympy as sp
import matplotlib.pyplot as plt
from scipy import polyfit,polyval,sqrt,stats

#------------------read the station_coordinates--------------------
fn = 'E:\课程PPT\Python空间数据处理\python空间数据处理-期中大作业02\梅川江地面数据\meichuan_prec_station.shp'
ds = ogr.Open(fn,False)
layer = ds.GetLayer(0)
spatialref = layer.GetSpatialRef()
lydefn = layer.GetLayerDefn()  #图层定义信息
geomtype = lydefn.GetGeomType()
fieldlist = []
for i in range(lydefn.GetFieldCount()):
    fddefn = lydefn.GetFieldDefn(i)
    fddict = {'name':fddefn.GetName(),'type':fddefn.GetType(),\
              'width':fddefn.GetWidth(),'decimal':fddefn.GetPrecision()}
    fieldlist += [fddict]
    #获取属性表每列列名及其属性:类型、宽度、精度
    geomlist,reclist = [],[]
    #geomlist存放所有图形的坐标点(字符串中包含),reclist存放所有的图形名
    feature = layer.GetNextFeature()
    #首次获取feature
    while feature is not None:
        geom = feature.GetGeometryRef()
        geomlist += [geom.ExportToWkt()]
        rec = {}
        for fd in fieldlist:
            rec[fd['name']] = feature.GetField(fd['name'])
        reclist += [rec]
        feature = layer.GetNextFeature()
ds.Destroy()
#关闭数据
#-------------------------将坐标写入列表中---------------------------------
pnt_coordinates = [[],[]]
for i in range(len(geomlist)):
    a = geomlist[i].split(' ')
    b = a[1].split('(')
    c = a[2].split(')')
    longitude = float(b[1])
    latitude = float(c[0])
    pnt_coordinates[0] += [longitude]
    pnt_coordinates[1] += [latitude]
#reclist则不必写入其他变量,因其调用简单

#-------------------------读取2010年TRMM降水遥感图像-----------------------
path = 'E:\\课程PPT\\Python空间数据处理\\python空间数据处理-期中大作业02\\卫星降雨数据TRMM3B43_分辨率0.25度\\'
#有时候路径必须双反斜杠
dataset = gdal.Open(path + '3B43_2010.TIF')
samples = dataset.RasterXSize
lines = dataset.RasterYSize
bands = dataset.RasterCount
img_geotrans = dataset.GetGeoTransform()
#Out[10]: (-180.0, 0.25, 0.0, 50.0, 0.0, -0.25)
img_proj = dataset.GetProjection()
#Out[12]: 'GEOGCS["WGS 84",DATUM["WGS_1984",SPHEROID["WGS 84"...]]]
#可以看到此遥感图像未进行投影定义,因此还不是投影坐标,只是地理坐标
#在求解这些实测站点位于图像中哪个行列位置时不用将其转为投影坐标
im_data = dataset.ReadAsArray(0,0,samples,lines)

del dataset
#-----------------------转换站点经纬度坐标到对应遥感图像上的行列号----------
im_loc = [[],[]]
#第一个列表放行号,存纬度换出来的值,后者为列号,存经度换出来的值
# variable += [value] 等同于 variable.append(value)
for i in range(len(pnt_coordinates[0])):
    sample = sp.Symbol('sample')
    line = sp.Symbol('line')
    #pnt_coordinates[0][i] = img_geotrans[0] + sample*img_geotrans[1] + line*img_geotrans[2]
    #pnt_coordinates[1][i] = img_geotrans[3] + sample*img_geotrans[4] + line*img_geotrans[5]
    a = -pnt_coordinates[0][i] + img_geotrans[0] + sample*img_geotrans[1] + line*img_geotrans[2]
    b = -pnt_coordinates[1][i] + img_geotrans[3] + sample*img_geotrans[4] + line*img_geotrans[5]
    answer = sp.solve([a,b],[sample,line])#解二元一次方程组
    #Out[15]: {x: 0, y: 1}
    line = int(np.floor(answer[line]))
    sample = int(np.floor(answer[sample]))
    im_loc[0] += [line]
    im_loc[1] += [sample]
#----------------------read 2010_TRMM_stationpnt_value-------------------------
data_TRMM_stationpnt = []
for i in range(len(im_loc[0])):
    data_TRMM_stationpnt += [im_data[im_loc[0][i],im_loc[1][i]]]
#----------------------read 2010_rain_gauge_value------------------------------
path2 = 'E:\\课程PPT\\Python空间数据处理\\python空间数据处理-期中大作业02\\梅川江地面数据\\'
file_handle = open(path2 + 'meichuan_precipitation_2007-2010.txt')
line_value = file_handle.readlines()
file_handle.close()

#data_TRMM_stationpnt是根据geomlist次序依次遍历获得的,
#而geomlist次序与reclist次序一致,因此用reclist中台站名和2010作为关键字去检索
data_rain_gauge = []
#站点数据
for i in range(1,len(line_value)):
    temp = line_value[i][:-2].split(',')
    #Out[3]: '200704,DongShao,184.200000\n'
    if temp[0] != '201001':
        i += 12
        continue
    else:
        data = []
        for j in range(12):
            temp  = line_value[i+j][:-2].split(',')
            data += [float(temp[2])]
    total_value = sum(data)
    data_rain_gauge +=  [total_value]
    i += 12
    continue
#---------------built model between TRMM and rain_gauge_pnt----------------
#use 2010's data to built the linear model
#data_TRMM_stationpnt: X
#data_rain_gauge: Y
#Y = ax + b
(a,b) = np.polyfit(data_TRMM_stationpnt,data_rain_gauge,1)
mean_TRMM = np.mean(data_TRMM_stationpnt)
mean_gauge = np.mean(data_rain_gauge)
TRMM1 = data_TRMM_stationpnt - mean_TRMM
gauge1 = data_rain_gauge - mean_gauge
gauge2 = sum((data_TRMM_stationpnt - mean_TRMM)**2)
TRMM_gauge = sum(TRMM1 * gauge1)
#回归参数的最小二乘估计
#beta1=xy/x2
#beta0=y_m-beta1*x_m
#输出线性回归方程
print('y=',b,'+',a,'* x')
#方差的无偏估计量
sigma2=sum((np.array(data_rain_gauge) - b - a*np.array(data_TRMM_stationpnt))**2)/61
#自由度为63-2=61,见概率论与数理统计(浙江大学版) P.250-251.
sigma=np.sqrt(sigma2) #标准差
t=a*np.sqrt(gauge2)/sigma #t值
print('t=',t) #已知临界值求p值
p=stats.t.sf(t,61)
#见概率论与数理统计P.214
print('p=',p)
R2 = a*a
square = (np.array(data_TRMM_stationpnt)-np.array(data_rain_gauge))**2
RMSE = np.sqrt(np.array(sum(square)/63))
regression_x = np.linspace(1200,2600,200)
regression_y = [b + a*i for i in regression_x]
#plt.axis([1200,2600,1200,2600])
#plt.axis('equal')
#-------------------------设置图形的长宽------------------------
fig = plt.gcf()
fig.set_size_inches(10,8)
#------------------------横纵坐标范围---------------------------
plt.xlim(xmax = 2600, xmin=1200)
plt.ylim(ymax = 2600, ymin=1200)
#-----------------------刻度值大小及字体------------------------
plt.tick_params(labelsize=20)
#[label.set_fontname('Times New Roman') for label in labels]
#-------------------------画拟合直线和散点及图例----------------------
plt.scatter(np.array(data_TRMM_stationpnt),np.array(data_rain_gauge),c = 'g',\
            marker = '8')
plt.plot(np.array(regression_x),np.array(regression_y),'r',linewidth = 3)
#label = 'y='+str(round(a,3))+'*x+'+str(round(b,3)),\
#-------------------------图名和横纵坐标名称及格式----------------
plt.xlabel('TRMM value',{'size':24,'family' : 'Times New Roman'})
plt.ylabel('rain gauge value',{'size':24,'family' : 'Times New Roman'})
#plt.text('N = 63')
#,'R2 = '+str(R2)
#,['p_value = '+str(p),'RMSE = '+str(RMSE)]
plt.legend(loc = 'upper left',frameon = False)
plt.savefig('linear_model.png',dpi=300,bbox_inches='tight')
#bbox_inches = 'tight'用来去除图形边界
plt.show()

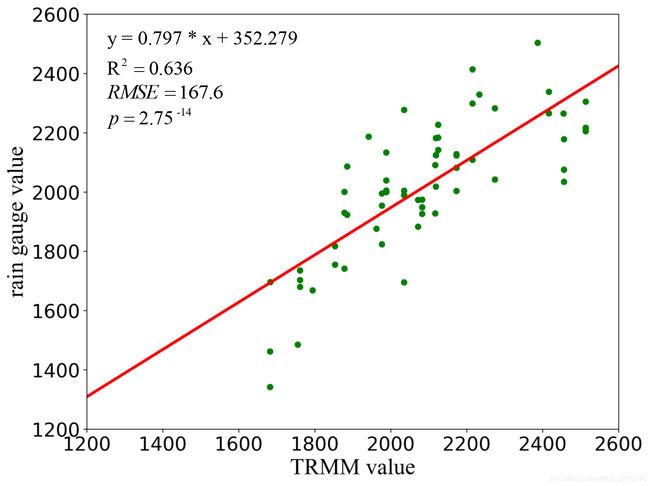
做进一步美化,得到:

关于如何在散点图上添加公式,使图片和公式合并,且不影响图像的分辨率,过程参考:
[1]小白是哪个小白_. 怎么把公式和图片合并起来?
版权归作者 小白是哪个小白_ 所有,转载、引用请注明链接出处。