Highcharts插件常见问题及解决办法
在jsp中使用Highchart的步骤:
第一步:引入highchart必需的js文件
|
1
2
3
4
5
6
7
8
9
10
11
12
|
|
开发过程遇到的问题:
1) Js的引入顺序错了,导致highchart的图表出不来,
Highchart插件中用到了jquery,当时jquery-1.8.3.js的引入顺序放到了highchart插件js的下面,
导致当加载highchart插件用到的js时,找不到jquery的js,报出某个js的函数不合法
因此 jquery的js要在引入highchart的js之前引入
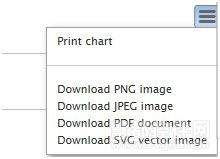
2) exporting.js 打印下载的js中,提示的都是英文,
要显示中文,这里采用的方法是修改exporting.js
p(s.lang,{printChart:"打印报表",downloadPNG:"下载为PNG格式图片",downloadJPEG:"下载为JPEG格式图片",
downloadPDF:"下载为PDF格式文档",downloadSVG:"下载为SVG格式矢量图片",contextButtonTitle:"打印 下载"});
修改后的效果:
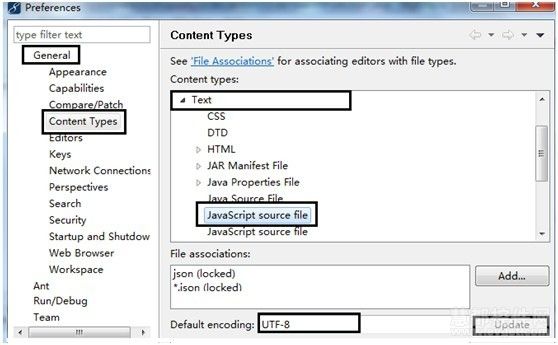
当修改了exporting.js后,当保存时,没法保存js,提示编码问题
解决方法是:
window>>preferences>>general>>content types
在右边的窗口中打开列表,选中"JavaScript",在下面的"default encoding"右边的输入框中输入"utf-8",再点"update"按钮
单击打印下载时,显示的下拉框在大部分的ie浏览器中显示的很难看,火狐下正常
原因: 上面的下拉框显示很长,是由于hr标签的原因,导致hr的宽度按照 100%进行了显示
解决方法:
在显示highchart图标的jsp页面中,添加hr的样式
第二步:组装添加显示highchart图表所用的数据
|
1
2
3
4
5
6
7
8
9
10
11
12
13
14
15
16
17
18
19
20
21
22
23
24
25
26
27
28
29
30
31
32
33
34
35
36
37
38
39
40
41
42
43
44
45
46
47
48
49
50
51
52
53
54
55
56
57
58
59
60
61
62
63
64
65
66
67
68
69
70
71
72
73
74
75
76
77
78
79
80
81
82
83
84
|
显示highchart图标的js代码
$(
function
() {
//填充数据使用,使用jquery来获取隐藏域的值
var
xAxisTimeInfo = $(
"#xAxisTime"
).val();
var
totalRecordInfo = $(
"#totalRecord"
).val();
var
totalRecordHYInfo = $(
"#totalRecordHY"
).val();
var
totalRecordLJInfo = $(
"#totalRecordLJ"
).val();
$(
'#container'
).highcharts({
chart: {
type:
'spline'
},
title: {
text:
'每月订单数量统计'
},
subtitle: {
text:
''
},
exporting:{
filename:
"订单统计"
,
//下载显示的文件名称
sourceWidth: 1000,
//下载图片的宽度
sourceHeight: 550,
//下载图片的高度
//指定下载图片的url,这里使用的本地的java代码,没有使用官网的代码(那//样会受到highchart官网的网络限制,这里的java代码是结合的struts1来//实现的,在java代码解决了导出图片中中文乱码的问题以及下载文件名乱码//的问题,详见java代码中说明) url:'<%=basePath%>shop/newOrder/orderPre/exportImage.do'//这里是一个重点哦,也可以修改exporting.js中对应的url
},
/**
* 去掉图标的右下角HightCharts.com 的图标
*/
credits: {
enabled :
false
,
//设置false就不会显示右下角的官网链接
//右下角连接的显示位置
position:{ align:
'right'
,x: -8, verticalAlign:
'bottom'
,y: -390 },
//右下角链接的地址href:'<%=basePath%>shop/newOrder/orderPre/orderSearch4HighCharts.do?type=1',
text:
'区域图表'
,
//右下角连接的名字
style : {cursor:
'pointer'
,color:
'#909090'
,fontSize:
'20px'
}
},
xAxis: {
categories: eval(xAxisTimeInfo)
},
yAxis: {
min: 0,
title: {
text:
'单位 (个)'
}
},
//鼠标旁边的提示框的样式
//1. point.y:.0f 提示框中显示的y轴单位的小数点位数
//2. style="width:160px;height:50px" 提示框的宽高
//3. point.key 坐标的x轴的值
tooltip: {
headerFormat:
'{point.key}'
,
pointFormat:
''
+
''
,
footerFormat:
'
,
shared:
true
,
useHTML:
true
},
plotOptions: {
column: {
pointPadding: 0.2,
borderWidth: 0
}
},
//图例的显示名称和数据
//这里使用了eval函数处理一下,使用jquery获取到的隐藏域的值
//否则不会显示
series: [{
name:
'裸机数量'
,
data: eval(totalRecordLJInfo)
}, {
name:
'订单总量'
,
data: eval(totalRecordInfo)
}, {
name:
'合约机数量'
,
data: eval(totalRecordHYInfo)
}]
});
});
|
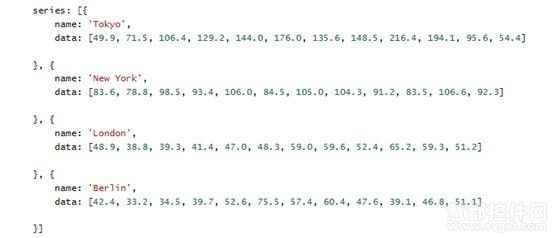
基本的highchart显示的数据格式是:
X轴数据信息
图例和显示数据的格式:
因此我们要做的就是根据需求,在java后台组装好上面的数据,填充到highchart的js代码中即可
导出的Java后台代码 (使用的是struts1)没有在struts的配置文件中配置,直接是在jsp中url请求
struts1版的结合highchart导出图片的java代码
使用highchart调用本地的java类导出图片时,用到的jar包
batik-all-1.6.jar fop.jar xerces-2.9.0.jar
|
1
2
3
4
5
6
7
8
9
10
11
12
13
14
15
16
17
18
19
20
21
22
23
24
25
26
27
28
29
30
31
32
33
34
35
36
37
38
39
40
41
42
43
44
45
46
47
48
49
50
51
52
53
54
55
56
57
58
59
60
61
62
63
64
65
66
67
|
/**
* 配合highchart插件导出图片
* @param mapping
* @param form
* @param request
* @param response
* @return
* @throws Exception
*/
public ActionForward exportImage (ActionMapping mapping, ActionForm form,
HttpServletRequest request, HttpServletResponse response)
throws Exception {
log.info(
"图片导出................"
);
request.setCharacterEncoding(
"gb2312"
);
//设置编码,解决乱码问题
String type = request.getParameter(
"type"
);
String svg = request.getParameter(
"svg"
);
response.setCharacterEncoding(
"gb2312"
);
//设置编码,解决乱码问题
String filename = request.getParameter(
"filename"
);
filename = filename==
null
?
"chart"
:filename;
ServletOutputStream out = response.getOutputStream();
log.info(
"type :"
+type+
" filename:"
+filename);
if
(
null
!= type &&
null
!= svg) {
svg = svg.replaceAll(
":rect"
,
"rect"
);
String ext =
""
;
Transcoder t =
null
;
if
(type.equals(
"image/png"
)) {
ext =
"png"
;
t =
new
PNGTranscoder();
}
else
if
(type.equals(
"image/jpeg"
)) {
ext =
"jpg"
;
t =
new
JPEGTranscoder();
}
else
if
(type.equals(
"application/pdf"
)) {
ext =
"pdf"
;
t =(Transcoder)
new
PDFTranscoder();
}
else
if
(type.equals(
"image/svg+xml"
))
ext =
"svg"
;
//解决下载文件的文件名的乱码
response.addHeader(
"Content-Disposition"
,
"attachment; filename="
+
new
String (filename.getBytes(
"gb2312"
),
"iso-8859-1"
) +
"."
+ext);
response.addHeader(
"Content-Type"
, type);
if
(
null
!= t) {
TranscoderInput input =
new
TranscoderInput(
new
StringReader(svg));
TranscoderOutput output =
new
TranscoderOutput(out);
try
{
t.transcode(input, output);
}
catch
(TranscoderException e) {
out.print(
"Problem transcoding stream. See the web logs for more details."
);
e.printStackTrace();
}
}
else
if
(ext.equals(
"svg"
)) {
OutputStreamWriter writer =
new
OutputStreamWriter(out,
"UTF-8"
);
writer.append(svg);
writer.close();
}
else
out.print(
"Invalid type: "
+ type);
}
else
{
response.addHeader(
"Content-Type"
,
"text/html"
);
out.println(
"Usage:\n\tParameter [svg]: The DOM Element to be converted."
+
"\n\tParameter [type]: The destination MIME type for the elment to be transcoded."
);
}
out.flush();
out.close();
return
null
;
}
|
使用highchart生成报表信息的部分后台java代码
开发中遇到的问题
- 在开发中使用了webservice,在dao层的java代码中使用了Map,但是Map在webservice中并不支持,
- 解决方法就是,在dao层的java代码中把Map中的数据使用json-lib插件转换成了Json
- 然后在action层中再使用json-lib插件转换成Map
java代码片段
|
1
2
3
4
5
6
7
8
9
10
11
12
13
14
15
16
17
18
19
20
21
22
23
24
25
|
Dao层的代码片段,查询数据封装成map,然后把map数据放到List中,然后在把list放到map中,调用json-lib插件转换成json数据
List ltHY = findSQL(dto, sqlHY.toString(), list.toArray());
List adminSqlTotalHY =
new
ArrayList();
//使用的LinkedHashMap,放到map中的数据使用顺序的
Mapfor
(int i = 0; ltHY!=
null
&& i < ltHY.size(); i++) {
Object[] obj = (Object[]) ltHY.get(i);
totalRecordHYMap.put(obj[0]!=
null
?String.valueOf(obj[0]):
""
,obj[1]!=
null
? String.valueOf(obj[1]):
""
);
}
adminSqlTotalHY.add(totalRecordHYMap);
//保存到map中
Map recordInfo =
new
LinkedHashMap();
recordInfo.put(
"Record_total"
, adminSqlTotalList);
recordInfo.put(
"Record_LJ"
, adminSqlTotalLJ);
recordInfo.put(
"Record_HY"
, adminSqlTotalHY);
//把map数据转化为json数据
JSONObject jsonObjectFromMap =JSONObject.fromObject(recordInfo);
dto.setAddress(jsonObjectFromMap.toString());
|
|
1
2
3
4
5
6
7
8
9
10
11
12
13
14
15
16
17
18
19
20
21
22
23
24
25
26
27
28
29
30
31
32
33
34
35
|
action层代码
/**
* 1. 构造HighChart的x轴用到的每月时间数据信息 (月份不足两位的没有补0,直接放在request中)
* 2. 返回值map中月份不足2位的,进行了补0,该map在构造每月订单数量统计时使用
* @throws ParseException
*/
private Map extractHighChartXAxisInfo(HttpServletRequest request) throws ParseException {
SimpleDateFormat simpleDateFormat =
new
SimpleDateFormat(
"yyyy-MM-dd"
);
Calendar curr = Calendar.getInstance();
Calendar curr2 = curr;
Date beginPayDate = curr.getTime();
// 传进来的当前时间
curr2.add(Calendar.YEAR, -1);
curr2.add(Calendar.MONTH, 1);
Date endPayDate = curr2.getTime();
// 上一年的时间
GregorianCalendar[] ga=getDate(simpleDateFormat.format(endPayDate), simpleDateFormat.format(beginPayDate));
//循环数组
StringBuffer stringBuffer =
new
StringBuffer();
Map initMap =
new
LinkedHashMap();
stringBuffer.append(
"["
);
for
(GregorianCalendar e:ga)
{
stringBuffer.append(
"'"
+modifyTimeAnthor(e)+
"',"
);
initMap.put(modifyTime(e), 0);
}
//当ga数组中有数据时才删除末尾的 逗号
if
(stringBuffer.length()>1){
stringBuffer.deleteCharAt(stringBuffer.length()-1);
}
stringBuffer.append(
"]"
);
log.info(
"x轴用到的每月时间数据信息 (月份不足两位的没有补0) "
+stringBuffer.toString());
request.setAttribute(
"highChartXAxisInfo"
, stringBuffer.toString());
return
initMap;
}
|
|
1
2
3
4
5
6
7
8
9
10
11
12
13
14
15
16
17
18
19
20
21
22
23
24
25
26
27
28
29
30
31
32
33
34
35
36
37
38
39
40
41
42
43
44
45
46
47
48
49
50
51
52
53
54
55
56
57
58
59
60
61
|
/**
*
* @param startTime
* @param endTime
* @return 返回开始时间和结束时间之间的每一个月
* 如:2013.1 2013.2 2013.3 2013.4 2013.5 2013.6 2013.7
* @throws ParseException
*/
public static GregorianCalendar[] getDate(String startTime,String endTime) throws ParseException
{
Vector
new
Vector
SimpleDateFormat sdf=
new
SimpleDateFormat(
"yyyy-MM"
);
GregorianCalendar gc1=
new
GregorianCalendar(),gc2=
new
GregorianCalendar();
gc1.setTime(sdf.parse(startTime));
gc2.setTime(sdf.parse(endTime));
do
{
GregorianCalendar gc3=(GregorianCalendar)gc1.clone();
v.add(gc3);
gc1.add(Calendar.MONTH, 1);
}
while
(!gc1.after(gc2));
return
v.toArray(
new
GregorianCalendar[v.size()]);
}
//按格式获取时间,月份不足两位的补0
public static String modifyTime(GregorianCalendar e){
String curdate = e.get(Calendar.YEAR)+
""
;
if
((e.get(Calendar.MONTH)+1)<10){
curdate = curdate+
".0"
+(e.get(Calendar.MONTH)+1);
}
else
{
curdate = curdate+
"."
+(e.get(Calendar.MONTH)+1);
}
return
curdate;
}
//按格式获取时间,月份不足两位的没有补0
public static String modifyTimeAnthor(GregorianCalendar e){
String curdate = e.get(Calendar.YEAR)+
""
;
curdate = curdate+
"."
+(e.get(Calendar.MONTH)+1);
return
curdate;
}
/**
* 1. 传递查询时间段的日期信息
* 2. 要求查询当月以及向前倒推11个月(总共12的月)的数据
* 3. 如当前日期是 2014.01,则构造开始时间2013.02,结束时间2014.02,都是由于oracle的between and
* @param mulOrderDTO
*/
private void passDateInfo(TMulOrderCountDTO mulOrderDTO) {
//传递月份信息
SimpleDateFormat simpleDateFormat =
new
SimpleDateFormat(
"yyyy-MM"
);
Calendar curr = Calendar.getInstance();
//注意这里把curr变量的引用赋值给了curr2,当curr的值变化时,会影响到curr2的值
Calendar curr2 = curr;
curr.add(Calendar.MONTH, 1);
Date beginPayDate = curr.getTime();
// 传进来的当前时间
curr2.add(Calendar.YEAR, -1);
Date endPayDate = curr2.getTime();
// 上一年的时间
mulOrderDTO.setBeginPayDate(simpleDateFormat.format(endPayDate));
mulOrderDTO.setEndPayDate(simpleDateFormat.format(beginPayDate));
}
|
|
1
2
3
4
5
6
7
8
9
10
11
12
13
14
15
16
17
18
19
20
21
22
23
24
25
26
27
28
29
30
31
32
33
34
35
36
37
38
39
40
41
42
43
44
45
46
47
48
49
50
51
52
53
54
55
56
57
58
59
60
61
62
63
64
65
66
67
68
69
70
71
72
73
74
75
76
77
78
79
80
81
82
83
84
85
86
87
88
89
90
91
92
93
94
95
96
97
98
99
100
101
102
103
104
105
|
/**
* 构造每个月 订单总量、合约机总量、裸机总量的字符串信息,用于填充highChart插件
* @param request
* @param str
*/
@SuppressWarnings(
"unchecked"
)
private void extractHighChartRecordInfo(HttpServletRequest request,
String str,Map initMap) {
//接受最初传进来的map,使用了LinkedHashMap的构造方法,参数为map
//由于数据的显示问题,这里构造了初始化的LinkedHashMap(带顺序)
Map originalTotalMap =
new
LinkedHashMap(initMap);
|


