Android内存泄露专题——leakCanary源码分析
Android内存泄露专题——leakCanary源码分析
目录
Android内存泄露专题——leakCanary源码分析
一、内存泄露的检测机制
1、初始化
2、开启显示内存泄漏信息的页面
3、初始化一个ServiceHeapDumpListener,这是一个开启分析的接口实现类,类中定义了analyze方法,用于开启一个DisplayLeakService服务,从名字就可以看出,这是一个显示内存泄漏的辅助服务
4、初始化两个Watcher, RefWatcher和ActivityRefWatcher. 这两个Watcher的作用分别为分析内存泄漏与监听Activity生命周期
5、总结. 内存泄漏的检测机制
二、内存泄露的检测机制
1、RefWatch
2、总结下流程
三、内存泄漏轨迹生成
1、HeapAnalyzerService
2、HeapAnalyzer
通过上述分析,最终得出的结果为:
带着问题阅读源码:
1. 内存泄漏的检测机制
2. 内存泄漏的判定机制
3. 内存泄漏的轨迹生成机制
一、内存泄露的检测机制
什么时候检测内存发生了泄露?
1、初始化
public class ExampleApplication extends Application {

  @Override public void onCreate() {
    super.onCreate();
    // 判断当前的进程是否和服务进程在同一个进程,如果在则return
    if (LeakCanary.isInAnalyzerProcess(this)) {
      // This process is dedicated to LeakCanary for heap analysis.
      // You should not init your app in this process.
      return;
    }
    enabledStrictMode();
    LeakCanary.install(this);
  }
}
其中会判断当前进程和服务进程HeapAnalyzerService是否在同一个进程中,内存分析模块是在独立进程中执行的,这么设计是为了保证内存分析过程不会对App进程造成消极的影响,如使App进程变慢或导致out of Memory问题等;2、开启显示内存泄漏信息的页面
  public RefWatcher buildAndInstall() {
    RefWatcher refWatcher = build();
    if (refWatcher != DISABLED) {
      LeakCanary.enableDisplayLeakActivity(context);
      ActivityRefWatcher.installOnIcsPlus((Application) context, refWatcher);
    }
    return refWatcher;
  }
enableDisplayLeakActivity 开启显示内存泄漏信息的页面
3、初始化一个ServiceHeapDumpListener,这是一个开启分析的接口实现类,类中定义了analyze方法,用于开启一个DisplayLeakService服务,从名字就可以看出,这是一个显示内存泄漏的辅助服务
public static RefWatcher install(Application application) {
    return refWatcher(application).listenerServiceClass(DisplayLeakService.class)
        .excludedRefs(AndroidExcludedRefs.createAppDefaults().build())
        .buildAndInstall();
  }


  /**
   * Sets a custom {@link AbstractAnalysisResultService} to listen to analysis results. This
   * overrides any call to {@link #heapDumpListener(HeapDump.Listener)}.
   */
  public AndroidRefWatcherBuilder listenerServiceClass(
      Class listenerServiceClass) {
    return heapDumpListener(new ServiceHeapDumpListener(context, listenerServiceClass));
  }
看注释,这个服务的作用是分析HeapDump,写入一个记录文件,并弹出一个Notification

4、初始化两个Watcher, RefWatcher和ActivityRefWatcher. 这两个Watcher的作用分别为分析内存泄漏与监听Activity生命周期
  public static void installOnIcsPlus(Application application, RefWatcher refWatcher) {
    if (SDK_INT < ICE_CREAM_SANDWICH) {
      // If you need to support Android < ICS, override onDestroy() in your base activity.
      return;
    }
    ActivityRefWatcher activityRefWatcher = new ActivityRefWatcher(application, refWatcher);
    activityRefWatcher.watchActivities();
  }
ActivityRefWatcher监听Activity生命周期,在初始化时开始监听Activity生命周期(watchActivities)

watchActivities中注册了所有Activity的生命周期统一监听;onActiityDestroy会在onDestroy时执行,执行watch,检测内存泄漏
5、总结. 内存泄漏的检测机制
通过以上代码分析,我们可以得出第一个问题的答案。LeakCanary通过ApplicationContext统一注册监听的方式,来监察所有的Activity生命周期,并在Activity的onDestroy时,执行RefWatcher的watch方法,该方法的作用就是检测本页面内是否存在内存泄漏问题。
二、内存泄露的检测机制
如何判定发生内存泄露?
1、RefWatch
/**
 * Watches references that should become weakly reachable. When the {@link RefWatcher} detects that
 * a reference might not be weakly reachable when it should, it triggers the {@link HeapDumper}.
 *
 * This class is thread-safe: you can call {@link #watch(Object)} from any thread.
 */
public final class RefWatcher {
从上面图可以看出官方的解释。 RefWatcher是一个引用检测类,它会监听可能会出现泄漏(不可达)的对象引用,如果发现该引用可能是泄漏,那么会将它的信息收集起来(HeapDumper).
从RefWatcher源码来看,核心方法主要有两个: watch() 和 ensureGone()。如果我们想单独监听某块代码,如fragment或View等,我们需要手动去调用watch()来检测;因为上面讲过,默认的watch()仅执行于Activity的Destroy时。watch()是我们直接调用的方法,ensureGone()则是具体如何处理了,下面我们来看一下
**
   * Watches the provided references and checks if it can be GCed. This method is non blocking,
   * the check is done on the {@link WatchExecutor} this {@link RefWatcher} has been constructed
   * with.
   *
   * @param referenceName An logical identifier for the watched object.
   */
  public void watch(Object watchedReference, String referenceName) {
    if (this == DISABLED) {
      return;
    }
    checkNotNull(watchedReference, "watchedReference");
    checkNotNull(referenceName, "referenceName");
    final long watchStartNanoTime = System.nanoTime();
    String key = UUID.randomUUID().toString();
    retainedKeys.add(key);
    final KeyedWeakReference reference =
        new KeyedWeakReference(watchedReference, key, referenceName, queue);

    ensureGoneAsync(watchStartNanoTime, reference);
  }
上图为watch()的源码, 我们先来看一下官方的注释
监听提供的引用,检查该引用是否可以被回收。这个方法是非阻塞的,因为检测功能是在Executor中的异步线程执行的
从上述源码可以看出,watch里面只是执行了一定的准备工作,如判空(checkNotNull), 为每个引用生成一个唯一的key, 初始化KeyedWeakReference;关键代码还是在watchExecutor中异步执行。引用检测是在异步执行的,因此这个过程不会阻塞线程。
Retryable.Result ensureGone(final KeyedWeakReference reference, final long watchStartNanoTime) {
    long gcStartNanoTime = System.nanoTime();
    long watchDurationMs = NANOSECONDS.toMillis(gcStartNanoTime - watchStartNanoTime);

    removeWeaklyReachableReferences();

    if (debuggerControl.isDebuggerAttached()) {
      // The debugger can create false leaks.
      return RETRY;
    }
    if (gone(reference)) {
      return DONE;
    }
    gcTrigger.runGc();
    removeWeaklyReachableReferences();
    if (!gone(reference)) {
      long startDumpHeap = System.nanoTime();
      long gcDurationMs = NANOSECONDS.toMillis(startDumpHeap - gcStartNanoTime);

      File heapDumpFile = heapDumper.dumpHeap();
      if (heapDumpFile == RETRY_LATER) {
        // Could not dump the heap.
        return RETRY;
      }
      long heapDumpDurationMs = NANOSECONDS.toMillis(System.nanoTime() - startDumpHeap);
      heapdumpListener.analyze(
          new HeapDump(heapDumpFile, reference.key, reference.name, excludedRefs, watchDurationMs,
              gcDurationMs, heapDumpDurationMs));
    }
    return DONE;
  }
以上是检测的核心代码实现,从源码可以看出,检测的流程:
1) 移除不可达引用,如果当前引用不存在了,则不继续执行
2) 手动触发GC操作,gcTrigger中封装了gc操作的代码
3) 再次移除不可达引用,如果引用不存在了,则不继续执行
4) 如果两次判定都没有被回收,则开始分析这个引用,最终生成HeapDump信息
2、总结下流程
判定是否回收(KeyedWeakReference是否存在该引用), Y -> 退出, N -> 向下执行
手动触发GC
判定是否回收, Y -> 退出, N-> 向下执行
两次未被回收,则分析引用情况:
1) humpHeap : 这个方法是生成一个文件,来保存内存分析信息
2) analyze: 执行分析
KeyedWeakReference是回收队列,如果引用没有泄露,则可以被放置在KeyedWeakReference队列中
三、内存泄漏轨迹生成
如何将内存泄露的引用轨迹打印在日志中?
1、HeapAnalyzerService
调用了HeapAnalyzerService,在单独的进程中进行分析,如图
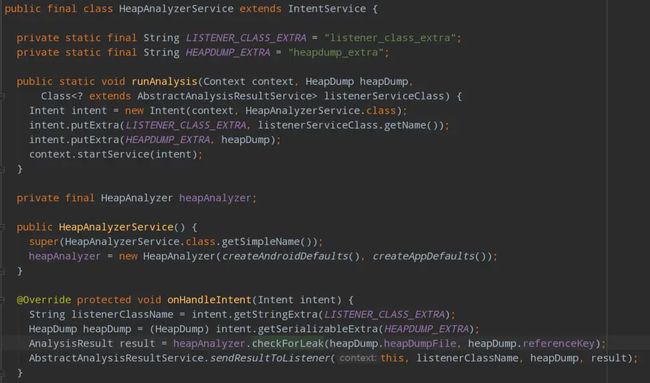
HeapAnalyzerService分析进程
HeapAnalyzerService中通过HeapAnalyzer来进行具体的分析,查看HeapAnalyzer源码,如图
2、HeapAnalyzer
/**
   * Searches the heap dump for a {@link KeyedWeakReference} instance with the corresponding key,
   * and then computes the shortest strong reference path from that instance to the GC roots.
   */
  public AnalysisResult checkForLeak(File heapDumpFile, String referenceKey) {
    long analysisStartNanoTime = System.nanoTime();

    if (!heapDumpFile.exists()) {
      Exception exception = new IllegalArgumentException("File does not exist: " + heapDumpFile);
      return failure(exception, since(analysisStartNanoTime));
    }

    try {
      HprofBuffer buffer = new MemoryMappedFileBuffer(heapDumpFile);
      HprofParser parser = new HprofParser(buffer);
      Snapshot snapshot = parser.parse();
      deduplicateGcRoots(snapshot);

      Instance leakingRef = findLeakingReference(referenceKey, snapshot);

      // False alarm, weak reference was cleared in between key check and heap dump.
      if (leakingRef == null) {
        return noLeak(since(analysisStartNanoTime));
      }

      return findLeakTrace(analysisStartNanoTime, snapshot, leakingRef);
    } catch (Throwable e) {
      return failure(e, since(analysisStartNanoTime));
    }
  }
上图可以看出,这个版本的LeakCanary采用了MAT对内存信息进行分析,并生成结果。其中在分析时,分为findLeakingReference与findLeakTrace来查找泄漏的引用与轨迹,根据GCRoot开始按树形结构依次建议当前引用的轨迹信息。
使用haha库中的hoprofPraser
通过上述分析,最终得出的结果为:
1. Activity检测机制是什么?
答: 通过application.registerActivityLifecycleCallbacks来绑定Activity生命周期的监听,从而监控所有Activity; 在Activity执行onDestroy时,开始检测当前页面是否存在内存泄漏,并分析结果。因此,如果想要在不同的地方都需要检测是否存在内存泄漏,需要手动添加。
2. 内存泄漏检测机制是什么?
答: KeyedWeakReference与ReferenceQueue联合使用,在弱引用关联的对象被回收后,会将引用添加到ReferenceQueue;清空后,可以根据是否继续含有该引用来判定是否被回收;判定回收, 手动GC, 再次判定回收,采用双重判定来确保当前引用是否被回收的状态正确性;如果两次都未回收,则确定为泄漏对象。
3. 内存泄漏轨迹的生成过程 ?
答: 该版本采用eclipse.Mat来分析泄漏详细,从GCRoot开始逐步生成引用轨迹。