Titanic : Machine Learning from Disaster
Titanic: Machine Learning from Disaster
RMS泰坦尼克号的沉没是历史上最臭名昭着的沉船之一。 1912年4月15日,泰坦尼亚号在首次航行中,与冰山相撞后沉没,在2224名乘客和船员中造成1502人死亡。 这场耸人听闻的悲剧震惊了国际社会,并为船舶制定了更好的安全规定。
造成这样的生命损失的原因之一是乘客和船员没有足够的救生艇。 虽然在沉船事件幸存有一些运气,但有些群体比其他人更有可能生存,如妇女,儿童和上层阶级。
在这个挑战中,我们要求完成对可能生存的人的分析。 特别是,我们要求你应用机器学习的工具来预测哪些乘客幸存下来的悲剧。
Practice Skills
Binary classification
Python basics
1. Introduction
该笔记是总结了组合基础学习模型的方法,特别是称为Stacking的集合的变体。 简而言之,堆叠基本分类器用作第一级预测,然后在第二级使用另一个模型对第一级的输出来进行预测。
'''
加载调用数据库
'''
%matplotlib inline
import pandas as pd
import numpy as np
import re
import sklearn
import xgboost as xgb
import seaborn as sns
import matplotlib.pyplot as plt

import plotly.offline as py
py.init_notebook_mode(connected=True)
import plotly.graph_objs as go
import plotly.tools as tls

import warnings
warnings.filterwarnings('ignore')

'''
#得到5个基本模型作为stacking进行预测
'''
from sklearn.ensemble import RandomForestClassifier, AdaBoostClassifier, GradientBoostingClassifier, ExtraTreesClassifier
from sklearn.svm import SVC
from sklearn.cross_validation import KFold;
2. Feature Exploration, Engineering and Cleaning
现在我们将进行一般的工作, 首先是分析手头的数据,进行特征工程以及数字编码任何分类特征。
'''
加载训练和测试数据集
'''
train = pd.read_csv('train.csv')
test = pd.read_csv('test.csv')

'''
存储乘客的ID号
'''
PassengerId = test['PassengerId']
train.head(3)
2.1 Feature Engineering
特征工程的目的是清除相近特征和分类标签属性,将所有的特征转化为数字形式,然后可以直接输入机器学习模型,接下来在开始训练模型之前,我们需要对特征相关性做可视化分析.
full_data = [train, test]

'''
(1)加入我们自己的特征
(2)给出名字的长度
'''
train['Name_length'] = train['Name'].apply(len)
test['Name_length'] = test['Name'].apply(len)

'''
特征表示乘客在Titanic是否有救生艇
'''
train['Has_Cabin'] = train["Cabin"].apply(lambda x: 0 if type(x) == float else 1)
test['Has_Cabin'] = test["Cabin"].apply(lambda x: 0 if type(x) == float else 1)

'''
创造新的家庭成员特征作为SibSp和Parch的组合
'''
for dataset in full_data:
    dataset['FamilySize'] = dataset['SibSp'] + dataset['Parch'] + 1

'''
从新的特征FamilySize,创造新特征(是否一个人)
'''
for dataset in full_data:
    dataset['IsAlone'] = 0
    dataset.loc[dataset['FamilySize'] == 1, 'IsAlone'] = 1

'''
消除登船地点缺失的数据,并用频率高的代替
'''
for dataset in full_data:
    dataset['Embarked'] = dataset['Embarked'].fillna('S')


'''
去除费用特征缺失数据,并且以他们中位数代替,创建新的特征(费用类别)
'''
for dataset in full_data:
    dataset['Fare'] = dataset['Fare'].fillna(train['Fare'].median())
train['CategoricalFare'] = pd.qcut(train['Fare'], 4)


'''
创建新的年龄分类特征
'''
for dataset in full_data:
    age_avg = dataset['Age'].mean()
    age_std = dataset['Age'].std()
    age_null_count = dataset['Age'].isnull().sum()
    age_null_random_list = np.random.randint(age_avg - age_std, age_avg + age_std, size=age_null_count)
    dataset['Age'][np.isnan(dataset['Age'])] = age_null_random_list
    dataset['Age'] = dataset['Age'].astype(int)
train['CategoricalAge'] = pd.cut(train['Age'], 5)

'''
定义消除乘客名字中的特殊字符
'''
def get_title(name):
    title_search = re.search(' ([A-Za-z]+)\.', name)
    # If the title exists, extract and return it.
    if title_search:
        return title_search.group(1)
    return ""

'''
创建新的名字特征,包含乘客名字主要信息
'''
for dataset in full_data:
    dataset['Title'] = dataset['Name'].apply(get_title)


'''
将所有非常见的标题分组成一个单独的“稀有”组
'''
for dataset in full_data:
    dataset['Title'] = dataset['Title'].replace(['Lady', 'Countess','Capt', 'Col','Don', 'Dr', 'Major', 'Rev', 'Sir', 'Jonkheer', 'Dona'], 'Rare')

    dataset['Title'] = dataset['Title'].replace('Mlle', 'Miss')
    dataset['Title'] = dataset['Title'].replace('Ms', 'Miss')
    dataset['Title'] = dataset['Title'].replace('Mme', 'Mrs')

for dataset in full_data:
    '''
    对性别进行绘制
    '''
    dataset['Sex'] = dataset['Sex'].map( {'female': 0, 'male': 1} ).astype(int)

    '''
    对Title进行绘制
    '''
    title_mapping = {"Mr": 1, "Miss": 2, "Mrs": 3, "Master": 4, "Rare": 5}
    dataset['Title'] = dataset['Title'].map(title_mapping)
    dataset['Title'] = dataset['Title'].fillna(0)

    '''
    对登船地点绘制
    '''
    dataset['Embarked'] = dataset['Embarked'].map( {'S': 0, 'C': 1, 'Q': 2} ).astype(int)

    '''
    对费用进行绘制
    '''
    dataset.loc[ dataset['Fare'] <= 7.91, 'Fare']   = 0
    dataset.loc[(dataset['Fare'] > 7.91) & (dataset['Fare'] <= 14.454), 'Fare'] = 1
    dataset.loc[(dataset['Fare'] > 14.454) & (dataset['Fare'] <= 31), 'Fare']   = 2
    dataset.loc[ dataset['Fare'] > 31, 'Fare']  = 3
    dataset['Fare'] = dataset['Fare'].astype(int)

    '''
    对年龄进行绘制
    '''
    dataset.loc[ dataset['Age'] <= 16, 'Age']  = 0
    dataset.loc[(dataset['Age'] > 16) & (dataset['Age'] <= 32), 'Age'] = 1
    dataset.loc[(dataset['Age'] > 32) & (dataset['Age'] <= 48), 'Age'] = 2
    dataset.loc[(dataset['Age'] > 48) & (dataset['Age'] <= 64), 'Age'] = 3
    dataset.loc[ dataset['Age'] > 64, 'Age'] = 4 ;
'''
除去特征属性标签
'''
drop_elements = ['PassengerId', 'Name', 'Ticket', 'Cabin', 'SibSp']
train = train.drop(drop_elements, axis = 1)
train = train.drop(['CategoricalAge', 'CategoricalFare'], axis = 1)
test = test.drop(drop_elements, axis = 1)2.2 Visualisations
'''
观察进行过特征清洗,筛选过的新特征数据
'''
train.head(3)
Pearson Correlation Heatmap(皮尔森相关热图)
'''
让我们生成一些特征的相关图,看看一个特征和另一个特征的相关程度。
为了做到这一点,我们将利用Seaborn绘图软件包,使我们能够非常方便地
绘制皮尔森相关热图,如下所示
'''
colormap = plt.cm.viridis
plt.figure(figsize=(14,12))
plt.title('Pearson Correlation of Features', y=1.05, size=15)
sns.heatmap(train.astype(float).corr(),linewidths=0.1,vmax=1.0, square=True, cmap=colormap, linecolor='white', annot=True)
皮尔逊相关图可以告诉我们没有太多的特征彼此强烈相关。 用这些特征训练模型是很好的,因为这意味着我们的训练集中没有太多冗余或多余的数据,我们确定每个特征都带有一些独特的信息。 这两个最相关的特征是家庭和父母(父母和孩子)的特征。 为了本次的练习,我仍然会留下这两个特征。
'''
最后,我们生成一些配对图来观察一个特征和另一个特征的数据分布,
我们再次用Seaborn。
'''
g = sns.pairplot(train[[u'Survived', u'Pclass', u'Sex', u'Age', u'Parch', u'Fare', u'Embarked',
       u'FamilySize', u'Title']], hue='Survived', palette = 'seismic',size=1.2,
       diag_kind = 'kde',diag_kws=dict(shade=True),plot_kws=dict(s=10) )
g.set(xticklabels=[])
3. Ensembling & Stacking models
在特征工程的分析后,我们终于找到了解决问题的核心。
然后创建集合和堆叠模型!
Helpers via Python Classes
(1)在这里,我们调用Python的类来帮助我们更方便。 对于任何编程新手,通常会听到类与面向对象编程(OOP)一起使用。 总之,一个类有助于扩展一些用于创建对象的代码/程序以及实现该类特定的函数和方法。
(2)在下面的代码部分,我们基本上写了一个类SklearnHelper,它允许扩展所有Sklearn分类器的共同的内置方法(如训练,预测和拟合)。 因此,如果我们要调用五个不同的分类器,那么这将减少冗余,因为不需要多次编写相同的代码。
'''
这些有用的参数稍后会派上用场的
'''
ntrain = train.shape[0]
ntest = test.shape[0]
SEED = 0          # for reproducibility
NFOLDS = 5    # set folds for out-of-fold prediction
kf = KFold(ntrain, n_folds= NFOLDS, random_state=SEED)

'''
定义一个类扩展Sklearn分类器
'''
class SklearnHelper(object):
    def __init__(self, clf, seed=0, params=None):
        params['random_state'] = seed
        self.clf = clf(**params)

    def train(self, x_train, y_train):
        self.clf.fit(x_train, y_train)

    def predict(self, x):
        return self.clf.predict(x)

    def fit(self,x,y):
        return self.clf.fit(x,y)

    def feature_importances(self,x,y):
        print(self.clf.fit(x,y).feature_importances_)
对于以前没有在Python中创建过类或者对象的学习者来说,让我解释一下上面给出的代码。在创建我的基类分类器时,我将只使用已经存在于Sklearn库中的模型,因此只能扩展类。
def init :用于调用类的默认构造函数的Python标准。 这意味着当你想创建一个对象(分类器)时,你必须给出它的参数clf(你想要的sklearn分类器),种子(随机种子)和参数(分类器的参数)。
代码的其余部分是类的简单方法,它简单地调用sklearn分类器中已经存在的相应方法。 本质上,我们创建了一个包装类来扩展各种Sklearn分类器,这样可以帮助我们在实现到我们的堆栈器时,减少一遍又一遍地编写相同的代码。
Out-of-Fold Predictions
现在如前面介绍部分所述,堆叠使用基础分类器的预测作为训练到二级模型的输入。 然而,不能简单地对完整的训练数据进行基本模型的训练,在完整的测试集上产生预测,然后输出这些用于二级训练。 这可能会导致你的基本模型预测已经具有“看到”测试集的风险,并因此在馈送这些预测时过度拟合。
def get_oof(clf, x_train, y_train, x_test):
    oof_train = np.zeros((ntrain,))
    oof_test = np.zeros((ntest,))
    oof_test_skf = np.empty((NFOLDS, ntest))

    for i, (train_index, test_index) in enumerate(kf):
        x_tr = x_train[train_index]
        y_tr = y_train[train_index]
        x_te = x_train[test_index]

        clf.train(x_tr, y_tr)

        oof_train[test_index] = clf.predict(x_te)
        oof_test_skf[i, :] = clf.predict(x_test)

    oof_test[:] = oof_test_skf.mean(axis=0)
    return oof_train.reshape(-1, 1), oof_test.reshape(-1, 1)
4. Generating our Base First-Level Models
所以现在我们将五个学习模型作为我们的一级分类。 这些模型都可以通过Sklearn库方便地调用,并列出如下:
1. Random Forest classifier
2. Extra Trees classifier
3. AdaBoost classifer
4. Gradient Boosting classifer
5. Support Vector Machine
Parameters
只是一个快速总结我们将在这里列出的参数.
n_jobs : 用于训练过程的核心数量。 如果设置为-1,则使用所有内核.
n_estimators : 学习模型中的分类树数(默认设置为10)
max_depth : 树的最大深度,或者应该扩展多少节点。 如果设置得太高,请注意,如果树太深,则会有过度拟合的风险
verbose : 控制是否要在学习过程中输出任何文本。 值0将禁止所有文本,而值3在每次迭代时输出树学习过程。
请通过Sklearn官方网站查看完整说明。 在那里你会发现有一大堆其他有用的参数,你可以随便玩。
# Put in our parameters for said classifiers
# Random Forest parameters
rf_params = {
    'n_jobs': -1,
    'n_estimators': 500,
     'warm_start': True,
     #'max_features': 0.2,
    'max_depth': 6,
    'min_samples_leaf': 2,
    'max_features' : 'sqrt',
    'verbose': 0
}

# Extra Trees Parameters
et_params = {
    'n_jobs': -1,
    'n_estimators':500,
    #'max_features': 0.5,
    'max_depth': 8,
    'min_samples_leaf': 2,
    'verbose': 0
}

# AdaBoost parameters
ada_params = {
    'n_estimators': 500,
    'learning_rate' : 0.75
}

# Gradient Boosting parameters
gb_params = {
    'n_estimators': 500,
     #'max_features': 0.2,
    'max_depth': 5,
    'min_samples_leaf': 2,
    'verbose': 0
}

# Support Vector Classifier parameters
svc_params = {
    'kernel' : 'linear',
    'C' : 0.025
    }
此外,由于在OOP框架中提到了Object和类,现在让我们通过我们前面定义的Helper Sklearn类创建5个表示我们5个学习模型的对象。
# Create 5 objects that represent our 4 models
rf = SklearnHelper(clf=RandomForestClassifier, seed=SEED, params=rf_params)
et = SklearnHelper(clf=ExtraTreesClassifier, seed=SEED, params=et_params)
ada = SklearnHelper(clf=AdaBoostClassifier, seed=SEED, params=ada_params)
gb = SklearnHelper(clf=GradientBoostingClassifier, seed=SEED, params=gb_params)
svc = SklearnHelper(clf=SVC, seed=SEED, params=svc_params)
将训练和测试数据集用Numpy转化为数组形式,在准备了我们的第一层基础模型之后,我们现在就可以通过从原始数据框中生成NumPy数组输入到我们的分类器中.
'''
将训练集,测试集和目标集转化为Numpy数组输入我们的模型
'''
y_train = train['Survived'].ravel()
train = train.drop(['Survived'], axis=1)
x_train = train.values # 创建训练数据集数组
x_test = test.values # 创建测试集数组
Output of the First level Predictions
我们现在将训练和测试数据提供给我们的5个基本分类器,并使用我们先前定义的“Out-of-fold”预测函数来生成我们的第一级预测。 让下面的代码块运行几分钟。
'''
将训练集和测试集送入模型,然后采用交叉验证方式进行预测,
这些预测结果作为二级模型的新特征
'''
et_oof_train, et_oof_test = get_oof(et, x_train, y_train, x_test) # Extra Trees
rf_oof_train, rf_oof_test = get_oof(rf,x_train, y_train, x_test) # Random Forest
ada_oof_train, ada_oof_test = get_oof(ada, x_train, y_train, x_test) # AdaBoost
gb_oof_train, gb_oof_test = get_oof(gb,x_train, y_train, x_test) # Gradient Boost
svc_oof_train, svc_oof_test = get_oof(svc,x_train, y_train, x_test) # Support Vector Classifier

print("Training is complete")
Training is complete
Feature importances generated from the different classifiers
现在学习了我们的一级分类器,我们可以利用Sklearn模型非常漂亮的功能,就是用一个非常简单的代码行输出训练和测试集中的各种特征的重要性。
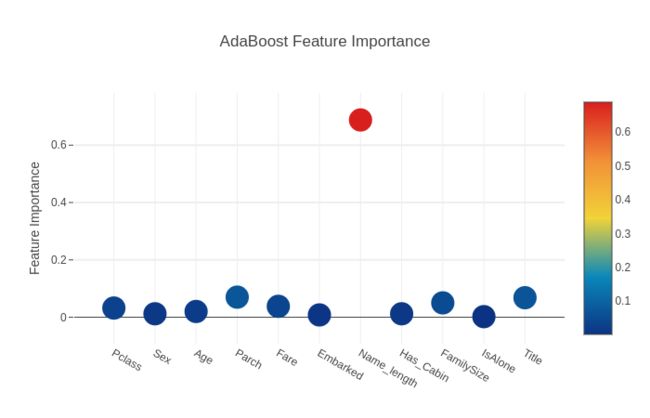
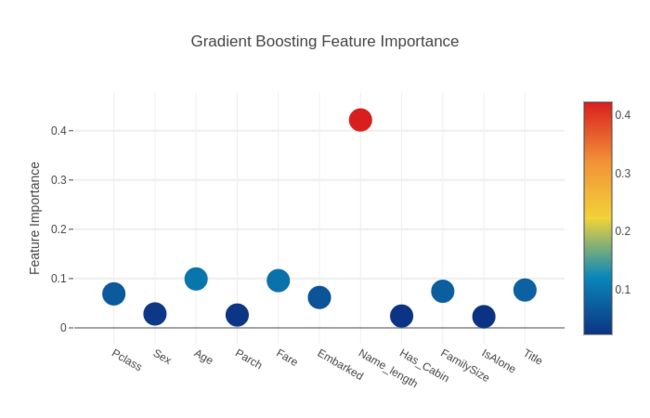
根据Sklearn文档,大多数分类器都内置一个返回特征重要性的属性,只需键入* .featureimportances *。 因此,我们将通过我们的函数来调用这个非常有用的属性,并绘制特征重要性
rf_feature = rf.feature_importances(x_train,y_train)
et_feature = et.feature_importances(x_train, y_train)
ada_feature = ada.feature_importances(x_train, y_train)
gb_feature = gb.feature_importances(x_train,y_train)
[ 0.12484713 0.1985492 0.03209724 0.02100884 0.07167029 0.02315751
0.10954824 0.06534253 0.06718295 0.01371762 0.27287845]
[ 0.11885135 0.37915981 0.02952962 0.01635491 0.05744599 0.02853969
0.04698746 0.08480836 0.04514129 0.02155196 0.17162955]
[ 0.026 0.012 0.018 0.062 0.038 0.01 0.702 0.012 0.048 0.004
0.068]
[ 0.07263123 0.03140828 0.09660243 0.03467843 0.12329197 0.04223265
0.40450823 0.01648166 0.06881401 0.02429948 0.08505162]
所以我还没有弄清楚如何直接分配和存储功能重要性。 因此,我将打印出上述代码中的值,然后简单地将其复制并粘贴到Python列表中(对于像我这样的渣渣而言)
rf_features = [0.12498469 , 0.19922785,  0.0316831 , 0.0223603   ,0.07226212 , 0.02401386,
  0.10897115,  0.06612361,  0.06432287 , 0.01396492  ,0.27208554]
et_features = [ 0.12027932 , 0.37517402,  0.03058711,  0.01641389 , 0.05745466 , 0.02841024
  ,0.04745908 , 0.0819602  , 0.04557341 , 0.02210857,  0.17457949]
ada_features = [ 0.032 , 0.012, 0.02  , 0.07   ,0.038 , 0.008,  0.688 , 0.012  ,0.05  , 0.002,
  0.068]
gb_features = [ 0.06897889,  0.02829149,  0.09927303,  0.02606372 , 0.0959052,   0.06168049
  ,0.42184628,  0.02403087  ,0.07425776 , 0.02280308,  0.07686918]
从包含特征重要性数据的列表创建数据框,以便通过Plotly包轻松绘制。
cols = train.columns.values
# Create a dataframe with features
feature_dataframe = pd.DataFrame( {'features': cols,
     'Random Forest feature importances': rf_features,
     'Extra Trees  feature importances': et_features,
      'AdaBoost feature importances': ada_features,
    'Gradient Boost feature importances': gb_features
    })
Interactive feature importances via Plotly scatterplots
在这种情况下,我将使用交互式Plotly软件包,通过调用“Scatter”,通过一个散点图来显示不同分类器的特征重要性值,如下所示:
# Scatter plot
trace = go.Scatter(
    y = feature_dataframe['Random Forest feature importances'].values,
    x = feature_dataframe['features'].values,
    mode='markers',
    marker=dict(
        sizemode = 'diameter',
        sizeref = 1,
        size = 25,
#       size= feature_dataframe['AdaBoost feature importances'].values,
        #color = np.random.randn(500), #set color equal to a variable
        color = feature_dataframe['Random Forest feature importances'].values,
        colorscale='Portland',
        showscale=True
    ),
    text = feature_dataframe['features'].values
)
data = [trace]

layout= go.Layout(
    autosize= True,
    title= 'Random Forest Feature Importance',
    hovermode= 'closest',
#     xaxis= dict(
#         title= 'Pop',
#         ticklen= 5,
#         zeroline= False,
#         gridwidth= 2,
#     ),
    yaxis=dict(
        title= 'Feature Importance',
        ticklen= 5,
        gridwidth= 2
    ),
    showlegend= False
)
fig = go.Figure(data=data, layout=layout)
py.iplot(fig,filename='scatter2010')

# Scatter plot
trace = go.Scatter(
    y = feature_dataframe['Extra Trees  feature importances'].values,
    x = feature_dataframe['features'].values,
    mode='markers',
    marker=dict(
        sizemode = 'diameter',
        sizeref = 1,
        size = 25,
#       size= feature_dataframe['AdaBoost feature importances'].values,
        #color = np.random.randn(500), #set color equal to a variable
        color = feature_dataframe['Extra Trees  feature importances'].values,
        colorscale='Portland',
        showscale=True
    ),
    text = feature_dataframe['features'].values
)
data = [trace]

layout= go.Layout(
    autosize= True,
    title= 'Extra Trees Feature Importance',
    hovermode= 'closest',
#     xaxis= dict(
#         title= 'Pop',
#         ticklen= 5,
#         zeroline= False,
#         gridwidth= 2,
#     ),
    yaxis=dict(
        title= 'Feature Importance',
        ticklen= 5,
        gridwidth= 2
    ),
    showlegend= False
)
fig = go.Figure(data=data, layout=layout)
py.iplot(fig,filename='scatter2010')

# Scatter plot
trace = go.Scatter(
    y = feature_dataframe['AdaBoost feature importances'].values,
    x = feature_dataframe['features'].values,
    mode='markers',
    marker=dict(
        sizemode = 'diameter',
        sizeref = 1,
        size = 25,
#       size= feature_dataframe['AdaBoost feature importances'].values,
        #color = np.random.randn(500), #set color equal to a variable
        color = feature_dataframe['AdaBoost feature importances'].values,
        colorscale='Portland',
        showscale=True
    ),
    text = feature_dataframe['features'].values
)
data = [trace]

layout= go.Layout(
    autosize= True,
    title= 'AdaBoost Feature Importance',
    hovermode= 'closest',
#     xaxis= dict(
#         title= 'Pop',
#         ticklen= 5,
#         zeroline= False,
#         gridwidth= 2,
#     ),
    yaxis=dict(
        title= 'Feature Importance',
        ticklen= 5,
        gridwidth= 2
    ),
    showlegend= False
)
fig = go.Figure(data=data, layout=layout)
py.iplot(fig,filename='scatter2010')

# Scatter plot
trace = go.Scatter(
    y = feature_dataframe['Gradient Boost feature importances'].values,
    x = feature_dataframe['features'].values,
    mode='markers',
    marker=dict(
        sizemode = 'diameter',
        sizeref = 1,
        size = 25,
#       size= feature_dataframe['AdaBoost feature importances'].values,
        #color = np.random.randn(500), #set color equal to a variable
        color = feature_dataframe['Gradient Boost feature importances'].values,
        colorscale='Portland',
        showscale=True
    ),
    text = feature_dataframe['features'].values
)
data = [trace]

layout= go.Layout(
    autosize= True,
    title= 'Gradient Boosting Feature Importance',
    hovermode= 'closest',
#     xaxis= dict(
#         title= 'Pop',
#         ticklen= 5,
#         zeroline= False,
#         gridwidth= 2,
#     ),
    yaxis=dict(
        title= 'Feature Importance',
        ticklen= 5,
        gridwidth= 2
    ),
    showlegend= False
)
fig = go.Figure(data=data, layout=layout)
py.iplot(fig,filename='scatter2010')
现在让我们计算所有特征重要性的平均值,并将其作为特征重要性数据框中的新列存储。
# Create the new column containing the average of values

feature_dataframe['mean'] = feature_dataframe.mean(axis= 1) # axis = 1 computes the mean row-wise
feature_dataframe.head(3)
绘制平均特征重要性的条形图
在所有分类器中获得平均特征重要性之后,我们可以将它们绘制成如下的绘图条形图:
y = feature_dataframe['mean'].values
x = feature_dataframe['features'].values
data = [go.Bar(
            x= x,
             y= y,
            width = 0.5,
            marker=dict(
               color = feature_dataframe['mean'].values,
            colorscale='Portland',
            showscale=True,
            reversescale = False
            ),
            opacity=0.6
        )]

layout= go.Layout(
    autosize= True,
    title= 'Barplots of Mean Feature Importance',
    hovermode= 'closest',
#     xaxis= dict(
#         title= 'Pop',
#         ticklen= 5,
#         zeroline= False,
#         gridwidth= 2,
#     ),
    yaxis=dict(
        title= 'Feature Importance',
        ticklen= 5,
        gridwidth= 2
    ),
    showlegend= False
)
fig = go.Figure(data=data, layout=layout)
py.iplot(fig, filename='bar-direct-labels')
5. Second-Level Predictions from the First-level Output
First-level output as new features
现在已经获得了我们的一级预测,可以将其视为构建了一组新特征,作为下一个分类器的训练数据。 根据下面的代码,我们因此将新列作为我们早期分类器的一级预测,并在新特征集上训练下一个分类器。
base_predictions_train = pd.DataFrame( {'RandomForest': rf_oof_train.ravel(),
     'ExtraTrees': et_oof_train.ravel(),
     'AdaBoost': ada_oof_train.ravel(),
      'GradientBoost': gb_oof_train.ravel()
    })
base_predictions_train.head()
'''
二级训练集相关热图
'''
data = [
go.Heatmap(
z= base_predictions_train.astype(float).corr().values ,
x=base_predictions_train.columns.values,
y= base_predictions_train.columns.values,
colorscale='Viridis',
showscale=True,
reversescale = True
)
]
py.iplot(data, filename='labelled-heatmap')已经有不少文章和Kaggle比赛获奖者的故事证明训练好彼此之间不相关的模型是获得制胜的关键
'''
一级模型训练和测试预测数据集
作为二次模型的训练和测试集,
然后我们可以拟合二级学习模型了。
'''
x_train = np.concatenate(( et_oof_train, rf_oof_train, ada_oof_train, gb_oof_train, svc_oof_train), axis=1)
x_test = np.concatenate(( et_oof_test, rf_oof_test, ada_oof_test, gb_oof_test, svc_oof_test), axis=1)
Second level learning model via XGBoost
在这里,我们选择了非常有名的算法用于提升树木学习模型,XGBoost。 它是为优化大规模提升树算法而建立的. 有关算法的更多信息,请查看官方文档。
无论如何,我们称之为XGBClassifier并将其拟合于一级训练和目标数据,并使用学习模型在测试数据进行预测
'''
只需简单的运行模型中使用的XGBoost参数:

**max_depth** :你想要增长你的树有多深。 如果设置得太高,请注意,可能会有过度拟合的风险。

**gamma** : 在树的叶节点上进一步分区所需的最小损耗减少。 越大,算法越保守。

**eta** : 在每个增压步骤中使用的步骤尺寸缩小以防止过度拟合
'''
gbm = xgb.XGBClassifier(
    #learning_rate = 0.02,
 n_estimators= 2000,
 max_depth= 4,
 min_child_weight= 2,
 #gamma=1,
 gamma=0.9,
 subsample=0.8,
 colsample_bytree=0.8,
 objective= 'binary:logistic',
 nthread= -1,
 scale_pos_weight=1).fit(x_train, y_train)
predictions = gbm.predict(x_test)
6. Producing the Submission file
'''
最后,我们已经训练和适应了我们所有的一级和二级模型,
我们现在可以将预测输出到适用于Titanic比赛的格式如下:
生成提交文件
'''
StackingSubmission = pd.DataFrame({ 'PassengerId': PassengerId,
                            'Survived': predictions })
StackingSubmission.to_csv("StackingSubmission.csv", index=False)
7. Summary
上面所采取的步骤只是展示了一种非常简单的集合&堆模型的方式。在最高级别的Kaggle比赛中创造的该级别Stack,其中包括堆叠分类器的混合组合以及层叠级别超过2级。
可能采取一些额外的步骤来提高自己的得分可能是:
1.在训练模型中实现良好的交叉验证策略,以找到最佳参数值
2.介绍更多种基础模型进行学习。 结果越不相关,最终得分越好。
对于其他一般的堆&集合的资料,请参阅MLWave:Kaggle Ensembling Guide网站必读文章。


