import pandas as pd
import matplotlib.pyplot as plt

women_degrees = pd.read_csv('percent-bachelors-degrees-women-usa.csv')
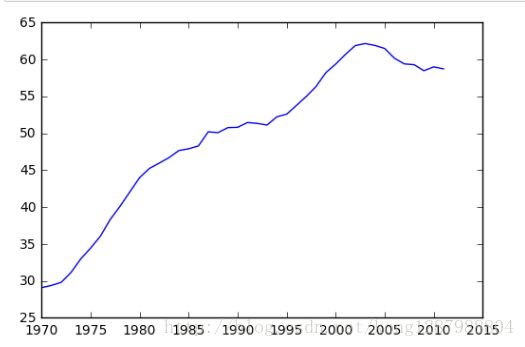
plt.plot(women_degrees['Year'], women_degrees['Biology'])
plt.show()
#100-women_degrees means men
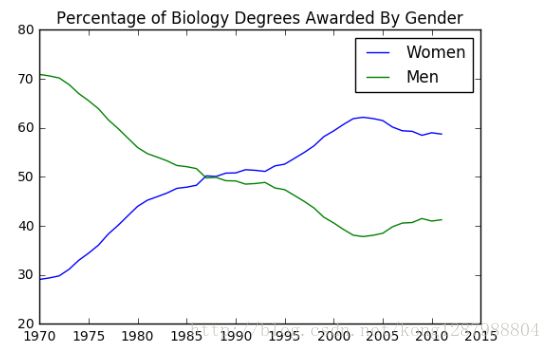
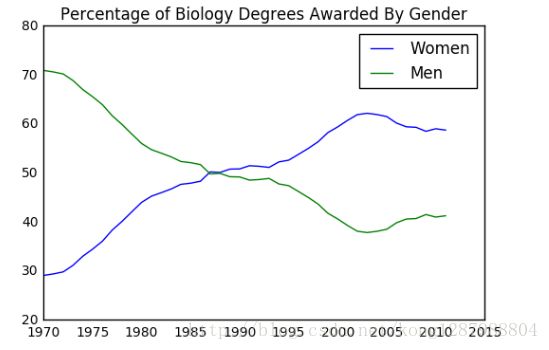
plt.plot(women_degrees['Year'], women_degrees['Biology'], c='blue', label='Women')
plt.plot(women_degrees['Year'], 100-women_degrees['Biology'], c='green', label='Men')
plt.legend(loc='upper right')
plt.title('Percentage of Biology Degrees Awarded By Gender')
plt.show()
fig, ax = plt.subplots()
# Add your code here.
fig, ax = plt.subplots()
ax.plot(women_degrees['Year'], women_degrees['Biology'], label='Women')
ax.plot(women_degrees['Year'], 100-women_degrees['Biology'], label='Men')

ax.tick_params(bottom="off", top="off", left="off", right="off")
ax.set_title('Percentage of Biology Degrees Awarded By Gender')
ax.legend(loc="upper right")

plt.show()

fig, ax = plt.subplots()
ax.plot(women_degrees['Year'], women_degrees['Biology'], c='blue', label='Women')
ax.plot(women_degrees['Year'], 100-women_degrees['Biology'], c='green', label='Men')
ax.tick_params(bottom="off", top="off", left="off", right="off")
for key,spine in ax.spines.items():
spine.set_visible(False)
ax.legend(loc='upper right')
plt.show()
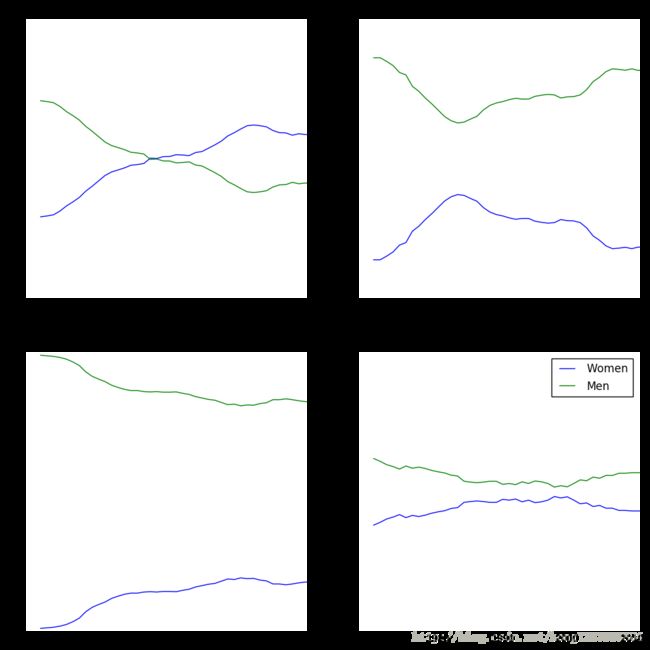
major_cats = ['Biology', 'Computer Science', 'Engineering', 'Math and Statistics']
fig = plt.figure(figsize=(12, 12))

for sp in range(0,4):
    ax = fig.add_subplot(2,2,sp+1)
    ax.plot(women_degrees['Year'], women_degrees[major_cats[sp]], c='blue', label='Women')
    ax.plot(women_degrees['Year'], 100-women_degrees[major_cats[sp]], c='green', label='Men')
    # Add your code here.

# Calling pyplot.legend() here will add the legend to the last subplot that was created.
plt.legend(loc='upper right')
plt.show()

major_cats = ['Biology', 'Computer Science', 'Engineering', 'Math and Statistics']
fig = plt.figure(figsize=(12, 12))

for sp in range(0,4):
    ax = fig.add_subplot(2,2,sp+1)
    ax.plot(women_degrees['Year'], women_degrees[major_cats[sp]], c='blue', label='Women')
    ax.plot(women_degrees['Year'], 100-women_degrees[major_cats[sp]], c='green', label='Men')
    for key,spine in ax.spines.items():
        spine.set_visible(False)
    ax.set_xlim(1968, 2011)
    ax.set_ylim(0,100)
    ax.set_title(major_cats[sp])
    ax.tick_params(bottom="off", top="off", left="off", right="off")

# Calling pyplot.legend() here will add the legend to the last subplot that was created.
plt.legend(loc='upper right')
plt.show()
