matplotlib.pyplot创建子图的方式

一个作图的窗口就是一个Figure, 在Figure上可以有很多个Axes/Subplot,每一个Axes/Subplot为一个单独的绘图区,可以在上面绘图。其中每一个Axes/subplot, 有XAxis,YAxis,在上面可以标出刻度,刻度的范围,以及X、Y轴的标签label。
1. 面向对象的方式
1.1 创建Figure
figure(num=None, figsize=None, dpi=None, facecolor=None, edgecolor=None, frameon=True)
- num:图像编号或名称,数字为编号 ,字符串为名称
- figsize:指定figure的宽和高,单位为英寸,缺省值为(6.4,4.8)
- dpi:指定绘图对象的分辨率,即每英寸多少个像素,缺省值为100,1英寸等于2.54cm
- facecolor:背景颜色,缺省值为(白色)
- edgecolor:边框颜色,缺省值为(白色)
- frameon:是否显示边框,缺省值为(是)
import matplotlib.pyplot as plt
import numpy as np
fig = plt.figure(num=1, figsize=(7, 7),facecolor='blue')
plt.show()
1.2 创建子图
add_subplot(nrows, ncols, index, **kwargs)
或是add_subplot(nrowsncolsindex),将三个参数写在一起,如果index大于10就不能用这种写法
- nrows:行数
- ncols:列数
- index:图片索引
mport matplotlib.pyplot as plt
import numpy as np

x = np.arange(10)
y = np.arange(10)

fig = plt.figure(num=1, figsize=(7, 7))
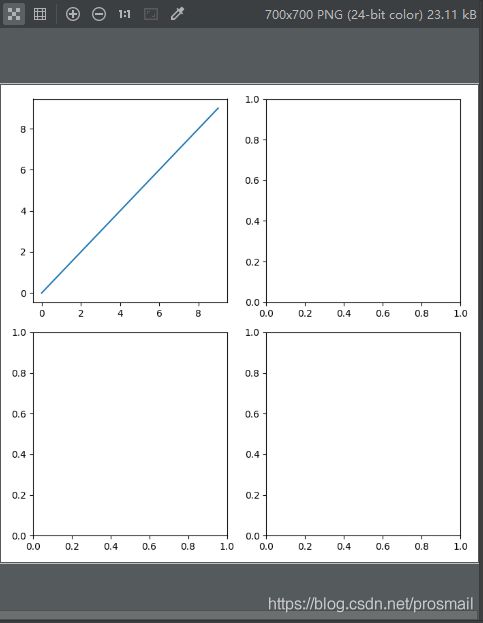
ax1 = fig.add_subplot(2, 2, 1)
ax2 = fig.add_subplot(2, 2, 2)
ax3 = fig.add_subplot(2, 2, 3)
ax4 = fig.add_subplot(2, 2, 4)
ax1.plot(x, y)
plt.show()
1.3 同时创建多个子图
subplots(nrows=1, ncols=1)
创建一个子图
import matplotlib.pyplot as plt
import numpy as np

x = np.arange(10)
y = np.arange(10)

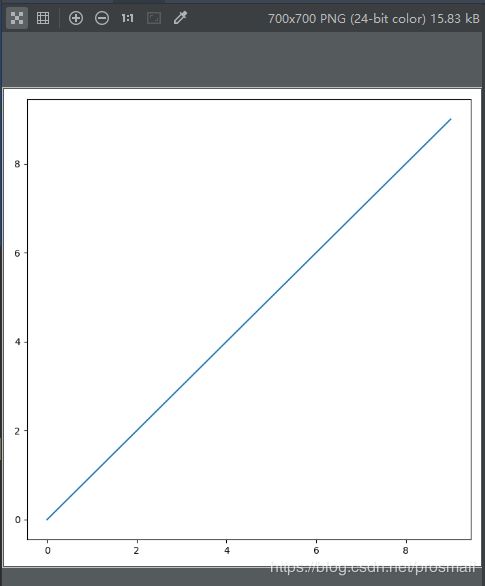
fig = plt.figure(num=1, figsize=(7, 7))
ax = fig.subplots() #默认一行一列
ax.plot(x, y)
plt.show()
import matplotlib.pyplot as plt
import numpy as np

x = np.arange(10)
y = np.arange(10)

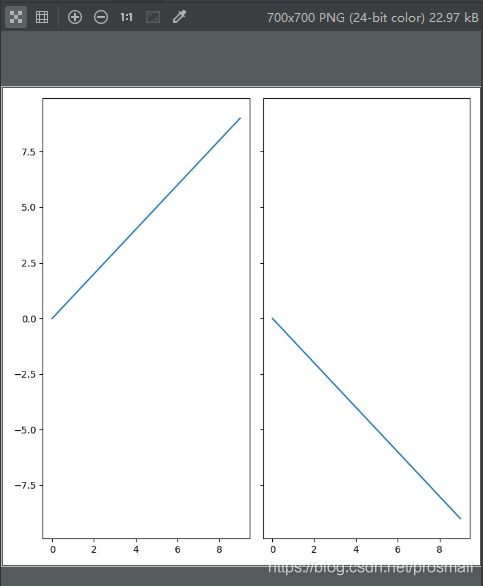
fig = plt.figure(num=1, figsize=(7, 7))
ax1, ax2 = fig.subplots(1, 2, sharey=True)
ax1.plot(x, y)
ax2.plot(x, -y)
plt.show()
import matplotlib.pyplot as plt
import numpy as np

x = np.arange(10)
y = np.arange(10)

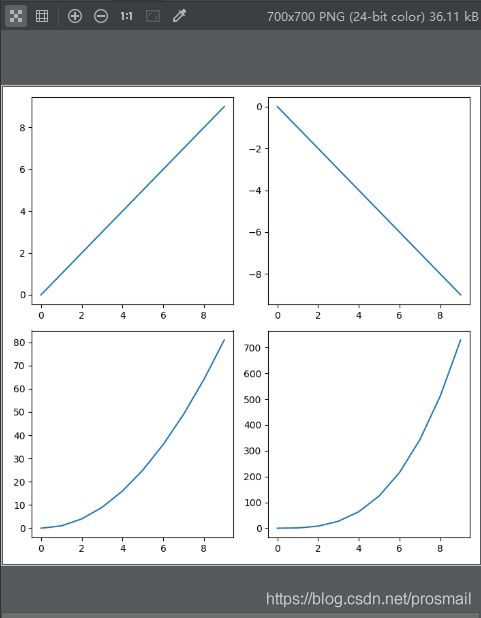
fig = plt.figure(num=1, figsize=(7, 7))


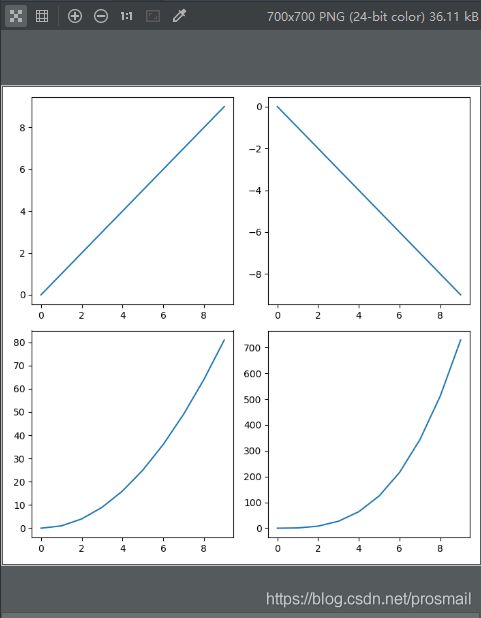
axes = fig.subplots(2, 2)
ax1 = axes[0, 0]
ax2 = axes[0, 1]
ax3 = axes[1, 0]
ax4 = axes[1, 1]

ax1.plot(x, y)
ax2.plot(x, -y)
ax3.plot(x, y**2)
ax4.plot(x, y**3)
plt.show()
2.pyplot的方式
2.1创建子图
import matplotlib.pyplot as plt
import numpy as np

x = np.arange(10)
y = np.arange(10)
plt.figure(num=1, figsize=(7, 7))
plt.subplot(221)
plt.plot(x, x)

plt.subplot(222)
plt.plot(x, -x)

plt.subplot(223)
plt.plot(x, x**2)

plt.subplot(224)
plt.plot(x, x**3)

plt.show()
同时创建多个子图
import matplotlib.pyplot as plt
import numpy as np

x = np.arange(10)
y = np.arange(10)

fig, axes = plt.subplots(2, 2, num=1, figsize=(7, 7))
axes[0, 0].plot(x, y)
axes[0, 1].plot(x, -y)
axes[1, 0].plot(x, y**2)
axes[1, 1].plot(x, y**3)

plt.show()

