共享单车需求预测
共享单车需求预测
数据集介绍
数据集来自Kaggle的一个Playground竞赛。数据产生于记录了骑行时间,出发地点,到达地点,到达时间的共享单车传感器网络,其可用于研究城市中的移动特性。本次比赛中,参与者要求将历史使用情况于天气数据相结合,以便预测华盛顿特区的共享单车租赁需求。
参数介绍
- datetime: hourly date + timestamp
- season: 1 = spring, 2 = summer, 3 = fall, 4 = winter
- holiday(binary): 是否为节假日
- workingday: 当天是工作日还是周末
- weather
- 1: 晴,少云,晴间多云,部分多云
- 2: 雾+多云,雾+云,雾+少云,雾
- 3: 小雨,小雨+雷雨+零星云,小雨+零星云
- 4: 大雨+冰雹+雷雨+雾,雪+雾
- temp: 气温
- atemp: 体感温度
- humidity: 相对湿度
- windspeed: 风速
- casual: 非会员用户租车数量
- registered: 会员用户租车数量
- count: 总租车数
共12项参数
评价标准
提交的预测使用对数误差方均根(Root Mean Squared Logarithmic Error),公式如下:
其中:
- n n 是测试集数据量
- pi p i 是预测值
- ai a i 是实际值
- log(x) l o g ( x ) 是自然对数
基本数据情况与预处理
import pylab
import numpy as np
import pandas as pd
import seaborn as sn
from datetime import datetime
import calendar
import matplotlib.pyplot as plt
from IPython.core.interactiveshell import InteractiveShell
InteractiveShell.ast_node_interactivity = "all"
%matplotlib inline
plt.rcParams['font.sans-serif'] = ['SimHei']
plt.rcParams['axes.unicode_minus'] = False
# %config InlineBackend.figure_format = 'svg'
train = pd.read_csv('./data/train.csv')
test = pd.read_csv('./data/test.csv')数据基本信息
train.shape
test.shapetrain.head(2)
test.head(2)| datetime | season | holiday | workingday | weather | temp | atemp | humidity | windspeed | casual | registered | count | |
|---|---|---|---|---|---|---|---|---|---|---|---|---|
| 0 | 2011-01-01 00:00:00 | 1 | 0 | 0 | 1 | 9.84 | 14.395 | 81 | 0.0 | 3 | 13 | 16 |
| 1 | 2011-01-01 01:00:00 | 1 | 0 | 0 | 1 | 9.02 | 13.635 | 80 | 0.0 | 8 | 32 | 40 |
| datetime | season | holiday | workingday | weather | temp | atemp | humidity | windspeed | |
|---|---|---|---|---|---|---|---|---|---|
| 0 | 2011-01-20 00:00:00 | 1 | 0 | 1 | 1 | 10.66 | 11.365 | 56 | 26.0027 |
| 1 | 2011-01-20 01:00:00 | 1 | 0 | 1 | 1 | 10.66 | 13.635 | 56 | 0.0000 |
训练集有10886组数据,测试集有6493行数据,测试集中有关数量的列是待预测的。
train.dtypes datetime object
season int64
holiday int64
workingday int64
weather int64
temp float64
atemp float64
humidity int64
windspeed float64
casual int64
registered int64
count int64
dtype: objecttrain['date'] = train.datetime.apply(lambda x: x.split()[0])
train['hour'] = train.datetime.apply(lambda x: x.split()[1].split(':')[0])
begin = datetime(2011, 1, 1)
train['pirod'] = train.date.apply(lambda x: (datetime.strptime(x, "%Y-%m-%d") - begin).days)train = train.drop(['datetime'], axis=1)缺失值
count()统计每列的非空值的个数,len()返回数据的长度。两者相减就能得出相应列数据的缺失情况。如下所示,这个数据集没有值的缺失情况。
train.count() - len(train) season 0
holiday 0
workingday 0
weather 0
temp 0
atemp 0
humidity 0
windspeed 0
casual 0
registered 0
count 0
date 0
hour 0
pirod 0
dtype: int64离群点的处理
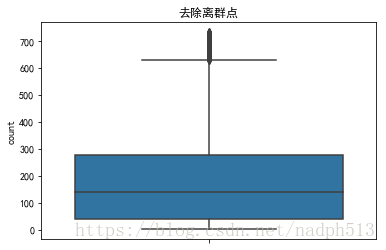
sn.boxplot(data=train,y="count",orient="v")首先作出箱型图,在建模中,通常认为大于上界的点为异常数据点,但是考虑到深夜,与高峰用车的差距悬殊问题,故只去除大于三倍标准差的值
outliers_removed = train[np.abs(train['count'] - train['count'].mean()) <= (3 * train['count'].std())]ax = sn.boxplot(data=outliers_removed,y="count",orient="v")
ax.set(title="去除离群点")相关性分析
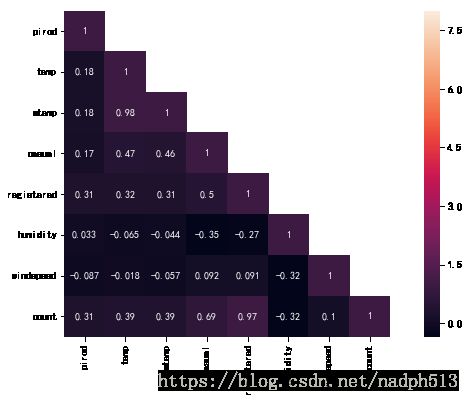
corr_mat = train[['pirod', 'temp', 'atemp', 'casual', 'registered','humidity', 'windspeed', 'count']].corr()
mask = np.array(corr_mat)
mask[np.tril_indices_from(mask)] = False
fig, ax = plt.subplots()
fig.set_size_inches(12, 6)
sn.heatmap(corr_mat, mask=mask, vmax=8, square=True, annot=True)- 特征之间没有明显的关联性,对数量的贡献除了相关的会员数量与非会员数量外,天气与环境对租车数量的关联性都不是很明显。
- “atemp”在预测过程中不会被考虑,因其与”temp”有很强的相关性。在模型建立的过程中,两者必须删除一个,它们在数据中表现多重共线性。是非独立的变量
- 同样,”casual”和”registered”也不会在模型中考虑,对于”count”来说,他们是多余的。
统计分布
axes = sn.distplot(outliers_removed['count'])
axes.set(title="count的统计分布")“count”的分布有点类似正态分布, 但是主要集中在较小的区域内
数据可视化
fig, ax = plt.subplots(1)
fig.set_size_inches(8, 6)
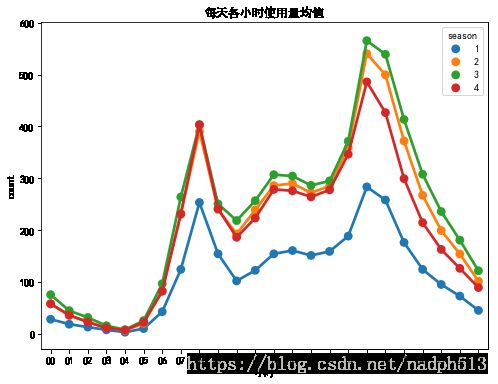
hourAggregated = pd.DataFrame(train.groupby(["hour","season"],sort=True)["count"].mean()).reset_index()
sn.pointplot(x=hourAggregated["hour"], y=hourAggregated["count"],hue=hourAggregated["season"], data=hourAggregated, join=True, ax=ax)
ax.set(xlabel='小时', title='每天各小时使用量均值')
从季节来看,使用量变化都大致一样,从时间上看,使用量有明显的早晚高峰
fig, ax = plt.subplots(1)
fig.set_size_inches(8, 6)
season_aggregated = pd.DataFrame(train.groupby("season")["count"].mean()).reset_index()
sn.barplot(data=season_aggregated,x=season_aggregated['season'],y=season_aggregated['count'],ax=ax)
ax.set(title='季度平均')
春季使用量相对较低,可能与西方重要节日在春季有关,出行量大大减少
fig, ax = plt.subplots(1)
fig.set_size_inches(8, 6)
hourTransformed = pd.melt(train[["hour","casual","registered"]], id_vars=['hour'], value_vars=['casual', 'registered'])
hourAggregated = pd.DataFrame(hourTransformed.groupby(["hour","variable"],sort=True)["value"].mean()).reset_index()
sn.pointplot(x=hourAggregated["hour"], y=hourAggregated["value"],hue=hourAggregated["variable"],hue_order=["casual","registered"], data=hourAggregated, join=True,ax=ax)
ax.set(xlabel='小时', ylabel='count',title="每天会员使用次数与非会员使用次数",label='big')
从上图可以看出,会员用户使用较有规律,有固定的出行方式,表现在早晚高峰的出现。非会员用户只是临时使用,从量上看较为随机
回归预测
train = pd.read_csv('./data/train.csv')
test = pd.read_csv('./data/test.csv')train['date'] = train.datetime.apply(lambda x: x.split()[0])
train['hour'] = train.datetime.apply(lambda x: int(x.split()[1].split(':')[0]))
begin = datetime(2011, 1, 1)
train['pirod'] = train.date.apply(lambda x: (datetime.strptime(x, "%Y-%m-%d") - begin).days)
train = train.drop(['datetime'], axis=1)
train = train[np.abs(train['count'] - train['count'].mean()) <= (3 * train['count'].std())]
test['date'] = test.datetime.apply(lambda x: x.split()[0])
test['hour'] = test.datetime.apply(lambda x: int(x.split()[1].split(':')[0]))
test['pirod'] = test.date.apply(lambda x: (datetime.strptime(x, "%Y-%m-%d") - begin).days)
submmit_datetime = test['datetime']
test = test.drop(['datetime'], axis=1)train = train.drop(['atemp'], axis=1)
test = test.drop(['atemp'], axis=1)test.head(1)
train.head(1)| season | holiday | workingday | weather | temp | humidity | windspeed | date | hour | pirod | |
|---|---|---|---|---|---|---|---|---|---|---|
| 0 | 1 | 0 | 1 | 1 | 10.66 | 56 | 26.0027 | 2011-01-20 | 0 | 19 |
| season | holiday | workingday | weather | temp | humidity | windspeed | casual | registered | count | date | hour | pirod | |
|---|---|---|---|---|---|---|---|---|---|---|---|---|---|
| 0 | 1 | 0 | 0 | 1 | 9.84 | 81 | 0.0 | 3 | 13 | 16 | 2011-01-01 | 0 | 0 |
test.drop(['date'], axis=1).head(1)
train.drop(['date', 'casual', 'registered', 'count'], axis=1).head(1)| season | holiday | workingday | weather | temp | humidity | windspeed | hour | pirod | |
|---|---|---|---|---|---|---|---|---|---|
| 0 | 1 | 0 | 1 | 1 | 10.66 | 56 | 26.0027 | 0 | 19 |
| season | holiday | workingday | weather | temp | humidity | windspeed | hour | pirod | |
|---|---|---|---|---|---|---|---|---|---|
| 0 | 1 | 0 | 0 | 1 | 9.84 | 81 | 0.0 | 0 | 0 |
xArr = train.drop(['date','casual', 'registered', 'count'], axis=1).as_matrix()label = train['count'].as_matrix()test_arr = test.drop(['date'], axis=1).as_matrix()局部线性回归
最先想到的是课内预测效果较好的局部线性回归,函数依然不变,将dataframe转成array后代入计算。
from numpy.linalg import LinAlgError
def lwlr(testPoint, xArr, yArr, k = 1.0):
    xMat = np.mat(xArr); yMat = np.mat(yArr).T
    m = np.shape(xMat)[0]
    weights = np.mat(np.eye((m)))
    for j in range(m):
        diffMat = testPoint - xMat[j, :]
        weights[j, j] = np.exp(diffMat * diffMat.T/(-2.0 * k**2))
    xTx = xMat.T * (weights * xMat)
    if np.linalg.det(xTx) == 0.0:
        print("矩阵为奇异矩阵,不能求逆")
        return
    ws = xTx.I * (xMat.T * (weights * yMat))
    return float(testPoint * ws)

def lwlrTest(testArr, xArr, yArr, k=1.0):
    m = np.shape(testArr)[0]
    yHat = np.zeros(m)
    for i in range(m):
        try:
            yHat[i] = lwlr(testArr[i],xArr,yArr,k)
        except LinAlgError:
            yHat[i] = yHat[i-1]
    return yHat
ans_arr = lwlrTest(test_arr, xArr, label)ans_arr = lwlrTest(test_arr[0:int(len(test_arr) / 10)], xArr, label)sklearn的回归模型
test.head(1)| season | holiday | workingday | weather | temp | humidity | windspeed | date | hour | pirod | |
|---|---|---|---|---|---|---|---|---|---|---|
| 0 | 1 | 0 | 1 | 1 | 10.66 | 56 | 26.0027 | 2011-01-20 | 0 | 19 |
线性回归
from sklearn.linear_model import LinearRegressiondataTrain = train.drop(['date','casual', 'registered', 'count'], axis=1)
dataTest = test.drop(['date'], axis=1)
yLabels = train["count"]
yLablesRegistered = train["registered"]
yLablesCasual = train["casual"]dataTrain.head(1)
dataTest.head(1)| season | holiday | workingday | weather | temp | humidity | windspeed | hour | pirod | |
|---|---|---|---|---|---|---|---|---|---|
| 0 | 1 | 0 | 0 | 1 | 9.84 | 81 | 0.0 | 0 | 0 |
| season | holiday | workingday | weather | temp | humidity | windspeed | hour | pirod | |
|---|---|---|---|---|---|---|---|---|---|
| 0 | 1 | 0 | 1 | 1 | 10.66 | 56 | 26.0027 | 0 | 19 |
model = LinearRegression()
yLabelsLog = np.log1p(yLabels)
model.fit(X=dataTrain, y=yLabelsLog)
LinearRegression(copy_X=True, fit_intercept=True, n_jobs=1, normalize=False)
开始使用原始的”count”代入进行训练,发现预测值中有负值,搜索后发现使用 log(1+x) l o g ( 1 + x ) 可以解决这一问题。最后预测出的值在反过来取 exp() e x p ( ) 即可。
LR_preds = model.predict(dataTest)np.exp(LR_preds).mean()151.46180116796612
submission = pd.DataFrame({
    "datetime": submmit_datetime,
    "count": np.exp(LR_preds)
})
submission.to_csv('LR_submission.csv', index=False)
得分1.03062
岭回归
from sklearn.linear_model import Ridge
from sklearn.model_selection import GridSearchCV
from sklearn import metrics
import warnings
pd.options.mode.chained_assignment = None
warnings.filterwarnings("ignore", category=DeprecationWarning)
def rmsle(y, y_,convertExp=True):
if convertExp:
y = np.exp(y),
y_ = np.exp(y_)
log1 = np.nan_to_num(np.array([np.log(v + 1) for v in y]))
log2 = np.nan_to_num(np.array([np.log(v + 1) for v in y_]))
calc = (log1 - log2) ** 2
return np.sqrt(np.mean(calc))使用训练集来寻找适合的alpha
ridge_m_ = Ridge()
ridge_params_ = { 'max_iter':[3000],'alpha':[0.1, 1, 2, 3, 4, 10, 30,100,200,300,400,800,900,1000]}
rmsle_scorer = metrics.make_scorer(rmsle, greater_is_better=False)
grid_ridge_m = GridSearchCV( ridge_m_,
                          ridge_params_,
                          scoring = rmsle_scorer,
                          cv=5)
yLabelsLog = np.log1p(yLabels)
grid_ridge_m.fit( dataTrain, yLabelsLog )
preds = grid_ridge_m.predict(X= dataTrain)
print (grid_ridge_m.best_params_)
print ("RMSLE Value For Ridge Regression: ",rmsle(np.exp(yLabelsLog),np.exp(preds),False))

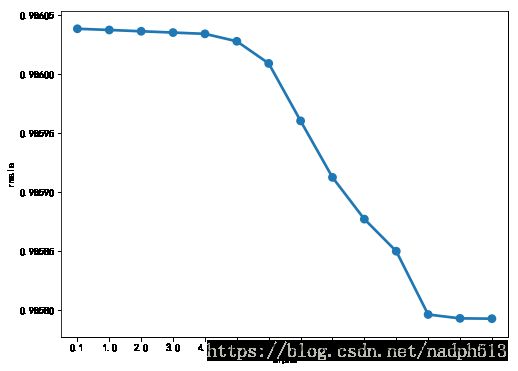
fig,ax= plt.subplots()
fig.set_size_inches(8, 6)
df = pd.DataFrame(grid_ridge_m.grid_scores_)
df["alpha"] = df["parameters"].apply(lambda x:x["alpha"])
df["rmsle"] = df["mean_validation_score"].apply(lambda x:-x)
sn.pointplot(data=df,x="alpha",y="rmsle",ax=ax)
GridSearchCV(cv=5, error_score='raise',
estimator=Ridge(alpha=1.0, copy_X=True, fit_intercept=True, max_iter=None,
normalize=False, random_state=None, solver='auto', tol=0.001),
fit_params=None, iid=True, n_jobs=1,
param_grid={'max_iter': [3000], 'alpha': [0.1, 1, 2, 3, 4, 10, 30, 100, 200, 300, 400, 800, 900, 1000]},
pre_dispatch='2*n_jobs', refit=True, return_train_score='warn',
scoring=make_scorer(rmsle, greater_is_better=False), verbose=0)
{'alpha': 1000, 'max_iter': 3000}
RMSLE Value For Ridge Regression: 0.9791543152862644
从图中看来alpha取1000的时候误差相对较小,但是还是接近1,因此不是很好的模型,接下来对测试集进行预测
Rd_model = Ridge(alpha=1000)
Rd_model.fit(dataTrain, yLabelsLog)
Rd_preds = Rd_model.predict(X=dataTest)
np.exp(Rd_preds).mean()
Ridge(alpha=1000, copy_X=True, fit_intercept=True, max_iter=None,
normalize=False, random_state=None, solver='auto', tol=0.001)
151.29011594921747
submission = pd.DataFrame({
    "datetime": submmit_datetime,
    "count": np.exp(Rd_preds)
})
submission.to_csv('Rd_submission.csv', index=False)
预测的值与线性回归基本相似,得分为1.03079。结果与预想类似,相较于线性回归错误率并没有质的提升
Lasso
from sklearn.linear_model import Lassolasso_m_ = Lasso()
alpha = 1/np.array([0.1, 1, 2, 3, 4, 10, 30,100,200,300,400,800,900,1000])
lasso_params_ = { 'max_iter':[3000],'alpha':alpha}
grid_lasso_m = GridSearchCV( lasso_m_,lasso_params_,scoring = rmsle_scorer,cv=5)
yLabelsLog = np.log1p(yLabels)
grid_lasso_m.fit( dataTrain, yLabelsLog )
preds = grid_lasso_m.predict(X= dataTrain)
print (grid_lasso_m.best_params_)
print ("RMSLE Value For Lasso Regression: ",rmsle(np.exp(yLabelsLog),np.exp(preds),False))
fig,ax= plt.subplots()
fig.set_size_inches(12,5)
df = pd.DataFrame(grid_lasso_m.grid_scores_)
df["alpha"] = df["parameters"].apply(lambda x:x["alpha"])
df["rmsle"] = df["mean_validation_score"].apply(lambda x:-x)
sn.pointplot(data=df,x="alpha",y="rmsle",ax=ax)GridSearchCV(cv=5, error_score='raise',
estimator=Lasso(alpha=1.0, copy_X=True, fit_intercept=True, max_iter=1000,
normalize=False, positive=False, precompute=False, random_state=None,
selection='cyclic', tol=0.0001, warm_start=False),
fit_params=None, iid=True, n_jobs=1,
param_grid={'max_iter': [3000], 'alpha': array([1.00000e+01, 1.00000e+00, 5.00000e-01, 3.33333e-01, 2.50000e-01,
1.00000e-01, 3.33333e-02, 1.00000e-02, 5.00000e-03, 3.33333e-03,
2.50000e-03, 1.25000e-03, 1.11111e-03, 1.00000e-03])},
pre_dispatch='2*n_jobs', refit=True, return_train_score='warn',
scoring=make_scorer(rmsle, greater_is_better=False), verbose=0)
{'alpha': 0.005, 'max_iter': 3000}
RMSLE Value For Lasso Regression: 0.979186612406937
对Lasso回归模型使用相同的方法测试合适的参数,得到alpha为0.005,但是使用训练集测试的RMSLE依然和线性回归没有产生差距。
Ls_model = Ridge(alpha=0.005)
Ls_model.fit(dataTrain, yLabelsLog)
Ls_preds = Ls_model.predict(X=dataTest)
np.exp(Ls_preds).mean()
Ridge(alpha=0.005, copy_X=True, fit_intercept=True, max_iter=None,
normalize=False, random_state=None, solver='auto', tol=0.001)
151.4617990672634
submission = pd.DataFrame({
    "datetime": submmit_datetime,
    "count": np.exp(Ls_preds)
})
submission.to_csv('Ls_submission.csv', index=False)
随机森林
查询资料发现,随机森林也能对回归型的数据进行预测,并且考虑到数据集中有相当部分的特征不的数值型的,而是类别型的数据。尝试使用随机森林来预测
随机森林可以应用在分类和回归问题上。实现这一点,取决于随机森林的每颗cart树是分类树还是回归树。
如果是回归树,则cart树是回归树,采用的原则是最小均方差。即对于任意划分特征A,对应的任意划分点s两边划分成的数据集D1和D2,求出使D1和D2各自集合的均方差最小,同时D1和D2的均方差之和最小所对应的特征和特征值划分点。
from sklearn.ensemble import RandomForestRegressor
Rf_model = RandomForestRegressor(n_estimators=100)
Rf_model.fit(dataTrain,yLabelsLog)
preds = Rf_model.predict(X= dataTrain)
rmsle(np.exp(yLabelsLog),np.exp(preds),False)
RandomForestRegressor(bootstrap=True, criterion='mse', max_depth=None,
max_features='auto', max_leaf_nodes=None,
min_impurity_decrease=0.0, min_impurity_split=None,
min_samples_leaf=1, min_samples_split=2,
min_weight_fraction_leaf=0.0, n_estimators=100, n_jobs=1,
oob_score=False, random_state=None, verbose=0, warm_start=False)
0.11153272473377464
在训练集上,随机森林相较于一般的回归方式有较明显的提升,使用随机森林对测试集进行预测。
Rf_preds = Rf_model.predict(X=dataTest)
np.exp(Rf_preds).mean()
188.68494547504852
submission = pd.DataFrame({
    "datetime": submmit_datetime,
    "count": np.exp(Rf_preds)
})
submission.to_csv('Rf_submission.csv', index=False)XGboost
import xgboost as xg

def grid_search():
    xgr=xg.XGBRegressor(max_depth=8,min_child_weight=6,gamma=0.4)
    xgr.fit(dataTrain, yLabelsLog)
    parameters=[{'subsample':[i/10.0 for i in range(6,10)],
 'colsample_bytree':[i/10.0 for i in range(6,10)]}]
    grid_search= GridSearchCV(estimator=xgr, param_grid=parameters, cv=10,n_jobs=-1)
    grid_search=grid_search.fit(dataTrain, yLabelsLog)
    best_accuracy=grid_search.best_score_
    best_parameters=grid_search.best_params_
    return best_accuracy, best_parameters
best_accuracy, best_parameters = grid_search()
best_accuracy
best_parametersxgr=xg.XGBRegressor(max_depth=8,min_child_weight=6,gamma=0.4,colsample_bytree=0.9,subsample=0.8)
xgr.fit(dataTrain, yLabelsLog)preds = xgr.predict(dataTrain)
rmsle(np.exp(yLabelsLog),np.exp(preds),False)xg_preds = xgr.predict(dataTest)
np.exp(Rf_preds).mean()submission = pd.DataFrame({
"datetime": submmit_datetime,
"count": np.exp(xg_preds)
})
submission.to_csv('xg_submission.csv', index=False)上传得分
参考文献
- 机器学习算法—随机森林实现(包括回归和分类)
- Get Started with XGBoost
- 梯度提升树GBDT原理
- 《python数据分析与挖掘实战》


