python前程无忧scrapy存mogondb案例+可视化显示
一、介绍
python前程无忧scrapy存mogondb案例
接上篇前程无忧案例:spiders和item文件有稍加改动,这里先行奉上啦!
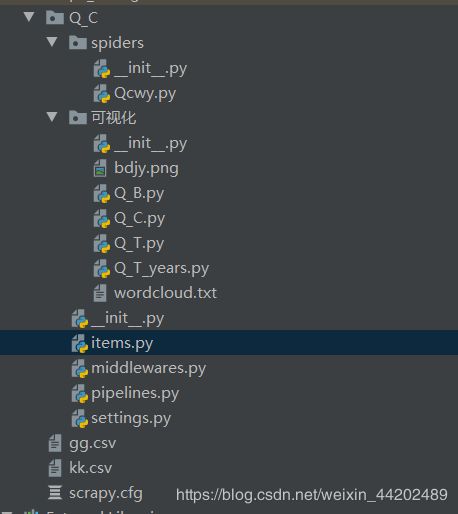
项目结构图:
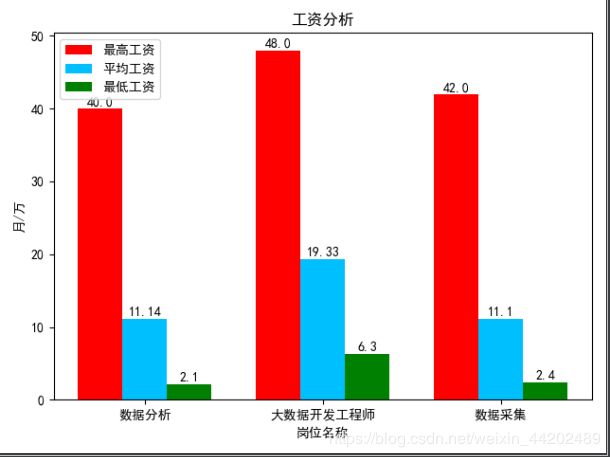
岗位工资对比
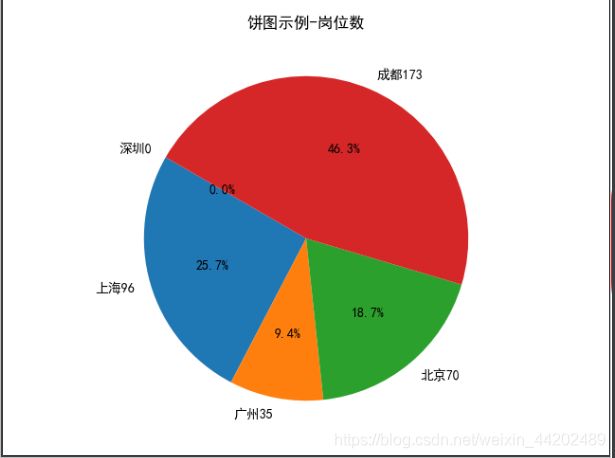
岗位数显示
岗位职责词云

spiders.py
# -*- coding: utf-8 -*-
import scrapy
from Q_C.items import QCItem
class QcwySpider(scrapy.Spider):
    name = 'Qcwy'
    allowed_domains = ['51job.com']
    def start_requests(self):
        # 实现翻页
        for x in range(1, 15):
            #url = "https://search.51job.com/list/090200,000000,0000,00,9,99,大数据,2,{}.html?lang=c&postchannel=0000&workyear=99&cotype=99°reefrom=99&jobterm=99&companysize=99&ord_field=0&dibiaoid=0&line=&welfare=".format(x)
            url = "https://search.51job.com/list/000000,000000,0000,00,9,99,%25E6%2595%25B0%25E6%258D%25AE%25E9%2587%2587%25E9%259B%2586,2,{}.html?lang=c&stype=&postchannel=0000&workyear=99&cotype=99°reefrom=99&jobterm=99&companysize=99&providesalary=99&lonlat=0%2C0&radius=-1&ord_field=0&confirmdate=9&fromType=&dibiaoid=0&address=&line=&specialarea=00&from=&welfare=".format(x)
            # 将拿到的信息交给parse函数
            yield scrapy.Request(url,callback= self.parse)

    def parse(self, response):
        #获取详情页链接
        list = response.xpath('//*[@id="resultList"]/div/p/span/a/@href')
        for i in list:
            url = i.get()
            if url:
                print(url)
    # #             #将详情页拿到的链接交个
                yield scrapy.Request(url, callback=self.data)
    def data(self,response):
        item = QCItem()
        # 职位名称
        item['Jobtitle']=response.xpath('/html/body/div[3]/div[2]/div[2]/div/div[1]/h1/text()').extract_first()
        # 薪资水平
        item['wages'] = response.xpath('/html/body/div[3]/div[2]/div[2]/div/div[1]/strong/text()').extract_first()
        # 招聘单位
        item['recruiters'] = response.xpath('/html/body/div[3]/div[2]/div[4]/div[1]/div[1]/a/p/text()').extract_first()
        # 工作地点
        item['Workingplace'] = response.xpath('/html/body/div[3]/div[2]/div[3]/div[2]/div/p/text()').extract_first()
        # 工作经验
        item['Workexperience'] = response.xpath('/html/body/div[3]/div[2]/div[2]/div/div[1]/p[2]/text()[2]').extract_first()
        # 学历要求
        item['Degreerequired'] = response.xpath('/html/body/div[3]/div[2]/div[2]/div/div[1]/p[2]/text()[3]').extract_first()
        # 公司链接
        item['Jobslink']=response.xpath('/html/body/div[3]/div[2]/div[4]/div[1]/div[1]/a/@href').extract_first()
        # 工作内容
        item['Jobcontent'] = response.xpath('/html/body/div[3]/div[2]/div[3]/div[1]/div/p/text()[2]').extract_first()
        yield item
items.py
# -*- coding: utf-8 -*-

# Define here the models for your scraped items
#
# See documentation in:
# https://docs.scrapy.org/en/latest/topics/items.html

import scrapy

class QCItem(scrapy.Item):
    # define the fields for your item here like:
    # name = scrapy.Field()
    # 职位名称
    Jobtitle=scrapy.Field()
    # 薪资水平
    wages = scrapy.Field()
    # 招聘单位
    recruiters = scrapy.Field()
    # 工作地点
    Workingplace = scrapy.Field()
    # 工作经验
    Workexperience = scrapy.Field()
    # 学历要求
    Degreerequired = scrapy.Field()
    # 工作内容
    Jobcontent = scrapy.Field()
    # 公司链接
    Jobslink = scrapy.Field()
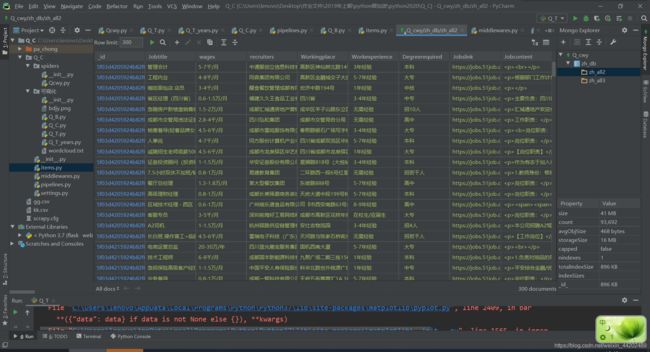
二、爬取结果示例
三、源码
条形图
import re

import pandas as pd
import pymongo
import matplotlib.pyplot as plt
#连接数据库
myclient = pymongo.MongoClient("mongodb://localhost:27017/")
db = myclient["zh_db"]["zh_all2"]
#拿到爬取的数据
数据分析 = {
    "Jobtitle": {"$regex": "数据分析"}
}
大数据开发工程师 = {
    "Jobtitle": {"$regex": "大数据开发工程师"}
}
数据采集 = {
    "Jobtitle": {"$regex": "数据采集"}
}
#
def show_name(list):
    vv = []
    for v in list:
        name = ''
        a = re.findall('[\u4e00-\u9fa5]', str(v))
        for i in a:
            name += i
        vv.append(name)
    return vv
#
def show_bar_chart1(xx,cc):
    ll = xx
    average_Pay_level = []
    max_Pay_level = []
    min_Pay_level = []
    for i in ll:
        data = pd.DataFrame(list(db.find(i)))
        bb = data['wages'].values
        max_Pay_level.append(Pay_level_list(bb)[0])
        average_Pay_level.append(Pay_level_list(bb)[1])
        min_Pay_level.append(Pay_level_list(bb)[2])
    show(max_Pay_level, average_Pay_level, min_Pay_level, cc)
#data为工资列表
# # 统一格式后,输出最大,平均,最小
def Pay_level_list(data):
    ww = [".*?千/月", ".*?万/月", ".*?万/年", ".*?元/天"]
    Pay_level_list = []
    for i in data:
        if isinstance(i, str):
            for j, v in enumerate(ww):
                if re.search(v, i) is not None:
                    if j == 0:
                        num = [round(i, 2) for i in
                               ([(i * 12 / 10) for i in (list(map(float, re.findall(r"\d+\.?\d*", i))))])]
                    elif j == 1:
                        num = [round(i, 2) for i in
                               ([(i * 12) for i in (list(map(float, re.findall(r"\d+\.?\d*", i))))])]
                    elif j == 2:
                        num = [round(i, 2) for i in (list(map(float, re.findall(r"\d+\.?\d*", i))))]
                    elif j == 3:
                        num = [round(i, 2) for i in
                               ([(i * 365 / 10000) for i in (list(map(float, re.findall(r"\d+\.?\d*", i))))])]
                    Pay_level_list.append(num_al(num))
    return max(Pay_level_list), tall_num(Pay_level_list), min(Pay_level_list)

def tall_num(list):
    num = 0
    for i in list:
        num += i
    return round(num/(len(list)+1), 2)
def num_al(list):
    if len(list) >= 2:
        num = (list[0] + list[1]) / 2
    else:
        num = list[0]
    return round(num, 2)
#输出条形图
def show(a, b, c, d):
    name=d  #d = x轴标题(abcd个数要对应)
    y1 = a  # a = 最高工资列表
    y2 = b  #b = 平均工资列表
    y3 = c  #c = 最低工资
    x = pd.np.arange(len(name))
    width = 0.25
    plt.bar(x, y1, width=width, label='最高工资', color='red')
    plt.bar(x + width, y2, width=width, label='平均工资', color='deepskyblue', tick_label=name)
    plt.bar(x + 2 * width, y3, width=width, label='最低工资', color='green')
    # 显示在图形上的值
    for a, b in zip(x, y1):
        plt.text(a, b + 0.1, b, ha='center', va='bottom')
    for a, b in zip(x, y2):
        plt.text(a + width, b + 0.1, b, ha='center', va='bottom')
    for a, b in zip(x, y3):
        plt.text(a + 2 * width, b + 0.1, b, ha='center', va='bottom')
    plt.xticks()
    plt.legend(loc="upper left")  # 防止label和图像重合显示不出来
    plt.rcParams['font.sans-serif'] = ['SimHei']  # 用来正常显示中文标签
    plt.ylabel('月/万')
    plt.xlabel('岗位名称')
    plt.rcParams['savefig.dpi'] = 300  # 图片像素
    plt.rcParams['figure.dpi'] = 300  # 分辨率
    plt.rcParams['figure.figsize'] = (15.0, 8.0)  # 尺寸
    plt.title("工资分析")
    plt.savefig('D:\\result.png')
    plt.show()
def yunxing():
    xx=[数据分析, 大数据开发工程师, 数据采集]
    show_bar_chart1(xx, show_name(xx))
yunxing()
饼图
import re
import matplotlib.pyplot as plt
import pandas as pd
import pymongo


#连接数据库
myclient = pymongo.MongoClient("mongodb://localhost:27017/")
db = myclient["zh_db"]["zh_all2"]
#拿到数据
大数据 = {
    "Jobtitle": {"$regex": "大数据"},
        "$or":
            [
                {"Jobtitle": {"$regex": "数据分析"}}, {"Jobtitle": {"$regex": "大数据开发工程师"}}, {"Jobtitle": {"$regex": "数据采集"}}
            ]
}
上海 = {
    "recruiters": {"$regex": "上海"},
        "$or":
            [
                {"Jobtitle": {"$regex": "数据分析"}}, {"Jobtitle": {"$regex": "大数据开发工程师"}}, {"Jobtitle": {"$regex": "数据采集"}}
            ]
}
北京 = {
    "recruiters": {"$regex": "北京"},
        "$or":
            [
                {"Jobtitle": {"$regex": "数据分析"}}, {"Jobtitle": {"$regex": "大数据开发工程师"}}, {"Jobtitle": {"$regex": "数据采集"}}
            ]
}
广州 = {
    "recruiters": {"$regex": "广州"},
        "$or":
            [
                {"Jobtitle": {"$regex": "数据分析"}}, {"Jobtitle": {"$regex": "大数据开发工程师"}}, {"Jobtitle": {"$regex": "数据采集"}}
            ]
}
成都 = {
    "recruiters": {"$regex": "成都"},
        "$or":
            [
                {"Jobtitle": {"$regex": "数据分析"}}, {"Jobtitle": {"$regex": "大数据开发工程师"}}, {"Jobtitle": {"$regex": "数据采集"}}
            ]
}
深圳 = {
    "recruiters": {"$regex": "深圳"},
        "$or":
            [
                {"Job_title": {"$regex": "数据分析"}}, {"Job_title": {"$regex": "大数据开发工程师"}}, {"Job_title": {"$regex": "数据采集"}}
            ]
}

def show_name(list):
    vv = []
    for v in list:
        name = ''
        a = re.findall('[\u4e00-\u9fa5]', str(v))
        for i in a:
            name += i
        vv.append(name)
    return vv

def pie_chart(list1):
    city = list1
    city1 = []
    city2 = []
    for i in city:
        city1.append(i["recruiters"])#拿到公司名
    mm = show_name(city1)
    for j, v in enumerate(city):
        bb = len(pd.DataFrame(list(db.find(v))))
        city2.append(bb)
        mm[j] += str(bb)
    plt.rcParams['font.sans-serif'] = ['SimHei']  # 用来正常显示中文标签
    sizes = city2
    # explode = (0.1, 0, 0, 0, 0)
    plt.pie(sizes, labels=mm, autopct='%1.1f%%', shadow=False, startangle=150)  # 想要突出
    plt.title("饼图示例-岗位数")
    plt.show()

def yunxing():

    city = [上海, 广州, 北京, 成都, 深圳]
    pie_chart(city)
yunxing()
词云图
import re
import jieba
import pandas as pd
import pymongo
import wordcloud
#连接数据库
myclient = pymongo.MongoClient("mongodb://localhost:27017/")
db = myclient["zh_db"]["zh_all2"]
#拿到数据
CJ = {
    "Jobtitle": {"$regex": "数据采集"}
}
#
def yunxing():
    data = pd.DataFrame(list(db.find(CJ)))
    bb = data['Jobcontent'].values
    for i in bb:
        if type(i) == str:
            filename = 'wordcloud.txt'
            with open(filename, 'w') as file_object:
                for i in jieba.lcut(i):
                    a = re.findall('[\u4e00-\u9fa5]', i)
                    if a:
                        name = ''
                        for i in a:
                            name += i
                        file_object.write(name+'    ')
    mywordcloud = wordcloud.WordCloud(font_path="/Library/Fonts/SIMLI.TTF")
    wf = open("wordcloud.txt", "r").read()
    mywordcloud.generate_from_text(wf)
    mywordcloud.background_color = "white"
    mywordcloud.to_file("bdjy.png")
yunxing()
注意:词云图有点问题,分词有点问题,使用时劳烦微调啦!!
