通过Python做葡萄酒成分与质量的关系分析并可视化--GBDT/随机森林特征选取
葡萄酒成分与质量关系分析 -- 通过GBDT以及Random Forests进行特征选取
在UCI下载葡萄酒数据集,链接:https://archive.ics.uci.edu/ml/machine-learning-databases/wine-quality/ 红酒有1599个样本,白葡萄酒有4898个样本,本文使用红酒的数据集,文件名为winequality-red.csv
数据预处理
先把需要使用的包给导入
import pandas as pd
import numpy as np
from sklearn.ensemble import GradientBoostingClassifier, RandomForestClassifier
from sklearn.model_selection import train_test_split, cross_val_score
from sklearn.preprocessing import StandardScaler
import matplotlib.pyplot as plt
根据数据集和GBDT以及随机森林算法的特性,本文不做离群值探测,直接使用原始数据。把所有特征归为X,质量归为y,把数据八二分为训练集和测试集,再做一个标准化处理。
data = pd.read_csv('winequality-red.csv')
X = data.iloc[:,:-1]
y = data.iloc[:,-1]

X_train, X_test, y_train, y_test = train_test_split(X, y, test_size = 0.2, random_state = 0)

# Feature Scaling
sc = StandardScaler()
X_train = sc.fit_transform(X_train)
X_test = sc.transform(X_test)
建立GBDT模型
为防止过拟合,并且因为数据集较小,有时间可以做一个max_depth最大深度的系数tuning,得出最好一个max_depth系数(用cross validation交叉验证得分的均值来对比得出最好的一个max_depth系数),根据对数据集和算法的理解,这里设置的tuning系数范围为3-12。
gbdt_rg = [i for i in range(3,13)]
gbdt_score = []#用cress validation交叉验证得分来评估max_depth的效果
for i in gbdt_rg:
    print("Now it's doing the max_depth tuning: " + str(i))
    gbdt_clf = GradientBoostingClassifier(max_depth=i)
    gbdt_clf.fit(X_train, y_train)
    scores = cross_val_score(gbdt_clf, X, y, cv=5)
    gbdt_score.append(scores)
得到一个list:gbdt_score,这个list里面包含了10个分数集,分别是当max_depth为3,4…12时的交叉验证得分。每个得分内包含了5个分数(因为设置了cv=5,即5-fold cross validation),取其平均数作为最后得分,之后在这个list内取最大值,那么最大值对应的一个系数就是我们要的最佳的max_depth的系数。有时间就做吧,因为数据集小所以几分钟就能出结果,我tune出来最佳的max_depth为3。
avg_gbdt_score = [np.mean(i) for i in gbdt_score]#每组交叉验证平均得分
best_gbdt_depth = gbdt_rg[avg_gbdt_score.index(max(avg_gbdt_score))]#找出最佳的交叉验证结果并找出相对应得max_depth数值
之后根据这个系数建立GBDT模型
gbdt_clf = GradientBoostingClassifier(max_depth = best_gbdt_depth)
gbdt_clf.fit(X_train, y_train)
y_pred = gbdt_clf.predict(X_test)
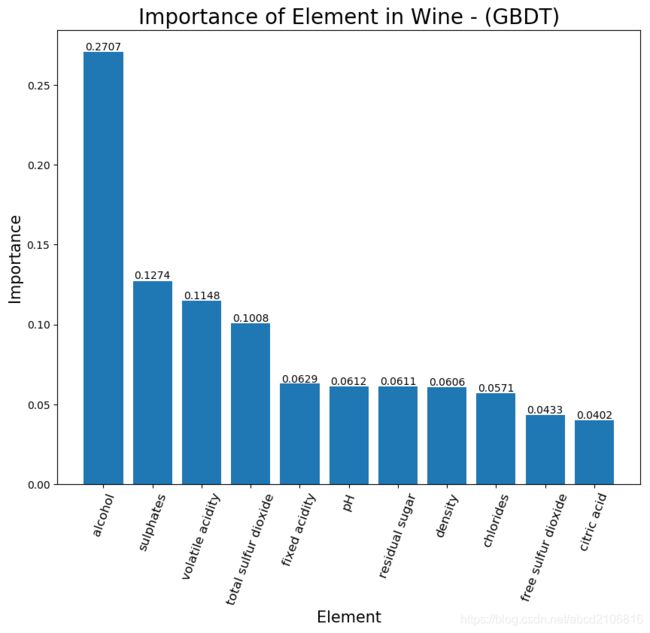
模型建立之后可以利用feature_importances_函数进行特征选取,对比哪个特征的重要程度最高,这里为方便后边的可视化就先把importance与X的特征名称合并并按照importance进行降序排序
gbdt_importance = gbdt_clf.feature_importances_#找出各特征的importance
gbdt_importance = np.concatenate((gbdt_importance.reshape((-1,1)), np.array(list(X.columns)).reshape((-1,1))), axis=1)
gbdt_importance = gbdt_importance[np.argsort(gbdt_importance[:,0])[::-1]]#把importance倒叙排列
可视化GBDT模型的Importance
plt.title('Importance of Element in Wine - (GBDT)', fontdict={'fontsize':20})
plt.bar(gbdt_importance[:,1], gbdt_importance[:,0].astype(float))
plt.xlabel('Element',fontdict={'fontsize':15})
plt.ylabel('Importance',fontdict={'fontsize':15})
for xx, yy in zip([i for i in range(len(gbdt_importance[:,1]))],np.around(gbdt_importance[:,0].astype(float), decimals=4)):
    plt.text(xx, yy+0.001, str(yy), ha='center')
plt.xticks(rotation=70,fontsize=12)
plt.figure(figsize=(10,8))
plt.show()
建立随机森林模型
跟GBDT非常相似,先做个max_depth的tuning,再找出各特征的importance
'''随机森林分类, 做max_depth的tuning'''
rf_rg = [i for i in range(3,13)]
rf_score = []#用cress validation交叉验证得分来评估max_depth的效果
for i in rf_rg:
    print("Now it's doing the max_depth tuning: " + str(i))
    rf_clf = RandomForestClassifier(n_estimators=100, max_depth=i)
    rf_clf.fit(X_train, y_train)
    scores = cross_val_score(rf_clf, X, y, cv=5)
    rf_score.append(scores)

'''建立随机森林模型'''
avg_rf_score = [np.mean(i) for i in rf_score]#每组交叉验证平均得分
best_rf_depth = rf_rg[avg_rf_score.index(max(avg_rf_score))]#找出最佳的交叉验证结果并找出相对应得max_depth数值
rf_clf = RandomForestClassifier(n_estimators=100, max_depth = best_rf_depth)
rf_clf.fit(X_train, y_train)
y_pred = rf_clf.predict(X_test)
rf_importance = rf_clf.feature_importances_#找出各特征的importance
rf_importance = np.concatenate((rf_importance.reshape((-1,1)), np.array(list(X.columns)).reshape((-1,1))), axis=1)
rf_importance = rf_importance[np.argsort(rf_importance[:,0])[::-1]]#把importance倒叙排列
并做可视化
rf_fig = plt.gcf()
plt.title('Importance of Element in Wine - (Random Forest)', fontdict={'fontsize':20})
plt.bar(rf_importance[:,1], rf_importance[:,0].astype(float))
plt.xlabel('Element',fontdict={'fontsize':15})
plt.ylabel('Importance',fontdict={'fontsize':15})
#各特征的importance保留4为小数后标签在图上
for xx, yy in zip([i for i in range(len(rf_importance[:,1]))],np.around(rf_importance[:,0].astype(float), decimals=4)):
    plt.text(xx, yy+0.001, str(yy), ha='center')
plt.xticks(rotation=70,fontsize=12)
plt.figure(figsize=(10,8))
plt.show()
分析结果


GBDT以及Random Forests算法结果表示alcohol酒精是影响红酒质量最主要的因素,整理来说Alcohol(酒精), Sulphates(硫酸盐), Volatile acidity(挥发酸), Total sulfur dioxide(二氧化硫总量) 是4个影响红酒质量的主要成分。
完整代码
# -*- coding: utf-8 -*-
"""
Created on Sun Dec 15 10:07:50 2019

@author: trium
"""
import pandas as pd
import numpy as np
from sklearn.ensemble import GradientBoostingClassifier, RandomForestClassifier
from sklearn.model_selection import train_test_split, cross_val_score
from sklearn.preprocessing import StandardScaler
import matplotlib.pyplot as plt

data = pd.read_csv('winequality-red.csv')
X = data.iloc[:,:-1]
y = data.iloc[:,-1]

X_train, X_test, y_train, y_test = train_test_split(X, y, test_size = 0.2, random_state = 0)

# Feature Scaling
sc = StandardScaler()
X_train = sc.fit_transform(X_train)
X_test = sc.transform(X_test)

#######################################################################################################################################
'''GBDT分类, 做max_depth的tuning'''
gbdt_rg = [i for i in range(3,13)]
gbdt_score = []#用cress validation交叉验证得分来评估max_depth的效果
for i in gbdt_rg:
    print("Now it's doing the max_depth tuning: " + str(i))
    gbdt_clf = GradientBoostingClassifier(max_depth=i)
    gbdt_clf.fit(X_train, y_train)
    scores = cross_val_score(gbdt_clf, X, y, cv=5)
    gbdt_score.append(scores)

'''建立GBDT模型'''
avg_gbdt_score = [np.mean(i) for i in gbdt_score]#每组交叉验证平均得分
best_gbdt_depth = gbdt_rg[avg_gbdt_score.index(max(avg_gbdt_score))]#找出最佳的交叉验证结果并找出相对应得max_depth数值
gbdt_clf = GradientBoostingClassifier(max_depth = best_gbdt_depth)
gbdt_clf.fit(X_train, y_train)
y_pred = gbdt_clf.predict(X_test)
gbdt_importance = gbdt_clf.feature_importances_#找出各特征的importance
gbdt_importance = np.concatenate((gbdt_importance.reshape((-1,1)), np.array(list(X.columns)).reshape((-1,1))), axis=1)

'''可视化各特征的importance'''
gbdt_importance = gbdt_importance[np.argsort(gbdt_importance[:,0])[::-1]]#把importance倒叙排列
gbdt_fig = plt.gcf()
plt.title('Importance of Element in Wine - (GBDT)', fontdict={'fontsize':20})
plt.bar(gbdt_importance[:,1], gbdt_importance[:,0].astype(float))
plt.xlabel('Element',fontdict={'fontsize':15})
plt.ylabel('Importance',fontdict={'fontsize':15})
for xx, yy in zip([i for i in range(len(gbdt_importance[:,1]))],np.around(gbdt_importance[:,0].astype(float), decimals=4)):
    plt.text(xx, yy+0.001, str(yy), ha='center')
plt.xticks(rotation=70,fontsize=12)
plt.figure(figsize=(10,8))
plt.show()
gbdt_fig.savefig("Importance-(GBDT result).png", dpi=100, bbox_inches = 'tight')


#######################################################################################################################################
'''随机森林分类, 做max_depth的tuning'''
rf_rg = [i for i in range(3,13)]
rf_score = []#用cress validation交叉验证得分来评估max_depth的效果
for i in rf_rg:
    print("Now it's doing the max_depth tuning: " + str(i))
    rf_clf = RandomForestClassifier(n_estimators=100, max_depth=i)
    rf_clf.fit(X_train, y_train)
    scores = cross_val_score(rf_clf, X, y, cv=5)
    rf_score.append(scores)

'''建立随机森林模型'''
avg_rf_score = [np.mean(i) for i in rf_score]#每组交叉验证平均得分
best_rf_depth = rf_rg[avg_rf_score.index(max(avg_rf_score))]#找出最佳的交叉验证结果并找出相对应得max_depth数值
rf_clf = RandomForestClassifier(n_estimators=100, max_depth = best_rf_depth)
rf_clf.fit(X_train, y_train)
y_pred = rf_clf.predict(X_test)
rf_importance = rf_clf.feature_importances_#找出各特征的importance
rf_importance = np.concatenate((rf_importance.reshape((-1,1)), np.array(list(X.columns)).reshape((-1,1))), axis=1)

'''可视化各特征的importance'''
rf_importance = rf_importance[np.argsort(rf_importance[:,0])[::-1]]#把importance倒叙排列
rf_fig = plt.gcf()
plt.title('Importance of Element in Wine - (Random Forest)', fontdict={'fontsize':20})
plt.bar(rf_importance[:,1], rf_importance[:,0].astype(float))
plt.xlabel('Element',fontdict={'fontsize':15})
plt.ylabel('Importance',fontdict={'fontsize':15})
#各特征的importance保留4为小数后标签在图上
for xx, yy in zip([i for i in range(len(rf_importance[:,1]))],np.around(rf_importance[:,0].astype(float), decimals=4)):
    plt.text(xx, yy+0.001, str(yy), ha='center')
plt.xticks(rotation=70,fontsize=12)
plt.figure(figsize=(10,8))
plt.show()
rf_fig.savefig("Importance-(RandomForest result).png", dpi=100, bbox_inches = 'tight')