【新手入门】mathematica 画图
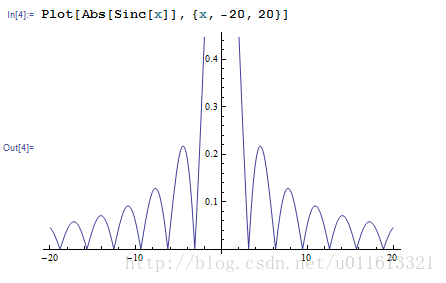
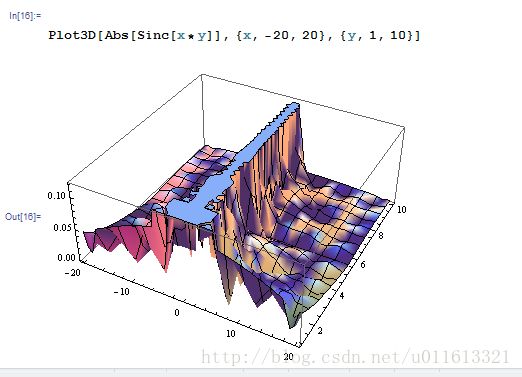
1.图形一、Plot[f(x),{x,xmin,xmax},options] 和 Plot3D[f(x,y),{x,xmin,xmax},{y,ymin,ymax},options]
含义:在区间【 xmin,xmax],变量x的 函数图像
注意大小写!
3D图像
3.用mathematica来玩儿音乐
4.画蜂窝图!!
unit = Table[{Cos[x], Sin[x]}, {x, 0, 2*Pi, Pi/3}];
Ul[xn_, xZ_] := Module[{un, ss},
   un = unit[[{4, 3, 2, 1}]];
   ss = {};
   Do[ss = Join[ss, Table[un[[j]] + {3*i, xZ}, {j, 1, 4}]], {i, 1,
     xn}];
   Line[ss]
   ];
Ll[xn_, xZ_] := Module[{un, ss},
   un = unit[[{4, 5, 6, 1}]];
   ss = {};
   Do[ss = Join[ss, Table[un[[j]] + {3*i, xZ}, {j, 1, 4}]], {i, 1,
     xn}];
   Line[ss]
   ];
FW[xR_, xC_] := Module[{GG},
  GG = {};
  Do[GG = Join[GG, {Ul[xC, i*Sqrt[3]], Ll[xC, i*Sqrt[3]]}], {i, 1,
    xR}];
  Graphics[GG]
  ]
FW[10, 8]
简便方法:u = Graphics[ Line [{{2, 0}, {3, Sqrt[3]}, {5, Sqrt[3]}, {6, 0}, {5, -Sqrt[3]}, {3, -Sqrt[3]}, {2, 0}}]]
参考资料:1,http://wenku.baidu.com/view/d1cd4418ff00bed5b9f31d1d.html?re=view
2.http://blog.renren.com/share/200156125/15589600681
3. http://www.kylen314.com/archives/1554


