核支持向量机SVM的应用
文章目录
- 1. 核技巧
- 2. 理解SVM
- 3. 调参
- 4. 应用乳腺癌数据集-分类-RBF核SVM
- 5. 优缺点与参数
- 6. some docstring
核支持向量机(kernelized support vector machine)(通常简称为SVM),可以同时用于分类和回归,在sklearn中为SVC和SVR。背后数学比较复杂,可参见《统计学习基础》。
from sklearn.svm import SVC
svm = SVC(kernel='rbf', C=10, gamma=0.1).fit(X, y)
1. 核技巧
线性模型在低维空间中可能非常受限,因为线和平面的灵活性有限。有一种方法可以让线性模型更加灵活,就是添加更多的特征——举个例子,添加输入特征的交互项或多项式。
向数据表示中添加非线性特征,可以让线性模型变得更强大。但是,通常来说我们并不知道要添加哪些特征,而且添加许多特征(比如100 维特征空间所有可能的交互项)的计算开销可能会很大。
幸运的是,有一种巧妙的数学技巧,让我们可以在更高维空间中学习分类器,而不用实际计算可能非常大的新的数据表示。这种技巧叫作核技巧(kernel trick),它的原理是直接计算扩展特征表示中数据点之间的距离(更准确地说是内积),而不用实际对扩展进行计算。
对于支持向量机,将数据映射到更高维空间中有两种常用的方法:
- 多项式核,在一定阶数内计算原始特征所有可能的多项式(比如feature12 * feature2 5);
- 径向基函数(radial basis function,RBF)核,也叫高斯核。高斯核有点难以解释,因为它对应无限维的特征空间。一种对高斯核的解释是它考虑所有阶数的所有可能的多项式,但阶数越高,特征的重要性越小。
2. 理解SVM
在训练过程中,SVM 学习每个训练数据点对于表示两个类别之间的决策边界的重要性。
通常只有一部分训练数据点对于定义决策边界来说很重要:位于类别之间边界上的那些点。这些点叫作支持向量(support vector),支持向量机正是由此得名。
想要对新样本点进行预测,需要测量它与每个支持向量之间的距离。分类决策是基于它与支持向量之间的距离以及在训练过程中学到的支持向量重要性(保存在SVC 的dual_coef_属性中)来做出的。
数据点之间的距离由高斯核给出:
k r b f ( x 1 , x 2 ) = e x p ( − γ ∣ ∣ x 1 − x 2 ∣ ∣ 2 ) k_{rbf}(x_{1},x_{2})=exp(-\gamma||x_{1}-x_{2}||^{2}) krbf(x1,x2)=exp(−γ∣∣x1−x2∣∣2)
这里 x 1 x_{1} x1 和 x 2 x_{2} x2 是数据点, ‖ x 1 − x 2 ‖ ‖x_{1} - x_{2}‖ ‖x1−x2‖ 表示欧氏距离, γ ( g a m m a ) γ(gamma) γ(gamma)是控制高斯核宽度的参数。
3. 调参
- gamma 参数:控制高斯核的宽度。决定点与点之间“靠近”是指多大的距离。gamma 较小,说明高斯核的半径较大,许多点都被看作比较靠近。表示决策边界变化很慢,生成的是复杂度较低的模型,而大的gamma 值则会生成更为复杂的模型。
- C 参数:正则化参数,与线性模型中用到的类似。它限制每个点的重要性(或者更确切地说,每个点的dual_coef_)。与线性模型相同,C 值很小,说明模型非常受限,每个数据点的影响范围都有限。
4. 应用乳腺癌数据集-分类-RBF核SVM
- 导入包与数据集
from sklearn.svm import SVC  # 从svm模块中导入用于分类的
from sklearn.model_selection import train_test_split
from sklearn.datasets import load_breast_cancer
import matplotlib as mpl
import matplotlib.pyplot as plt

cancer = load_breast_cancer()
X_train,X_test,y_train,y_test = train_test_split(cancer.data,cancer.target,random_state=0)
- 构建SVM分类器,需显式指定gamma是’auto’ or ‘scale’
svc = SVC(gamma='auto')   # 构建SVM分类器,需显式指定gamma是'auto' or 'scale'
svc.fit(X_train,y_train)

print("Accuracy on training set: {:.2f}".format(svc.score(X_train, y_train)))  # 1.0
print("Accuracy on test set: {:.2f}".format(svc.score(X_test, y_test)))  # 0.63
gamma原来默认是auto,gamma = 1 / (n_features)将被弃用。
新版本需要显式指定’auto’ or ‘scale’。
scale的gamma使用1 / (n_features * X.var())
svc = SVC(gamma='scale')   # 构建SVM分类器,需显式指定gamma是'auto' or 'scale'
svc.fit(X_train,y_train)

print("Accuracy on training set: {:.2f}".format(svc.score(X_train, y_train)))  # 0.90
print("Accuracy on test set: {:.2f}".format(svc.score(X_test, y_test))) # 0.94
可以看出gamma是auto时模型过拟合,当gamma是scale时模型精度提高,这可能跟数据缩放有关。
分析:第一种的模型测试集精度原小于训练集,存在严重过拟合。由于SVM对参数设定和数据缩放十分敏感,要求所有特征有相似的变化范围,所以需要数据预处理。
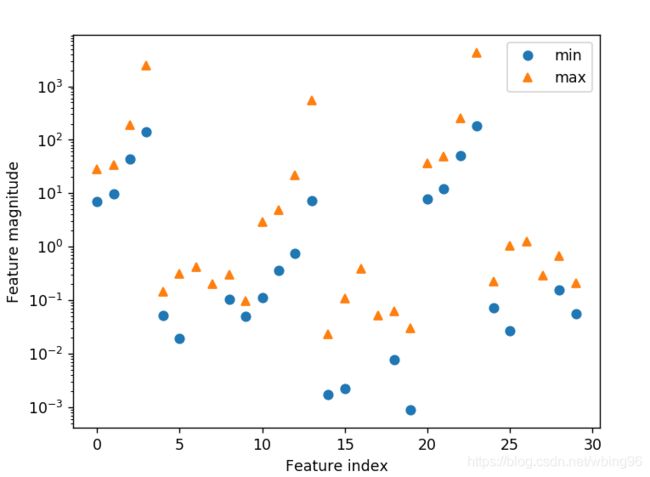
- 查看数据集的每个特征的取值范围
# 查看一个二维结构每行或每列的最小值,沿0轴向即沿行的方向,就是列的最小值
X_train.min(axis=0)
## 画图表示最值范围
plt.plot(X_train.min(axis=0),'o',label='min')
plt.plot(X_train.max(axis=0),'^',label='max')
plt.xlabel('Feature index')
plt.ylabel('Feature magnitude')
plt.legend()
plt.yscale('log')  # 设置y轴尺度为对数坐标

可以看出,不同的特征具有不同的数量级,对核SVM有很大影响。
方法一:缩放每个特征,使其都在同一范围,常用归一化到0-1之间,可用函数MinMaxSacler。
这里先用人工实现归一化。
原理:(每个特征的数据-最小值)/该特征的极差范围,即小范围/大范围,所以每个数据都在0-1之间
## 对训练集归一化
min_on_training = X_train.min(axis=0)  # 计算各特征的最小值,返回array
max_on_training = X_train.max(axis=0)
range_on_training = max_on_training-min_on_training  # 计算各特征的极差
r2 = X_train.ptp(axis=0)  # numpy求极差

# (每个特征的数据-最小值)/该特征的极差范围,即小范围/大范围,所以每个数据都在0-1之间
X_train_scaled = (X_train - min_on_training)/r2  # 不同维度之间算术运算,可能是广播机制
print('min for each feature:\n{}'.format(X_train_scaled.min(axis=0)))
print('max for each feature:\n{}'.format(X_train_scaled.max(axis=0)))
## 对测试集归一化:利用训练集的最小值和范围对测试集做相同的变换(详见第3章)??为什么使用训练集的?
X_test_scaled = (X_test - min_on_training) / range_on_training
print('min for each feature:\n{}'.format(X_test_scaled.min(axis=0)))
print('max for each feature:\n{}'.format(X_test_scaled.max(axis=0)))
svc = SVC(gamma='auto')
svc.fit(X_train_scaled,y_train)  # y不需要变

print("Accuracy on training set: {:.3f}".format(svc.score(X_train_scaled, y_train)))  # 0.948
print("Accuracy on test set: {:.3f}".format(svc.score(X_test_scaled, y_test)))  # 0.951
可以看出,数据缩放后测试集精度大幅提高,并且现在比训练集精度还高,说明模型处于欠拟合的状态。可以增大C或gamma来拟合更复杂的模型。
增大C:
# 增大C=1000,显著改进了模型
svc = SVC(gamma='auto',C=1000)   # 构建SVM分类器,需显式指定gamma是'auto' or 'scale'
svc.fit(X_train_scaled,y_train)  # y不需要变

print("Accuracy on training set: {:.3f}".format(svc.score(X_train_scaled, y_train)))  # 0.988
print("Accuracy on test set: {:.3f}".format(svc.score(X_test_scaled, y_test)))  # 0.972
5. 优缺点与参数
- 优点:非常强大的模型,在低维数据和高维数据(即很少特征和很多特征)上表现都很好
- 缺点:不适合大数据,即过万的样本量,表现在运行时间和内存方面;
缺点2:对数据预处理和调参敏感,数据预处理和模型调参需要非常小心。这也是为什么如今很多应用中用的都是基于树的模型,比如随机森林或梯度提升(需要很少的预处理,甚至不需要预处理)。
缺点3:模型很难检查,难以理解模型预测的原因也难以解释。 - 关键参数:正则化参数C,核的选择,核相关的参数,比如RBF需要的gamma(高斯核宽度的倒数)。gamma 和C 控制的都是模型复杂度,较大的值都对应更为复杂的模型。因此,这两个参数的设定通常是强烈相关的,应该同时调节。
- 总结:SVM仍然值得尝试,尤其在所有特征的测量单位相似且范围也差不多时
6. some docstring
?plt.yscale  # 设置y轴尺度scale
plt.yscale(value, **kwargs)
value : {"linear", "log", "symlog", "logit", ...}  # The axis scale type to apply.
?SVC
SVC(
    C=1.0,    # Penalty parameter C of the error term.对误差项的惩罚参数
    kernel='rbf',  # RBF核,可选:'linear', 'poly', 'sigmoid', 'precomputed' or a callable.
    degree=3,
    # 核系数,默认auto,which uses 1 / n_features,
    gamma='auto_deprecated',  # 将被弃用,新版本需要指定'auto' or 'scale',scale的gamma使用1 / (n_features * X.var())
    coef0=0.0,
    shrinking=True,
    probability=False,
    tol=0.001,
    cache_size=200,
    class_weight=None,
    verbose=False,
    max_iter=-1,
    decision_function_shape='ovr',
    random_state=None,
)
注1:C-SVM,基于libsvm,LIBSVM是台湾大学林智仁教授等开发设计的一个简单、易于使用和快速有效的SVM模式识别与回归的软件包
LIBSVM 使用的一般步骤是:
1) 按照LIBSVM软件包所要求的格式准备数据集;
2) 对数据进行简单的缩放操作;
3) 考虑选用RBF 核函数;
4) 采用交叉验证选择最佳参数C与g ;
5) 采用最佳参数C与g 对整个训练集进行训练获取支持向量机模型;
6) 利用获取的模型进行测试与预测。
注2:可能不适合数以万计的样本,对于大数据集考虑使用:sklearn.linear_model.LinearSVC或sklearn.linear_model.SGDClassifier`
——来自于《机器学习基础》的实践

