数据降维 Python sklearn库PCA(学习笔记)
import pandas as pd
from sklearn.decomposition import PCA
inputfile='/data.xls'
outputfile='/outputdata.xls'
data=pd.read_excel(inputfile,header=None)
pca=PCA()
pca.fit(data)#训练模型
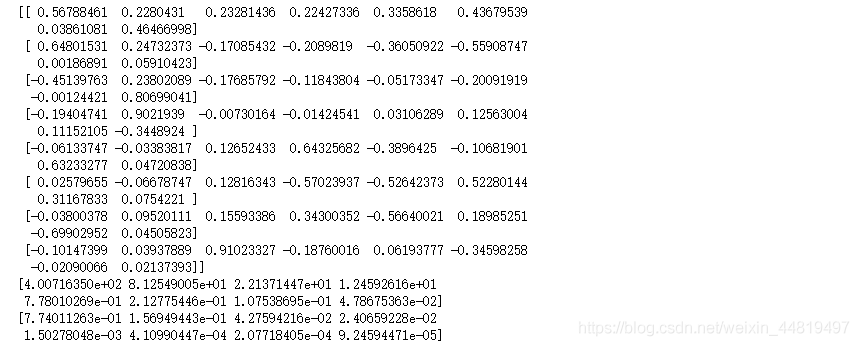
print(pca.components_)#返回模型的特征向量
print(pca.explained_variance_)#返回模型的特征值
print(pca.explained_variance_ratio_)#返回各成分的方差百分比

前三个方差百分比累加超过95%,选择降维后的特征维度数目为3
pca=PCA(3)
pca.fit(data)
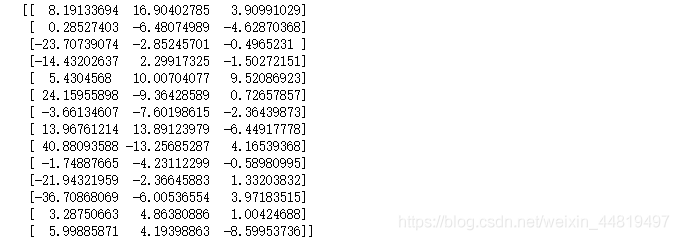
low_d=pca.transform(data)#降维
pd.DataFrame(low_d).to_excel(outputfile)
print(low_d)
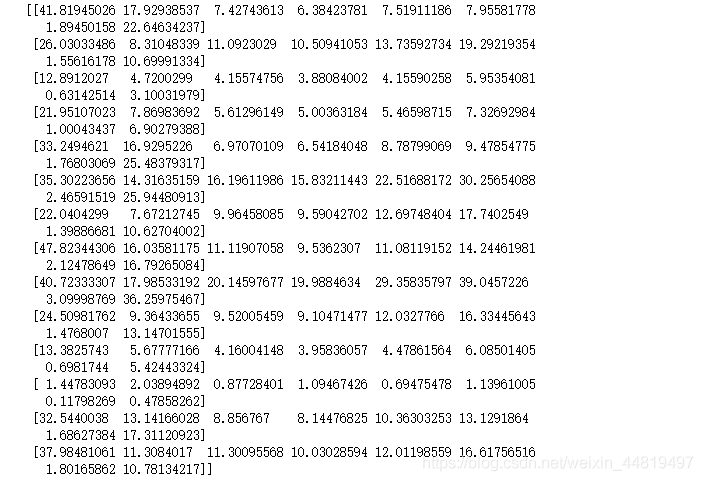
print(pca.inverse_transform(low_d))#恢复数据
#随机生成数据
import numpy as np
import matplotlib.pyplot as plt
from mpl_toolkits.mplot3d import Axes3D
from sklearn.datasets.samples_generator import make_blobs
#X为样本特征,Y为样本簇类别,每个样本有3个特征,共4个簇
X,Y=make_blobs(n_samples=10000,n_features=3,centers=[[3,3,3],[0,0,0],[1,1,1],[2,2,2]],cluster_std=[0.2,0.1,0.2,0.2],random_state=9)
#做三维图
fig=plt.figure()
ax=Axes3D(fig,rect=[0,0,1,1],elev=30,azim=20)
plt.scatter(X[:,0],X[:,1],X[:,2],marker='o')
plt.show()
from sklearn.decomposition import PCA
pca=PCA(n_components=3)
pca.fit(X)#训练模型
print(pca.explained_variance_)#返回模型的特征值
print(pca.explained_variance_ratio_)#返回各成分的方差百分比
pca=PCA(n_components=2)
pca.fit(X)
X_new=pca.transform(X)
plt.scatter(X_new[:,0],X_new[:,1],marker='o')
plt.show()
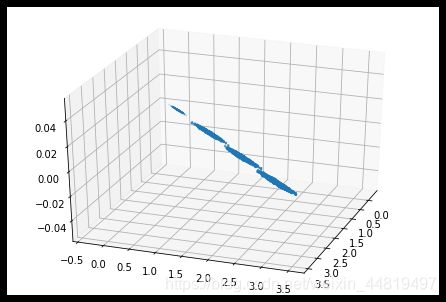
X=pca.inverse_transform(X_new)#恢复数据
fig=plt.figure()
ax=Axes3D(fig,rect=[0,0,1,1],elev=30,azim=20)
plt.scatter(X[:,0],X[:,1],X[:,2],marker='o')
plt.show()


