Vue 中使用vue2-highcharts实现实时曲线数据展示示例
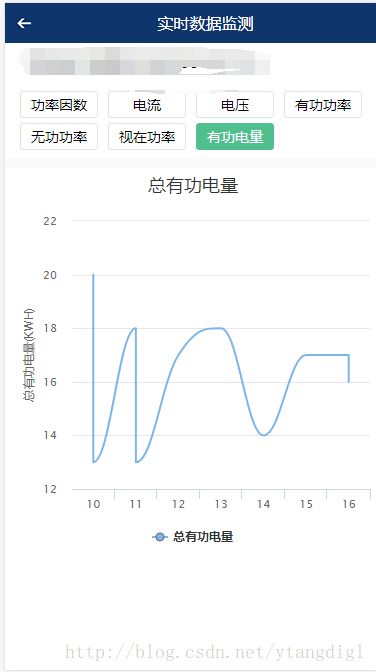
1、上一篇文章Vue 中使用vue2-highcharts实现曲线数据展示示例主要是使用vue2-highcharts实现历史曲线,将一连串(多个数据点)以曲线的方式显示出来。实时曲线,每隔一分钟,增加一个点,实时的将多个点连接起来绘制成曲线,并且最多显示10个点,如果已经有10个点,最后一个点加进来之前,将最前面的一个点移除掉。 
2、vue前端代码如下:
<template>

  <div>
      <div >
        <div>
              <img src="../assets/index/back.png" class="rank-head-back" @click="routerBack"/>

              <span>实时数据监测span>
        div>
      div>

      <div >

            <div>
                <span >{{$route.params.monitorName}}({{$route.params.meterId}})span>
            div>

      div>

      <div >

            <div >

                  <vchooser  :selections="periodList" @on-change="onParamChange('versions', $event)">vchooser>

            div>

      div>

      <div >

            <div class="charts">
                 <vue-highcharts :options="options" ref="lineCharts">vue-highcharts>
            div>

      div>

  div>

template>

<script>

  import vchooser from '../components/chooser.vue'
  import VueHighcharts from 'vue2-highcharts'

  export default {
    data() {
        return{
           setIntervalNum:0,
           itemStatus:0,
           itemTitle:'功率因数',
           itemType:this.$route.params.meterType,
           periodList:[
             {
               label: '功率因数',
               value: 0
             },
             {
               label: '电流',
               value: 1
             },{
               label: '电压',
               value: 2
             },{
               label: '有功功率',
               value: 3
             },{
               label: '无功功率',
               value: 4
             },{
               label: '视在功率',
               value: 5
             },{
               label: '有功电量',
               value: 6
             },
           ],
           ownerFreeData: [],
           options: {
           global: {
              useUTC: false
            },
           chart: {
              type: 'spline'
            },
            title: {
              text: '功率因素'
              //text: ' '
            },
            subtitle: {
              text: ''
            },
            xAxis: {
              type: 'category'
            },
            yAxis: {
              title: {
                text: '功率因素(%)'
                //text: '  '
              },
              labels: {
                formatter: function () {
                  return this.value;
                }
              }
            },
            tooltip: {
              crosshairs: true,
              shared: true
            },
            credits: {
              enabled: false
            },
            plotOptions: {
              spline: {
                marker: {
                  radius: 4,
                  lineColor: '#666666',
                  lineWidth: 1
                }
              }
            },
            series: []

           }

        }
    },
        methods: {
      onParamChange (attr, val) {
          this.itemStatus = val.value;

          this.$refs.lineCharts.removeSeries();

          var title = '';
          let lineCharts = this.$refs.lineCharts;
          if(this.itemStatus == 0){
              title = '功率因素';
              lineCharts.getChart().title.update({ text: '功率因素' });
              lineCharts.getChart().yAxis[0].setTitle({text:'功率因素(%)'});
              if(this.itemType == 0){
                 lineCharts.addSeries({name: '功率因素',data: []});
              }else if(this.itemType == 1){
                 lineCharts.addSeries({name: '总功率因素',data: []});
                 lineCharts.addSeries({name: 'A相率因素',data: []});
                 lineCharts.addSeries({name: 'B相率因素',data: []});
                 lineCharts.addSeries({name: 'C相率因素',data: []});
              }

          }else if(this.itemStatus == 1){
              title = '电流';
              lineCharts.getChart().title.update({ text: '电流' });
              lineCharts.getChart().yAxis[0].setTitle({text:'电流(A)'});
              if(this.itemType == 0){
                 lineCharts.addSeries({name: '电流',data: []});
              }else if(this.itemType == 1){
                 lineCharts.addSeries({name: 'Ia 相电流',data: []});
                 lineCharts.addSeries({name: 'Ib 相电流',data: []});
                 lineCharts.addSeries({name: 'Ic 相电流',data: []});
                 lineCharts.addSeries({name: '零序电流',data: []});
              }
          }else if(this.itemStatus == 2){
              title = '电压';
              lineCharts.getChart().title.update({ text: '电压' });
              lineCharts.getChart().yAxis[0].setTitle({text:'电压(V)'});
              if(this.itemType == 0){
                 lineCharts.addSeries({name: '电压',data: []});
              }else if(this.itemType == 1){
                 lineCharts.addSeries({name: 'A相电压',data: []});
                 lineCharts.addSeries({name: 'B相电压',data: []});
                 lineCharts.addSeries({name: 'C相电压',data: []});
              }
          }else if(this.itemStatus == 3){
              title = '有功功率';
              lineCharts.getChart().title.update({ text: '有功功率' });
              lineCharts.getChart().yAxis[0].setTitle({text:'有功功率(KVA)'});
              if(this.itemType == 0){
                 lineCharts.addSeries({name: '有功功率',data: []});
              }else if(this.itemType == 1){
                 lineCharts.addSeries({name: '总有功功率',data: []});
                 lineCharts.addSeries({name: 'A相有功功率',data: []});
                 lineCharts.addSeries({name: 'B相有功功率',data: []});
                 lineCharts.addSeries({name: 'C相有功功率',data: []});
              }
          }else if(this.itemStatus == 4){
              title = '无功功率';
              lineCharts.getChart().title.update({ text: '无功功率' });
              lineCharts.getChart().yAxis[0].setTitle({text:'有功功率(KVA)'});
              if(this.itemType == 0){
                 lineCharts.addSeries({name: '无功功率',data: []});
              }else if(this.itemType == 1){
                 lineCharts.addSeries({name: '总无功功率',data: []});
                 lineCharts.addSeries({name: 'A相无功功率',data: []});
                 lineCharts.addSeries({name: 'B相无功功率',data: []});
                 lineCharts.addSeries({name: 'C相无功功率',data: []});
              }
          }else if(this.itemStatus == 5){
              title = '视在功率';
              lineCharts.getChart().title.update({ text: '视在功率' });
              lineCharts.getChart().yAxis[0].setTitle({text:'视在功率(KVA)'});
              if(this.itemType == 0){
                 lineCharts.addSeries({name: '视在功率',data: []});
              }else if(this.itemType == 1){
                 lineCharts.addSeries({name: 'A相视在功率',data: []});
                 lineCharts.addSeries({name: 'B相视在功率',data: []});
                 lineCharts.addSeries({name: 'C相视在功率',data: []});
                 lineCharts.addSeries({name: '总视在功率',data: []});
              }
          }else if(this.itemStatus == 6){
              title = '总有功电量';
              lineCharts.getChart().title.update({ text: '总有功电量' });
              lineCharts.getChart().yAxis[0].setTitle({text:'总有功电量(KWH)'});
              lineCharts.addSeries({name: '总有功电量',data: []});
          }

      },
      routerBack(){
         this.$router.go(-1);

         clearInterval(this.setIntervalNum);
      },
      getList(){
          var title = '';
          let lineCharts = this.$refs.lineCharts;

          if(this.itemStatus == 0){
              title = '功率因素';
              lineCharts.getChart().title.update({ text: '功率因素' });
              lineCharts.getChart().yAxis[0].setTitle({text:'功率因素(%)'});
              if(this.itemType == 0){
                 lineCharts.addSeries({name: '功率因素',data: []});
              }else if(this.itemType == 1){
                 lineCharts.addSeries({name: '总功率因素',data: []});
                 lineCharts.addSeries({name: 'A相率因素',data: []});
                 lineCharts.addSeries({name: 'B相率因素',data: []});
                 lineCharts.addSeries({name: 'C相率因素',data: []});
              }
          }

          this.setIntervalNum = setInterval(this.getRealTime,1000 * 60)

      },
      getRealTime(){
          this.$http.post(this.URLINFO + '/mobile/getRealTransInfo.do',{})
          .then(function (res) {
                    //获取图表上曲线点的数量,如果数量大于10,flag为true
                    var itemData = lineCharts.getChart().series[0].data;
                    var flag = false;
                    if(itemData.length >= 10){
                         flag = true;
                    }


                    //添加一个点(flag为false,表示新增一个点的同时不移除最前面的数据点,如果flag为true,表示新增一个点的同时移除最前面的数据点)
                    lineCharts.getChart().series[0].addPoint([res.data.num1,res.data.num2],false,flag);
                   lineCharts.getChart().redraw();
          })
          .catch(function (error) {
               this.$toast('查询监测点实时数据异常');
          });

      }
        },
        components: {
            vchooser,
      VueHighcharts
        },
    mounted () {

      this.getList()
    }

    }

  function getCurrentTime(){
    var date = new Date();
    var hour = date.getHours() < 10 ? "0" + date.getHours() : date.getHours();
    var minute = date.getMinutes() < 10 ? "0" + date.getMinutes() : date.getMinutes();
    var second = date.getSeconds() < 10 ? "0" + date.getSeconds() : date.getSeconds();
    return hour + ':' + minute + ':' + second;
  }

script>

<style>
*{margin:0;padding:0;  list-style:none }
h1,h2,h3,h4,h5,h6{font-size:16px; font-weight:normal;}

.rank-head{
     width: 100%;
     height: 40px;
     position:fixed;
     background: -webkit-linear-gradient(top,rgba(0,0,0,.6),rgba(0,0,0,0));
     z-index: 999;
     color: #fff;
     font-size: 16px;
     text-align: center;
     line-height: 40px;
}

.container{
     width: 100%;
     overflow: hidden }

.rank-head-back{
     display: block;
     float: left;
     width: 40px;
     height: 40px;
     background: url("../assets/index/back.png") no-repeat center center;
     background-size: 100% 100%;
}


style>
3、java后台代码如下:
@ResponseBody
    @RequestMapping("/getRealTransInfo")
    public Map<String,Object> getRealTransInfo(HttpServletRequest request,HttpServletResponse response){
        Map<String,Object> map = new HashMap<String,Object>();
        int max=20;
        int min=10;
        Random random = new Random();

        int num1 = random.nextInt(max)%(max-min+1) + min;
        int num2 = random.nextInt(max)%(max-min+1) + min;

        map.put("num1", num1);
        map.put("num2", num2);
        return map;
    }