小程序echarts 自定义tooltip提示框及显示隐藏兼容苹果iOS
mpvue-echarts地址: https://github.com/F-loat/mpvue-echarts
装包 :
npm install -D sass-loader node-sass
npm install --save echarts
npm i mpvue-echarts --save
官方示例代码:
<template>
  <div class="echarts-wrap">
    <mpvue-echarts :echarts="echarts" :onInit="onInit" canvasId="demo-canvas" />
  </div>
</template>

<script>
import echarts from 'echarts'
import mpvueEcharts from 'mpvue-echarts'

let chart = null;
export default {
  components: {
    mpvueEcharts
  },
  data () {
    return {
      echarts,
      onInit: this.initChart
    }
  },
  methods: {
    initChart (canvas, width, height) {
      chart = echarts.init(canvas, null, {
        width: width,
        height: height
      });
      canvas.setChart(chart);

      var option = {
        title: {
          text: '折线图堆叠'
        },
        tooltip: {
          trigger: 'axis'
        },
        legend: {
          data: ['邮件营销', '联盟广告', '视频广告', '直接访问', '搜索引擎']
        },
        grid: {
          left: '3%',
          right: '4%',
          bottom: '3%',
          containLabel: true
        },
        toolbox: {
          feature: {
            saveAsImage: {}
          }
        },
        xAxis: {
          type: 'category',
          boundaryGap: false,
          data: ['周一', '周二', '周三', '周四', '周五', '周六', '周日']
        },
        yAxis: {
          type: 'value'
        },
        series: [
          {
            name: '邮件营销',
            type: 'line',
            stack: '总量',
            data: [120, 132, 101, 134, 90, 230, 210]
          },
          {
            name: '联盟广告',
            type: 'line',
            stack: '总量',
            data: [220, 182, 191, 234, 290, 330, 310]
          },
          {
            name: '视频广告',
            type: 'line',
            stack: '总量',
            data: [150, 232, 201, 154, 190, 330, 410]
          },
          {
            name: '直接访问',
            type: 'line',
            stack: '总量',
            data: [320, 332, 301, 334, 390, 330, 320]
          },
          {
            name: '搜索引擎',
            type: 'line',
            stack: '总量',
            data: [820, 932, 901, 934, 1290, 1330, 1320]
          }
        ]
      };
      chart.setOption(option);
      return chart; // 返回 chart 后可以自动绑定触摸操作
    }
  },
}

</script>

<style scoped>
.echarts-wrap {
  width: 100%;
  height: 300px;
}
</style>
效果图:

样式问题看官方文档修改
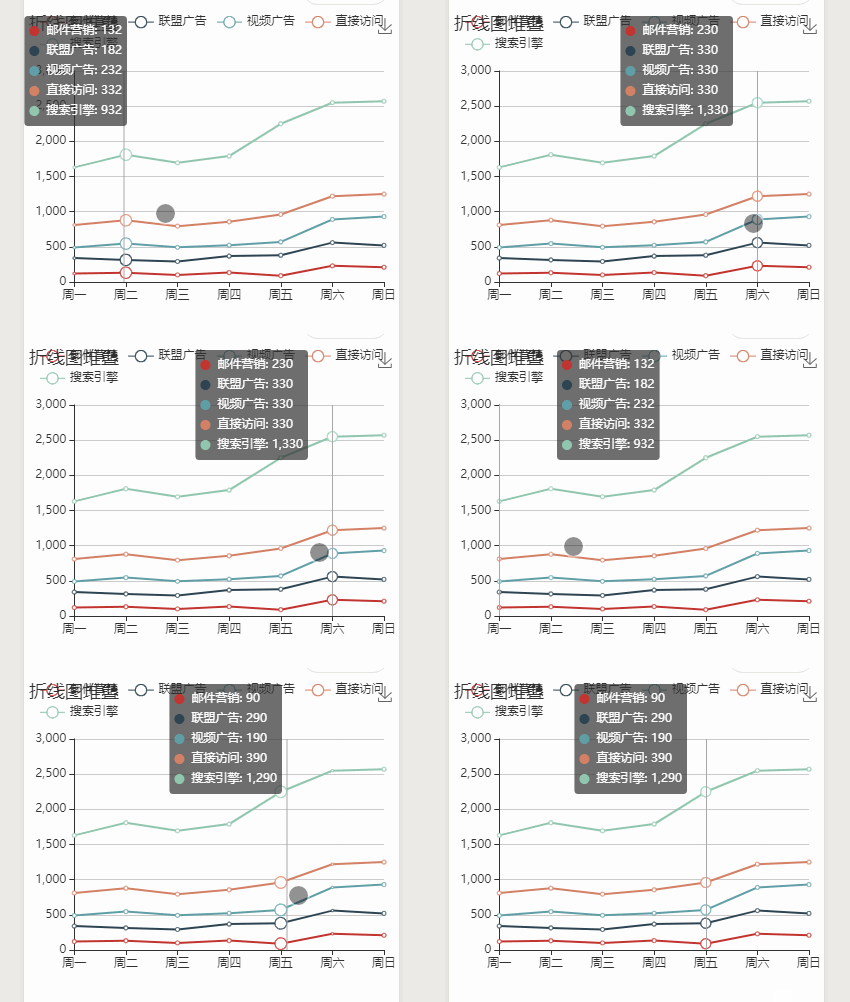
在小程序上会发现tooltip提示框不消失,而且会超出屏幕
1,首先解决超出屏幕问题,修改tooltip样式为:
      tooltip: {
          trigger: 'axis',
          position: function (point, params, dom, rect, size) {
            var x = 0; // x坐标位置
            var y = 5; // y坐标位置
            // 当前鼠标位置
            var pointX = point[0];
            var pointY = point[1];
            var boxWidth = size.contentSize[0];
            var boxHeight = size.contentSize[1];
            if (boxWidth > pointX) {
              x = pointX + 20;
            } else {
              x = pointX - boxWidth - 20;
            }
            return [x, y];
          },
        },
效果如图:这里y轴已写死,可以根据需要修改
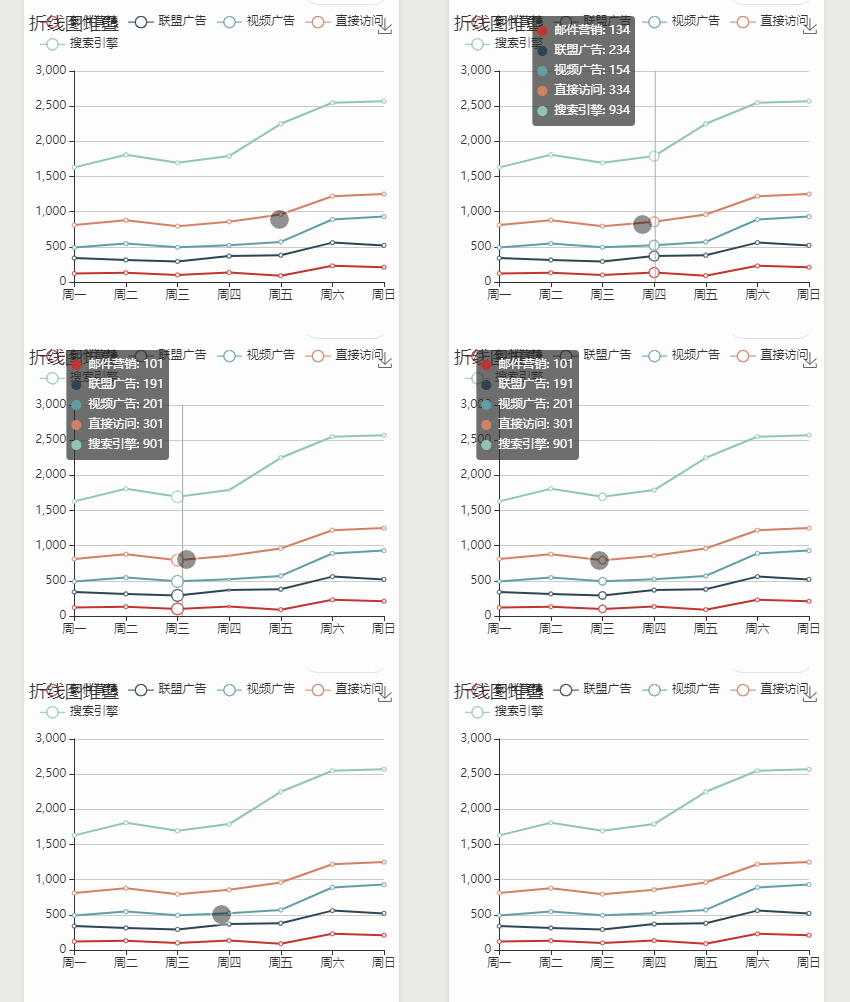
2,tooltip提示框在小程序中不会自动消失隐藏,那么就必须手动让它隐藏,就需要获取图表上的触摸事件,
touchend事件可以获取到屏幕上的触摸事件,可是在苹果手机上触发了图表后touchend就不生效了,所以必须直接拿到图表上的触控事件,同时顺便把那条竖线指示标记隐藏,代码如下
  chart.getZr().on('mouseup', function (e) {
        chart.dispatchAction({
          type: 'hideTip'//隐藏tooltip
        })
        chart.dispatchAction({
          type: 'updateAxisPointer',
          currTrigger: 'leave'//隐藏竖线指示器
        })
      })
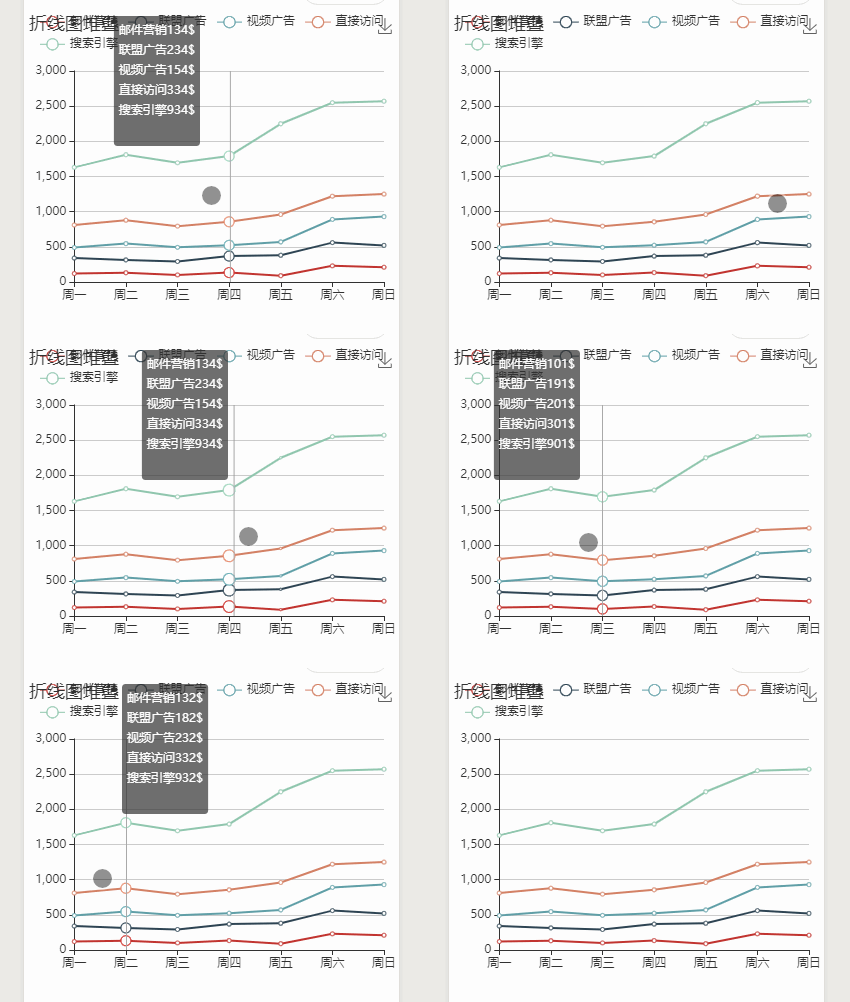
3,然后就是tooltip提示框自定义的问题,当从新定义了提示框内容后,小圆点就会消失,而且官方似乎是没有给出解决方法的,下面在tooptip里边用formatter随便自定义几个看看效果:
 tooltip: {
          trigger: 'axis',
          position: function (point, params, dom, rect, size) {
            var x = 0; // x坐标位置
            var y = 5; // y坐标位置
            // 当前鼠标位置
            var pointX = point[0];
            var pointY = point[1];
            var boxWidth = size.contentSize[0];
            var boxHeight = size.contentSize[1];
            if (boxWidth > pointX) {
              x = pointX + 20;
            } else {
              x = pointX - boxWidth - 20;
            }
            return [x, y];
          },
          formatter: function (params) {
            var arr = ''
            params.forEach((item) => {
              arr += item.seriesName + (item.data)+'$' + "\n"
            })
            return arr
          }
        },
4,没有小圆点肯定是不行的,所以只能自己写一个tooltip框出来,那上边所写的tooltip的代码就不能用了,变动代码如下
<template>
  <div class="echarts-wrap">
    <mpvue-echarts :echarts="echarts" :onInit="onInit" canvasId="demo-canvas" />

    <cover-view v-if="tooltip.length" class="tooltipContainer">
      <block v-for="(item, index) in tooltip" :key="index">
        <cover-view class="center tooltip">
          <cover-view v-if="item.color" class="color" :style="{backgroundColor: item.color}">cover-view>
          <cover-view v-if="item.name">{{item.name}}: cover-view>
          <cover-view>{{item.value}}cover-view>
        cover-view>
      block>
    cover-view>
  div>
template>
 data () {
    return {
      echarts,
      onInit: this.initChart,
      tooltip: []//自定变量
    }
  },
 tooltip: {
          trigger: 'axis',
          position: [0,'-1000%',0,0],//将原来的提示框移出页面,避免出现个黑点
          formatter: params => {
            let arr = [];
            arr.push({
              color: "",
              name: "",
              value: params[0].axisValue
            });
            params.forEach(function (item) {
              let obj = {
                color: item.color,
                name: item.seriesName,

                value: item.value + '%'
              };
              arr.push(obj);
            });
            this.tooltip = arr;//存入自定变量tooltip
            return "";//将原来的提示框清空
          }
        },
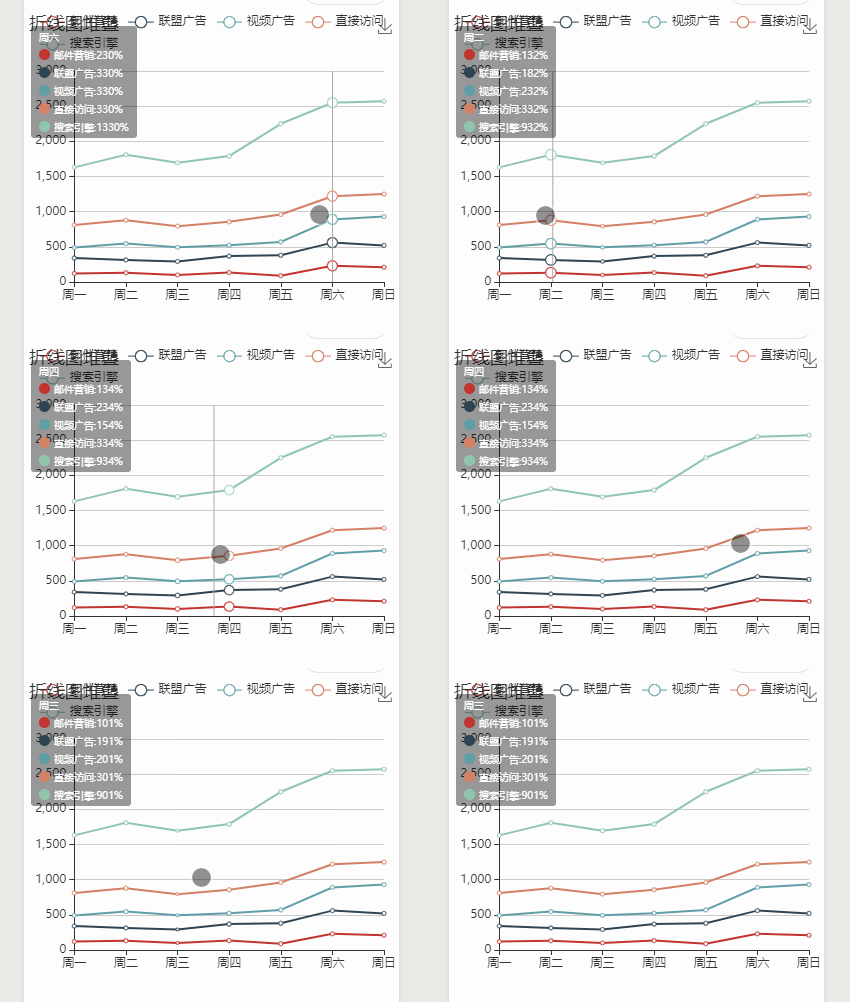
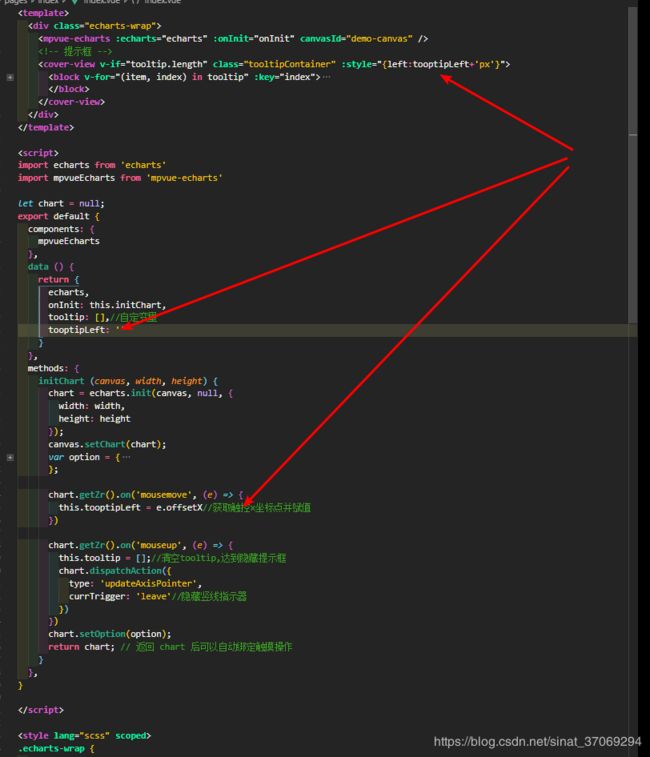
5,自定义效果出来了,剩下的就是让提示框跟随触摸移动并隐藏,那就必须要获取到图表上的xy轴坐标点,动态赋值给提示框,这样又比较耗性能,但没有想到更好的办法,触摸结束后清空tooltip变量就可以隐藏

6,但是依然会超出屏幕,需要获取图表父盒子的宽度进行判断
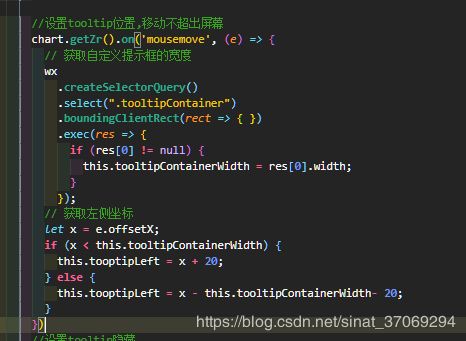
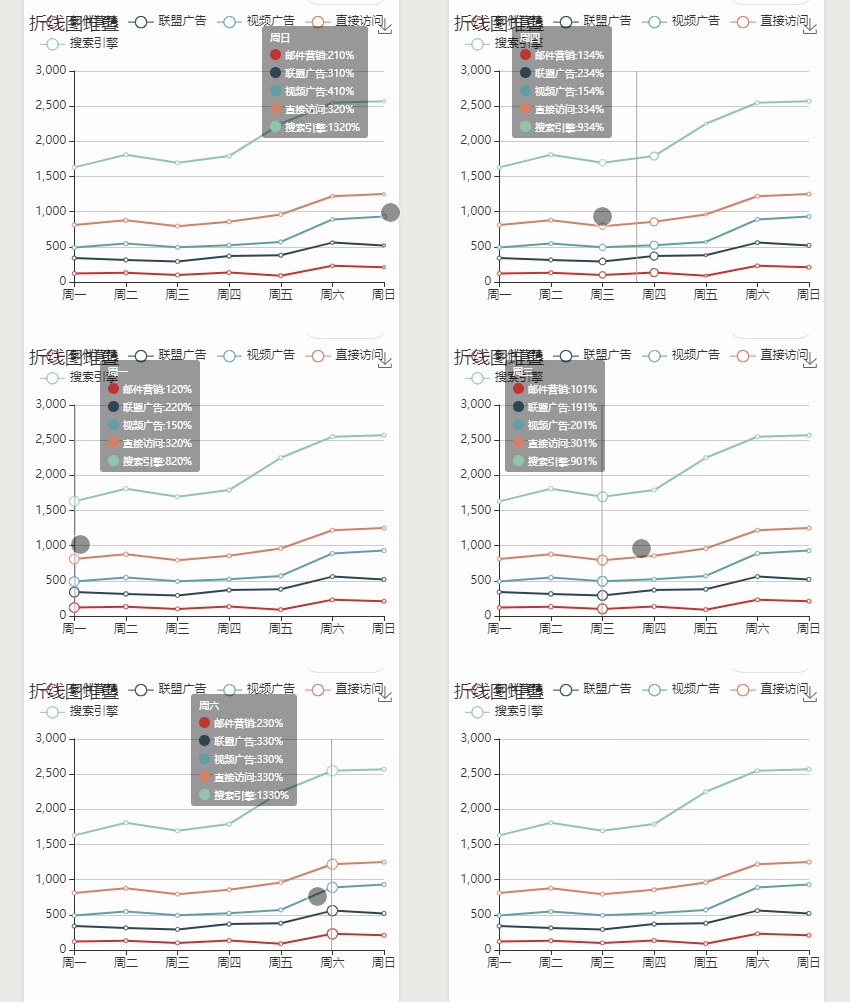
8…完成,附上完整代码
<template>
  <div class="echarts-wrap">
    <mpvue-echarts :echarts="echarts" :onInit="onInit" canvasId="demo-canvas" />
    <!-- 提示框 -->
    <cover-view v-if="tooltip.length" class="tooltipContainer" :style="{left:tooptipLeft+'px'}">
      <block v-for="(item, index) in tooltip" :key="index">
        <cover-view class="center tooltip">
          <cover-view v-if="item.color" class="color" :style="{backgroundColor: item.color}"></cover-view>
          <cover-view v-if="item.name">{{item.name}}: </cover-view>
          <cover-view>{{item.value}}</cover-view>
        </cover-view>
      </block>
    </cover-view>
  </div>
</template>

<script>
import echarts from 'echarts'
import mpvueEcharts from 'mpvue-echarts'

let chart = null;
export default {
  components: {
    mpvueEcharts
  },
  data () {
    return {
      echarts,
      onInit: this.initChart,
      tooltip: [],//自定变量
      tooptipLeft: '',
      tooltipContainerWidth:''
    }
  },
  methods: {
    initChart (canvas, width, height) {
      chart = echarts.init(canvas, null, {
        width: width,
        height: height
      });
      canvas.setChart(chart);
      var option = {
        title: {
          text: '折线图堆叠'
        },
        tooltip: {
          trigger: 'axis',
          position: [0, '-1000%', 0, 0],
          formatter: params => {
            let arr = [];
            arr.push({
              color: "",
              name: "",
              value: params[0].axisValue
            });
            params.forEach(function (item) {
              let obj = {
                color: item.color,
                name: item.seriesName,

                value: item.value + '%'
              };
              arr.push(obj);
            });
            this.tooltip = arr;//存入自定变量tooltip
            return "";//将原来的提示框清空
          }
        },
        legend: {
          data: ['邮件营销', '联盟广告', '视频广告', '直接访问', '搜索引擎']
        },
        grid: {
          left: '3%',
          right: '4%',
          bottom: '3%',
          containLabel: true
        },
        toolbox: {
          feature: {
            saveAsImage: {}
          }
        },
        xAxis: {
          type: 'category',
          boundaryGap: false,
          data: ['周一', '周二', '周三', '周四', '周五', '周六', '周日']
        },
        yAxis: {
          type: 'value'
        },
        series: [
          {
            name: '邮件营销',
            type: 'line',
            stack: '总量',
            data: [120, 132, 101, 134, 90, 230, 210]
          },
          {
            name: '联盟广告',
            type: 'line',
            stack: '总量',
            data: [220, 182, 191, 234, 290, 330, 310]
          },
          {
            name: '视频广告',
            type: 'line',
            stack: '总量',
            data: [150, 232, 201, 154, 190, 330, 410]
          },
          {
            name: '直接访问',
            type: 'line',
            stack: '总量',
            data: [320, 332, 301, 334, 390, 330, 320]
          },
          {
            name: '搜索引擎',
            type: 'line',
            stack: '总量',
            data: [820, 932, 901, 934, 1290, 1330, 1320]
          }
        ]
      };

      //设置tooltip位置,移动不超出屏幕
      chart.getZr().on('mousemove', (e) => {
        // 获取自定义提示框的宽度
        wx
          .createSelectorQuery()
          .select(".tooltipContainer")
          .boundingClientRect(rect => { })
          .exec(res => {
            if (res[0] != null) {
              this.tooltipContainerWidth = res[0].width;
            }
          });
        // 获取左侧坐标
        let x = e.offsetX;
        if (x < this.tooltipContainerWidth) {
          this.tooptipLeft = x + 20;
        } else {
          this.tooptipLeft = x - this.tooltipContainerWidth- 20;
        }
      })
      //设置tooltip隐藏
      chart.getZr().on('mouseup', (e) => {
        this.tooltip = [];
        chart.dispatchAction({
          type: 'updateAxisPointer',
          currTrigger: 'leave'
        })
      })
      chart.setOption(option);
      return chart;
    }
  },
}

</script>

<style lang="scss" scoped>
.echarts-wrap {
  width: 100%;
  height: 300px;
  position: relative;
}
.tooltipContainer {
  z-index: 1000;
  background-color: rgba(0, 0, 0, 0.4);
  position: absolute;
  top: 30rpx;
  color: white;
  font-size: 20rpx;
  border-radius: 6rpx;
  .tooltip {
    display: flex;
    padding: 6rpx 16rpx;
    justify-content: flex-start;
    &:first-child {
      padding-top: 10rpx;
    }
    &:last-child {
      padding-bottom: 10rpx;
    }
    .color {
      margin-right: 8rpx;
      display: inline-block;
      height: 22rpx;
      width: 22rpx;
      border-radius: 50%;
      background-color: black;
    }
  }
}
</style>