freemap初学者教程_初学者的基本熊猫数据框教程
freemap初学者教程
In this Pandas tutorial we will learn how to work with Pandas dataframes. More specifically, we will learn how to read and write Excel (i.e., xlsx) and CSV files using Pandas.
在此Pandas教程中,我们将学习如何使用Pandas数据框。 更具体地说,我们将学习如何使用Pandas读写Excel(即xlsx)和CSV文件。
We will also learn how to add a column to Pandas dataframe object, and how to remove a column. Finally, we will also learn how to subset and group our dataframe.
我们还将学习如何向Pandas数据框对象添加列,以及如何删除列。 最后,我们还将学习如何对数据框进行子集和分组。
什么是熊猫数据框? (What is Pandas Dataframe?)
Pandas is a library for enabling data analysis in Python. It’s very easy to use and quite similar to the programming language R’s data frames. It’s open source and free.
Pandas是用于在Python中启用数据分析的库。 它非常易于使用,与编程语言R的数据帧非常相似。 它是开源的,免费的。
When working datasets from real experiments we need a method to group data of differing types. For instance, in psychology research we often use different data types. If you have experience in doing data analysis with SPSS you are probably familiar with some of them (e.g., categorical, ordinal, continuous).
在处理来自真实实验的数据集时,我们需要一种对不同类型的数据进行分组的方法。 例如,在心理学研究中,我们经常使用不同的数据类型。 如果您有使用SPSS进行数据分析的经验,那么您可能对其中的某些工具很熟悉(例如,分类,有序,连续)。
Imagine that we have collected data in an experiment in which we were interested in how images of kittens and puppies affected the mood in the subjects and compared it to neutral images.
想象一下,我们在一个实验中收集了数据,我们对小猫和小狗的图像如何影响受试者的情绪并将其与中性图像进行了比较感兴趣。
After each image, randomly presented on a computer screen, the subjects were to rate their mood on a scale.
在随机显示在计算机屏幕上的每幅图像之后,受试者将按比例对他们的情绪进行评分。
Then the data might look like this:
然后数据可能看起来像这样:
| Condition | 健康)状况 | Mood Rating | 情绪等级 | Subject Number | 主题编号 | Trial Number | 试用编号 |
| Puppy | 小狗 | 7 | 7 | 1 | 1个 | 1 | 1个 |
| Kitten | 小猫 | 6 | 6 | 1 | 1个 | 2 | 2 |
| Puppy | 小狗 | 7 | 7 | 1 | 1个 | 4 | 4 |
| Neutral | 中性 | 6 | 6 | 1 | 1个 | 5 | 5 |
| … | … | … | … | … | … | … | … |
| Puppy | 小狗 | 6 | 6 | 12 | 12 | 9 | 9 |
| Neutral | 中性 | 6 | 6 | 12 | 12 | 10 | 10 |
This is generally what a dataframe is. Obviously, working with Pandas dataframe will make working with our data easier. See here for more extensive information.
通常,这就是数据帧。 显然,使用Pandas数据框将使我们的数据更容易使用。 请参阅此处以获取更多详细信息。
熊猫创建数据框 (Pandas Create Dataframe)
In Psychology, the most common methods to collect data is using questionnaires, experiment software (e.g., PsychoPy, OpenSesame), and observations.
在心理学中,最常见的数据收集方法是使用问卷,实验软件(例如PsychoPy,OpenSesame)和观察。
When using digital applications for both questionnaires and experiment software we will, of course, also get our data in a digital file format (e.g., Excel spreadsheets and Comma-separated, CSV, files).
当将数字应用程序用于问卷和实验软件时,我们当然也会以数字文件格式(例如Excel电子表格和逗号分隔的CSV文件)获取数据。
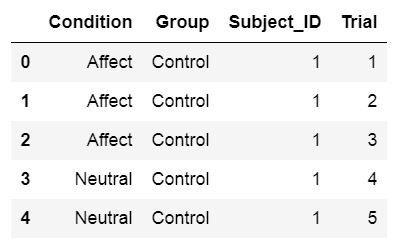
Pandas Dataframe 熊猫数据框If the dataset is quite small it is possible to create a dataframe directly using Python and Pandas:
如果数据集很小,则可以直接使用Python和Pandas创建数据框:
import pandas as pd

# Create some variables
trials = [1, 2, 3, 4, 5, 6]
subj_id = [1]*6
group = ['Control']*6
condition = ['Affect']*3 + ['Neutral']*3

# Create a dictionairy
data = {'Condition':condition, 'Subject_ID':subj_id,
        'Trial':trials, 'Group':group}

# Create the dataframe
df = pd.DataFrame(data)
df.head()
Crunching in data by hand when the datasets are large is, however, very time-consuming and nothing to recommend. Below you will learn how to read Excel Spreadsheets and CSV files in Python and Pandas.
但是,当数据集很大时,手工处理数据非常耗时,没有什么可推荐的。 您将在下面了解如何在Python和Pandas中读取Excel电子表格和CSV文件。
使用熊猫加载数据 (Loading Data Using Pandas)
As mentioned above, large dataframes are usually read into a dataframe from a file. Here we will learn how to u se Pandas read_excel and read_csv methods to load data into a dataframe. There are a lot of datasets available to practice working with Pandas dataframe. In the examples below we will use some of the R datasets that can be found here.
如上所述,通常将大数据帧从文件读入数据帧。 在这里,我们将学习如何使用熊猫的read_excel和read_csv方法将数据加载到数据框中。 有许多数据集可用于实践使用Pandas数据框。 在下面的示例中,我们将使用此处可以找到的一些R数据集。
使用Pandas处理Excel电子表格 (Working with Excel Spreadsheets Using Pandas)
Spreadsheets can quickly be loaded into a Pandas dataframe and you can, of course, also write a spreadsheet from a dataframe. This section will cover how to do this.
电子表格可以快速加载到Pandas数据框中,当然,您也可以从数据框中编写电子表格。 本节将介绍如何执行此操作。
使用熊猫读取Excel文件read_excel (Reading Excel Files Using Pandas read_excel)
One way to read a dataset into Python is using the method read_excel, which has many arguments.
将数据集读入Python的一种方法是使用read_excel方法,该方法具有许多参数。
pd.read_excel(io, sheet_name=0, header=0)
io is the Excel file containing the data. It should be type string data type and could be a locally stored file as well as a URL.
io是包含数据的Excel文件。 它应该是字符串数据类型,并且可以是本地存储的文件以及URL。
sheet_name can be a string for the specific sheet we want to load and integers for zero-indexed sheet positions. If we specify None all sheets are read into the dataframe.
sheet_name可以是我们要加载的特定工作表的字符串,也可以是零索引工作表位置的整数。 如果我们指定None,则所有工作表都被读入数据框。
header can be an integer or a list of integers. The default is 0 and the integer represent the row where the column names. Add None if you don’t have column names in your Excel file.
标头可以是整数,也可以是整数列表。 默认值为0,并且整数表示行所在的列名称。 如果Excel文件中没有列名,则不添加任何内容。
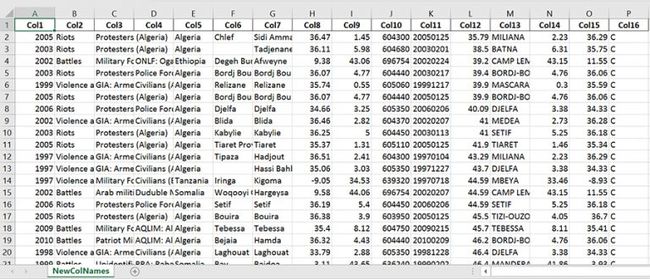
Excel File Written with to_excel 用to_excel编写的Excel文件See the read_excel documentation if you want to learn about the other arguments.
如果您想了解其他参数,请参见read_excel文档 。
熊猫阅读Excel示例 (Pandas Read Excel Example)
Here’s a working example on how to use Pandas read_excel:
这是一个有关如何使用熊猫read_excel的工作示例:
import pandas as pd

# Load a XLSX file from a URL
xlsx_source = 'http://ww2.amstat.org/publications'
              '/jse/v20n3/delzell/conflictdata.xlsx'
# Reading the excel file to a dataframe.
# Note, there's only one sheet in the example file
df = pd.read_excel(xlsx_source, sheet_name='conflictdata')
df.head()
In the example above we are reading an Excel file (‘conflictdata.xlsx’). The dataset have only one sheet but for clarity we added the ‘conflictdata’ sheet name as an argument. That is, sheet_name was, in this case, nothing we needed to use.
在上面的示例中,我们正在读取一个Excel文件('conflictdata.xlsx')。 数据集只有一个工作表,但为清楚起见,我们添加了“ conflictdata”工作表名称作为参数。 也就是说,在这种情况下,sheet_name不需要我们使用。
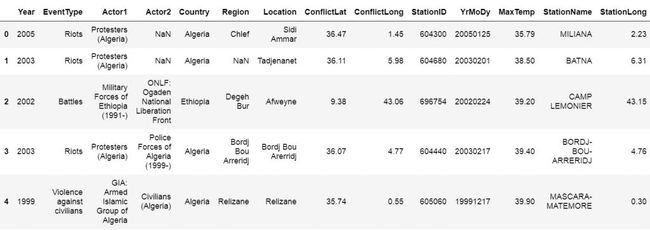
The last line may be familiar to R users and is printing the first X lines of the dataframe:
R用户可能熟悉最后一行,并且正在打印数据帧的前X行:
First 5 rows from an Excel file loaded into a Pandas dataframe 将Excel文件的前5行加载到Pandas数据框中As you may have noticed we did not use the header argument when we read the Excel file above. If we set header to None we’ll get digits as column names. This, unfortunately, makes working with the Pandas dataframe a bit annoying.
您可能已经注意到,当我们阅读上面的Excel文件时,我们没有使用header参数。 如果将header设置为None,则将获得数字作为列名。 不幸的是,这使使用Pandas数据框有点烦人。
Luckily, we can pass a list of column names as an argument. Finally, as the example xlsx file contains column names we skip the first row using skiprows. Note, skiprows can be used to skip more than one row. Just add a list with the row numbers that are to be skipped.
幸运的是,我们可以将列名列表作为参数传递。 最后,由于示例xlsx文件包含列名,因此我们使用跳过行跳过了第一行。 请注意,可使用跳过行跳过多于一行。 只需添加一个列表,其中包含要跳过的行号。
Here’s another example how to read Excel using Python Pandas:
这是另一个使用Python Pandas读取Excel的示例:
import pandas as pd

xlsx_source = 'http://ww2.amstat.org/publications'
              '/jse/v20n3/delzell/conflictdata.xlsx'

# Creating a list of column names
col_names = ['Col' + str(i) for i in range (1, 17)]

# Reading the excel file
df = pd.read_excel(xlsx_source, sheet_name='conflictdata',
                   header=None, names=col_names, skiprows=[0])
df.head()
使用Pandas to_excel编写Excel文件 (Writing Excel Files Using Pandas to_excel)
We can also save a new xlsx (or overwrite the old, if we like) using Pandas to_excel method. For instance, say we made some changes to the data (e.g., aggregated data, changed the names of factors or columns) and we collaborate with other researchers. Now we don’t want to send them the old Excel file.
我们还可以使用Pandas to_excel方法保存一个新的xlsx(或覆盖旧的xlsx)。 例如,假设我们对数据进行了一些更改(例如,汇总数据,更改了因子或列的名称),并且我们与其他研究人员进行了合作。 现在,我们不想将旧的Excel文件发送给他们。
df.to_excel(excel_writer, sheet_name='Sheet1', index=False)
excel_writer can be a string (your file name) or an ExcelWriter object.
excel_writer可以是字符串(您的文件名)或ExcelWriter对象。
sheet_name should be a string with the sheet name. Default is ‘Sheet1’.
sheet_name应该是带有工作表名称的字符串。 默认值为“ Sheet1”。
index should be a boolean (i.e., True or False). Typically, we don’t want to write a new column with numbers. Default is True.
index应该是布尔值(即True或False)。 通常,我们不想用数字写新列。 默认值为True。
熊猫数据框到Excel的示例: (Pandas dataframe to Excel example:)
df.to_excel('newfilename.xlsx', sheet_name='NewColNames', index=False)
It was pretty simple now have written a new Excel file (xlsx) to the same directory as your Python script.
现在,将新的Excel文件(xlsx)写入与Python脚本相同的目录非常简单。
使用熊猫处理CSV文件 (Working with CSV Files Using Pandas)
Now we continue to a more common way to store data, at least in Psychology research; CSV files. We will learn how to use Python Pandas to load CSV files into dataframes.
现在,至少在心理学研究中,我们继续采用一种更为通用的存储数据的方式。 CSV文件。 我们将学习如何使用Python Pandas将CSV文件加载到数据框中。
pd.read_csv(filepath_or_buffer, sep=',')
file_path_buffer is the name of the file to be read from. The file_path_buffer can be relative to the directory that your Python script is in or absolute. It can also be a URL. What is important here that what we type in first is a string. Don’t worry we will go through this later with an example.
file_path_buffer是要读取的文件的名称。 file_path_buffer可以相对于Python脚本所在的目录,也可以是绝对目录。 也可以是URL。 重要的是,我们首先输入的是字符串。 不用担心,我们稍后将通过示例进行介绍。
sep is the delimiter to use. The most common delimiter of a CSV file is comma (“,”) and it’s what delimits the columns in the CSV file. If you don’t know you may try to set it to None as the Python parsing engine will detect the delimiter.
sep是要使用的分隔符。 CSV文件最常见的定界符是逗号(“,”),它是CSV文件中各列的定界符。 如果您不知道,则可以尝试将其设置为None,因为Python解析引擎会检测到分隔符。
Have a look at the if you want to learn about the other arguments.
如果您想了解其他参数,请看一下。
()
It’s easy to read a csv file in Python Pandas. Here’s a working example on how to use Pandas read_csv:
在Python Pandas中读取csv文件很容易。 这是一个有关如何使用熊猫read_csv的工作示例:
import pandas as pd

df = pd.read_csv('https://vincentarelbundock.github.io/'
                 'Rdatasets/csv/psych/Tucker.csv', sep=',')
df.head()
使用Pandas to_csv写入CSV文件 (Writing CSV Files Using Pandas to_csv)
There are of course occasions when you may want to save your dataframe to csv. This is, of course, also possible with Pandas. We just use the Pandas dataframe to_csv method:
当然,有时您可能需要将数据帧保存到csv。 当然,熊猫也可以做到这一点。 我们只使用Pandas数据框to_csv方法:
df.to_csv(path_or_buf, sep=',', index=False)
Pandas Dataframe转CSV示例: (Pandas Dataframe to CSV Example:)
df.to_csv('newfilename.csv', sep=';', index=False)
It was simple to export Pandas dataframe to a CSV file, right? Note, we used semicolon as separator. In some countries (e.g., Sweden) comma is used as decimal separator. Thus, this file can now be opened using Excel if we ever want to do that.
将Pandas数据框导出到CSV文件很简单,对吧? 注意,我们使用分号作为分隔符。 在某些国家/地区(例如,瑞典),逗号用作小数点分隔符。 因此,如果我们愿意,现在可以使用Excel打开该文件。
Here’s a video tutorial for reading and writing csv files using Pandas:
这是一个使用Pandas读取和写入csv文件的视频教程:
Now we have learned how to read and write Excel and CSV files using Pandas read_excel, to_excel, and read_csv, to_csv methods. The next section of this Pandas tutorial will continue with how to work with Pandas dataframe.
现在,我们已经学习了如何使用Pandas的read_excel,to_excel和read_csv,to_csv方法读取和写入Excel和CSV文件。 本熊猫教程的下一部分将继续介绍如何使用熊猫数据框。
使用熊猫数据框 (Working with Pandas Dataframe)
Now that we know how to read and write Excel and CSV files using Python and Pandas we continue with working with Pandas Dataframes. We start off with basics: head and tail.
现在,我们知道了如何使用Python和Pandas读写Excel和CSV文件,我们将继续使用Pandas Dataframes。 我们从基础开始:头和尾。
head enables us to print the first x rows. As earlier explained, by default we see the first 5 rows but. We can, of course, have a look more or less rows:
head使我们能够打印前x行。 如前所述,默认情况下,我们看到前5行。 我们当然可以查看更多或更少的行:
import pandas as pd

df = pd.read_csv('https://vincentarelbundock.github.io/'
'Rdatasets/csv/carData/Wong.csv', sep=',')
df.head(4)
Using tail, on the other hand, will print the x last rows of the dataframe:
另一方面,使用tail ,将打印数据帧的最后x行:
df.tail(4)
Each column or variable, in a Pandas dataframe has a unique name. We can extract variables by means of the dataframe name, and the column name. This can be done using the dot sign:
Pandas数据框中的每个列或变量都有一个唯一的名称。 我们可以通过数据框名称和列名称来提取变量。 可以使用点号完成此操作:
piq = df.piq
piq[0:4]
We can also use the [ ] notation to extract columns. For example, df.piq and df[‘piq’] is equal:
我们还可以使用[]表示法提取列。 例如,df.piq和df ['piq']等于:
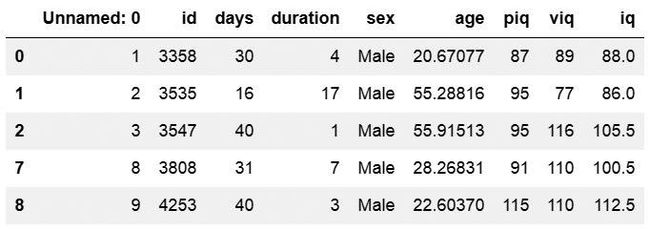
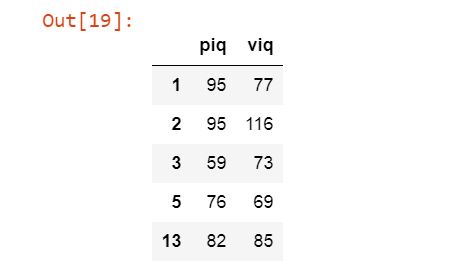
df.piq is the same as df[‘piq’] df.piq与df ['piq']相同Furthermore, if we pass a list we can select more than one of the variables in a dataframe. For example, we get the two columns “piq” and “viq” ([‘piq’, ‘viq’] ) as a dataframe like this:
此外,如果我们通过列表,则可以在数据框中选择多个变量。 例如,我们将两列“ piq”和“ viq”(['piq','viq'])作为数据框,如下所示:
pviq = df[['piq', 'viq']]
如何在Pandas Dataframe中添加列 (How to Add a Column to Pandas Dataframe)
We can also create a new variable within a Pandas dataframe, by naming it and assigning it a value. For instance, in the dataset we working here we have two variables “piq” (imathematical IQ) and “viq” (verbal IQ). We may want to calculate a mean IQ score by adding “piq” and “viq” together and then divide it by 2.
我们也可以通过在Pandas数据框中命名并为其分配值来创建一个新变量。 例如,在我们这里工作的数据集中,我们有两个变量“ piq”(数学智商)和“ viq”(语言智商)。 我们可能想通过将“ piq”和“ viq”加在一起然后除以2来计算平均IQ得分。
We can calculate this and add it to the df dataframe quite easy:
我们可以很容易地计算出它并将其添加到df数据框中:
df['iq'] = (df['piq'] + df['viq'])/2
Alternatevily, we can calculate this using the method mean(). Here we use the argument axis = 1 so that we get the row means:
或者,我们可以使用方法mean()进行计算。 在这里,我们使用参数axis = 1,以便获得行均值:
df['iq'] = df[['piq', 'viq']].mean(axis=1)
Sometimes we may want to just add a column to a dataframe without doing any calculation. It’s done in a similar way:
有时我们可能只想在数据框中添加一列而不进行任何计算。 可以通过类似的方式完成:
df['NewCol'] = ''
从数据框中删除列 (Remove Columns From a Dataframe)
Other times we may also want to drop columns from a Pandas dataframe. For instance, the column in df that is named ‘Unnamed: 0’ is quite unnecessary to keep.
其他时候,我们可能还想从Pandas数据框中删除列。 例如,在df中名为“未命名:0”的列是完全没有必要保留的。
Removing columns can be done using drop. In this example we are going to add a list to drop the ‘NewCol’ and the ‘Unnamed: 0’ columns. If we only want to remove one column from the Pandas dataframe we’d input a string (e.g., ‘NewCol’).
可以使用drop删除列。 在此示例中,我们将添加一个列表以删除“ NewCol”和“ Unnamed:0”列。 如果我们只想从Pandas数据框中删除一列,则需要输入一个字符串(例如'NewCol')。
df.drop(['NewCol', 'Unnamed: 0'], axis=1, inplace=True)
Note to drop columns, and not rows, the axis argument is set to 1 and to make the changes to the dataframe we set inplace to True.
注意要删除列而不是行,将axis参数设置为1并更改我们就地设置为True的数据框。
The above calculations are great examples for when you may want to save your dataframe as a CSV file.
以上计算是当您可能希望将数据框另存为CSV文件时的绝佳示例。
- If you need to reverse the order of your dataframe check my post Six Ways to Reverse Pandas Dataframe
- 如果您需要反转数据框的顺序,请查看我的文章“ 反转熊猫数据框的六种方法”
如何子集熊猫数据框 (How to Subset Pandas Dataframe)
There are many methods for selecting rows of a dataframe. One simple method is by using query. This method is similar to the function subset in R.
有很多方法可以选择数据帧的行。 一种简单的方法是使用查询。 此方法类似于R中的函数子集。
Here’s an exemple in which we subset the dataframe where “piq” is greater than 80:
这是一个示例,其中我们对“ piq”大于80的数据帧进行了子集处理:
df_piq = df.query('piq > 80')
df_piq.head(4)
df_males = df[df['sex'] == 'Male']
The next subsetting example shows how to filter the dataframe with multiple criteria. In this case, we sellect observations from df where sex is male and iq is greater than 80. Note that the ampersand “&“in Pandas is the preferred AND operator.
下一个子集示例显示如何使用多个条件过滤数据框。 在这种情况下,我们从df出售观察结果,其中性别为男性且iq大于80。请注意,Pands中的&符是&首选。
df_male80 = df.query('iq > 80 & sex == "Male"')
It’s also possible to use the OR operator. In the following example, we filter Pandas dataframe based on rows that have a value of age greater than or equal to 40 or age less then 14. Furthermore, we we filter the dataframe by the columns ‘piq’ and ‘viq’.
也可以使用OR运算符。 在下面的示例中,我们根据年龄大于或等于40或小于14的年龄的行过滤Pandas数据帧。此外,我们通过“ piq”和“ viq”列过滤数据帧。
df.query('age >= 40 | age < 14')[['piq', 'viq']].head()
数据帧中的随机采样行 (Random Sampling Rows From a Dataframe)
Using the sample method it’s also possible to draw random samples of size n from the. In the example below we draw 25random samples (n=25) and get at subset of ten obsevations from the Pandas dataframe.
使用样本方法,还可以从中提取大小为n的随机样本。 在下面的示例中,我们绘制了25个随机样本(n = 25),并从Pandas数据框中获取了十个观测值的子集。
df_random = df.sample(n=25)
如何使用Pandas Dataframe对数据进行分组 (How to Group Data using Pandas Dataframe)
Now we have learned how to read Excel and CSV files to a Panda dataframe, how to add and remove columns, and subset the created dataframe.
现在,我们已经学习了如何将Excel和CSV文件读取到Panda数据框,如何添加和删除列以及对创建的数据框进行子集化。
Although subsets may come in handy there are no need for doing this when you want to look at specific groups in the data.
尽管子集可能会派上用场,但是当您要查看数据中的特定组时,则无需这样做。
Pandas have a method for grouping the data which can come in handy; groupby. Especially, if you want to summarize your data using Pandas.
熊猫提供了一种可以方便地对数据进行分组的方法。 通过...分组。 特别是,如果要使用Pandas汇总数据。
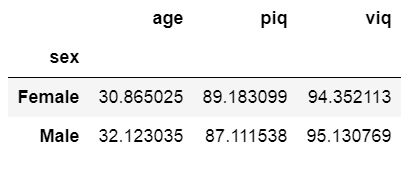
As an example, we can based on theory have a hypothesis that there’s a difference between men and women. Thus, in the first example we are going to group the data by sex and get the mean age, piq, and viq.
例如,我们可以基于理论有一个假设,即男女之间存在差异。 因此,在第一个示例中,我们将按性别对数据进行分组,并获得平均年龄,piq和viq。
df_sex = df.groupby('sex')
df_sex[['age', 'piq', 'viq']].mean()
If we were to fully test our hypothesis we would nened to apply hypothesisis testing. Here are two posts about carrying out between-subject analysis of variance using Python:
如果我们要完全检验我们的假设,我们就需要运用假设检验。 这是有关使用Python进行方差分析的两篇文章:
- Four ways to conduct one-way ANOVA with Python
- Three ways to do two-way ANOVA with Python
- 使用Python进行单向方差分析的四种方法
- 使用Python进行双向ANOVA的三种方法
In the next example we are going to use Pandas describe on our grouped dataframe. Using describe we will get a table with descriptive statistics (e.g., count, mean, standard deviation) of the added column ‘iq’.
在下一个示例中,我们将在分组数据帧上使用Pandas描述。 使用describe方法,我们将获得一个表,其中包含添加的列“ iq”的描述性统计信息(例如,计数,均值,标准差)。
df_sex[['iq']].describe()
More about summary statistics using Python and Pandas can be read in the post Descriptive Statistics using Python.
有关使用Python和Pandas进行摘要统计的更多信息,请参阅《 使用Python描述统计》一文 。
我们学到的总结 (Summary of What We’ve Learned)
- Working with CSV and Excel files using Pandas
- Pandas read_excel & to_excel
- Pandas read_csv & to_csv
- Working with Pandas Dataframe
- Add a column to a dataframe
- Remove a column from a dataframe
- Subsetting a dataframe
- Grouping a dataframe
- 使用Pandas处理CSV和Excel文件
- 熊猫read_excel和to_excel
- 熊猫read_csv和to_csv
- 使用熊猫数据框
- 向数据框添加一列
- 从数据框中删除列
- 子集数据框
- 分组数据框
There are, of course, may more things that we can do with Pandas dataframes. We usually want to explore our data with more descriptive statistics and visualizations. Make sure to check back here for more both more basic guides and in-depth guides on working with Pandas dataframe. These guides will include how to visualize data and how to carry out parametric statistics.
当然,我们可以使用Pandas数据框做更多的事情。 我们通常希望使用更具描述性的统计数据和可视化图表来探索数据。 请务必再次查看此处,以获取有关使用Pandas数据框的更多基本指南和深入指南。 这些指南将包括如何可视化数据以及如何进行参数统计。
Leave a comment below if you have any requests or suggestions on what should be covered next!
如果您对接下来应涵盖的内容有任何要求或建议,请在下面发表评论!
翻译自: https://www.pybloggers.com/2018/07/a-basic-pandas-dataframe-tutorial-for-beginners/
freemap初学者教程
