springcloud-dashboard、turbine监控hystrix的使用
在hystrx中将线程数目等设置完成后,可以通过Dashboard或者Turbine对其进行监控,在使用的使用一般会有1-2S的延迟,对于这两者的区别,Dashboard就是一个数据的展示面板,可以对单机的内容进行监控;而Turbine则是将多个相同的服务数据在Dashboard进行汇总展示,下图展示了turbine汇总数据的形式。

不管Dashboard还是Turbine都是作为独立的服务运行,首先说明dashboard,添加以下jar包,并在主类中加上@EnableHystrixDashboard,启用Hystrix Dashboard功能。
第二、Cluster和Host每秒的请求数目,其中Cluster代表集群中每秒的请求数,host代表单机的每秒请求数
第三、Pool Size代表程序中的线程数目,并一定代表最大的线程数
第四、executions 正在执行的线程数,这个数量是小于Pool Size的
第五、max active 的解释是hread count displays the rolling maximum number of active threads during a rolling statistical window。我的理解是超时回滚的线程数,这个数目和超时线程的数目应该是一致的
第六、Queue size 队列大小
使用turbine的时候,dashboard服务的所有服务都不需要改变,因为Turbine展示的数据还要在dashboard中展示,Turbine作为一个单独的服务需要添加以下jar包

在使用turbine监控数据的时候出现一个问题:两个相同的服务提供相同的接口,此时一个服务应该是另一个服务的复制,因此所设置的线程池的大小和队列的大小也应该是一致的,但是出现以下几种情况:
第一,线程数+队列数为偶数的情况,单个服务处理请求数目为(线程数*2+队列数)/2,而不是原来的线程数+队列数,总体处理能力也由是线程数*2+队列数,总体未验证
第二,线程数+队列数为偶数的情况,单个服务处理请求数目和不加turbine监控时候的处理能力一样,总体处理能力也由是线程数*2+队列数,总体未验证
这样服务本身因为添加了监控而导致服务本身的设置发生了变化,个人认为这是不应该的发生的情况,监控不应该对服务本身产生影响,这是我测试的结果,有什么不对的也请指出。
不管Dashboard还是Turbine都是作为独立的服务运行,首先说明dashboard,添加以下jar包,并在主类中加上@EnableHystrixDashboard,启用Hystrix Dashboard功能。
		org.springframework.cloud
		spring-cloud-starter-hystrix


		org.springframework.cloud
		spring-cloud-starter-hystrix-dashboard


		org.springframework.boot
		spring-boot-starter-actuator
	org.springframework.cloud
	spring-cloud-starter-hystrix


	org.springframework.boot
	spring-boot-starter-actuator
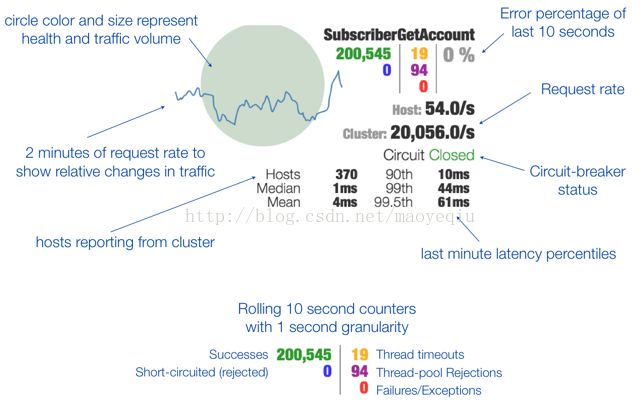
启动dashboard之后,在界面中添加http://localhost:8084/hystrix.stream,其中8084是被监控服务的端口,这样就可以在dashboard中监控服务的运行情况了,下图是监控单个服务的页面情况

上图中需要解释几个参数,这几个参数的大部分可以通过下图表现出来,这里重点说的是图中展示不全或解释不完全的。
private static String getStatsStringFromMetrics(HystrixCommandMetrics metrics) {
    StringBuilder m = new StringBuilder();
    if (metrics != null) {
        HealthCounts health = metrics.getHealthCounts();
        m.append("Requests: ").append(health.getTotalRequests()).append(" ");
        m.append("Errors: ").append(health.getErrorCount()).append(" (").append(health.getErrorPercentage())
                .append("%)   ");
        m.append("Mean: ").append(metrics.getTotalTimeMean()).append(" ");
        m.append("50th: ").append(metrics.getExecutionTimePercentile(50)).append(" ");
        m.append("75th: ").append(metrics.getExecutionTimePercentile(75)).append(" ");
        m.append("90th: ").append(metrics.getExecutionTimePercentile(90)).append(" ");
        m.append("99th: ").append(metrics.getExecutionTimePercentile(99)).append(" ");
    }
    return m.toString();
}第二、Cluster和Host每秒的请求数目,其中Cluster代表集群中每秒的请求数,host代表单机的每秒请求数
第三、Pool Size代表程序中的线程数目,并一定代表最大的线程数
第四、executions 正在执行的线程数,这个数量是小于Pool Size的
第五、max active 的解释是hread count displays the rolling maximum number of active threads during a rolling statistical window。我的理解是超时回滚的线程数,这个数目和超时线程的数目应该是一致的
第六、Queue size 队列大小
使用turbine的时候,dashboard服务的所有服务都不需要改变,因为Turbine展示的数据还要在dashboard中展示,Turbine作为一个单独的服务需要添加以下jar包
		org.springframework.cloud
		spring-cloud-starter-turbine


		org.springframework.boot
		spring-boot-starter-actuator
@Configuration
@EnableAutoConfiguration
@EnableTurbine
@EnableDiscoveryClient在使用turbine监控数据的时候出现一个问题:两个相同的服务提供相同的接口,此时一个服务应该是另一个服务的复制,因此所设置的线程池的大小和队列的大小也应该是一致的,但是出现以下几种情况:
第一,线程数+队列数为偶数的情况,单个服务处理请求数目为(线程数*2+队列数)/2,而不是原来的线程数+队列数,总体处理能力也由是线程数*2+队列数,总体未验证
第二,线程数+队列数为偶数的情况,单个服务处理请求数目和不加turbine监控时候的处理能力一样,总体处理能力也由是线程数*2+队列数,总体未验证
这样服务本身因为添加了监控而导致服务本身的设置发生了变化,个人认为这是不应该的发生的情况,监控不应该对服务本身产生影响,这是我测试的结果,有什么不对的也请指出。