Spring Cloud入门教程-使用Hystrix Dashboard 监控熔断器的状态
注意:这里用到的项目都是在之前几篇文章讲解用到的项目工程基础上进行的,在这一系列博客写完后会提供源码地址。
项目源码及相关说明请查看此文:Spring Cloud入门教程-简介
在微服务架构中,为了保证服务实例的可用性,防止服务实例出现故障导致线程阻塞,而出现了熔断器模型。熔断器的状况反映了一个程序的可用性和健壮性,它是一个重要指标Hystrix Dashboard是监控 Hystriⅸx的熔断器状况的一个组件,提供了数据监控和友好的图形化展示界面。本节在上一节的基础上,以案例的形式讲述如何使用 Hystrix Dashboard监控熔断器的状态。
在restTemplate 中使用Hystrix Dashboard
修改eureka-client-ribbon 项目,添加依赖:
	org.springframework.boot
	spring-boot-starter-actuator


	org.springframework.cloud
	spring-cloud-starter-netflix-hystrix-dashboard
在启动类EurekaClientRibbonApplication上添加注解@EnableHystrixDashboard。
@EnableHystrixDashboard
@EnableHystrix
@EnableEurekaClient
@SpringBootApplication
@ComponentScan("com.springcloud.demo.eurekaclientribbon")
public class EurekaClientRibbonApplication {

	public static void main(String[] args) {
		SpringApplication.run(EurekaClientRibbonApplication.class, args);
	}
}
还需要添加ServletRegistrationBean ,这是新版本做的修改,这里在RibbonConfig中添加。
@Bean
    public ServletRegistrationBean getServlet() {
        HystrixMetricsStreamServlet streamServlet = new HystrixMetricsStreamServlet();
        ServletRegistrationBean registrationBean = new ServletRegistrationBean(streamServlet);
        registrationBean.setLoadOnStartup(1);
        registrationBean.addUrlMappings("/actuator/hystrix.stream");
        registrationBean.setName("HystrixMetricsStreamServlet");
        return registrationBean;
    }
启动eureka-server,eureka-client,eureka-client-riibon,浏览器请求http://localhost:8795/hystrix

在界面上分别输入http://localhost:8795/actuator/hystrix.stream,2000,ribbon,点击Monitor Stream,界面出现两个loading。。。请求http://localhost:8795/main调用eureka-client中的服务。

界面如上图。多次点击后灰色的小圆圈会变大,直线会上扬,具体效果自己验证。
在feign中的配置与ribbon 相同,这里不再赘述。
使用Turbine 中聚合监控
在使用 Hystrix Dashboard组件监控服务的熔断器状况时,每个服务都有Dashboard主页,当服务数量很多时,监控非常不方便。为了同时监控多个服务的熔断器的状Turbine用于聚合多个 Hystrix Dashboard, Netflix开源了 Hystrix的另一个组件 Turbine
将多个 Hystrix Dashboard组件的数据放在一个页面上展示,进行集中监控。
创建新的Module eureka-monitor-client
pom.xml如下:
    4.0.0

        com.springcloud.demo
        springcloud-demo
        1.0-SNAPSHOT

    eureka-monitor-client
    0.0.1-SNAPSHOT
    jar

    eureka-monitor-client
    Demo project for Spring Boot


            org.springframework.boot
            spring-boot-starter-actuator


            org.springframework.cloud
            spring-cloud-starter-netflix-turbine


            org.springframework.boot
            spring-boot-starter-test
            test


                org.springframework.boot
                spring-boot-maven-plugin
增加配置端口为8796:
server.port=8796

spring.application.name=service-turbine

eureka.client.service-url.defaultZone=http://localhost:8791/eureka/

turbine.aggregator.cluster-config=default
turbine.app-config=eureka-client-feign,eureka-client-ribbon
turbine.cluster-name-expression=new String("default")
在EurekaMonitorClientApplication 上添加注解@EnableTurbine
@EnableTurbine
@SpringBootApplication
public class EurekaMonitorClientApplication {

	public static void main(String[] args) {
		SpringApplication.run(EurekaMonitorClientApplication.class, args);
	}
}
启动eureka-server,eureka-client,eureka-client-riibon,eureka-client-feign,eureka-monitor-client。
请求:http://localhost:8795/hystrix
在界面上 一次填入http://localhost:8796/turbine.stream ,2000,turbine,进入后,分别请求http://localhost:8794/main和http://localhost:8795/main
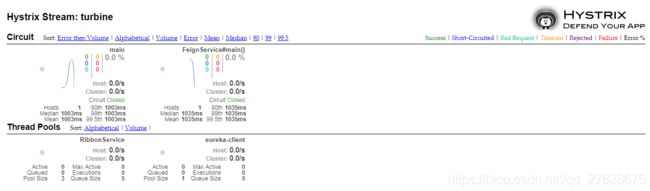
聚合完成。