Matplotlib 基本操作及基本案例
Matplotlib 教程
(一)Matplotlib详解
- 在matplotlib中整个图像为一个Figure对象,可包括一个或者多个Axes对象 每个Axes(ax) 对象都是一个绘图拥有自己坐标系统的绘图区域
- Axis(line):是横坐标
- Axis Label(text):横坐标姓名的标签
- Tick Label(text):设置横坐标的值
- Title(text):图名
- Tick(text):同理,是纵坐标的
- 各个对象包含关系fig(ax(xaxis(tick(tick label),label),yaxis(tick(tick label),label),title,data))
title为图像标题,Axis为坐标轴, Label为坐标轴标注,Tick为刻度线,Tick Label为刻度注释
常见绘图库如下:
- matplotlib
- Seaborn
- Bokeh: 交互式数据可视化
- Logistics Regression:分类预测和逻辑回归
(二)常用绘图类型
(1)折线图:plt()
(2)柱状图:plt.bar(x,y)
(3)散点图:plt.scatter(x,y)
(4)饼图:plt.pie(x)
(5)直方图:plt.hist(x,y)
(6)子图:plt.subplot(x,y,z)
(三)基本函数解释
(1)figure
- figure:matplotlib创建的图都在figure对象中,创建figure对象,plt.figure()
(2)Subplot:绘制子图
- fig.add_subplot(a,b,c):a,b代表将fig分割成a x b的区域,c代表当前选中要操作的区域,注意从1开始。
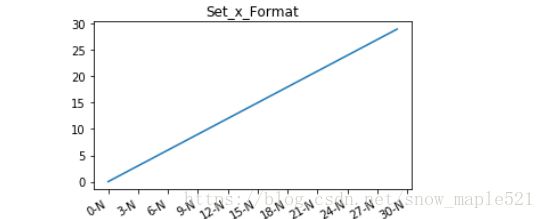
(3)自定义x轴刻度 :在matplotlib.ticker里的MultipleLocator,FormatStrFormatter里
- 导入包:
%python
import matplotlib.pyplot as plt
import numpy as np
from matplotlib.ticker import MultipleLocator,FormatStrFormatter- 数字格式:
%python
x = np.arange(30) #x取值
y = np.arange(30) #y取值
plt.figure(figsize=(5,3))
plt.plot(x,y)
#设置x刻度间隔
plt.gca().xaxis.set_major_locator(MultipleLocator(3))
#设置x轴的刻度显示格式
plt.gca().xaxis.set_major_formatter(FormatStrFormatter('%d-N'))
#自动旋转x刻度适应坐标轴
plt.gcf().autofmt_xdate()
plt.title('Set_x_Format')
plt.show()- 时间格式
%python
import numpy as np
import datetime
from matplotlib.dates import DayLocator,DateFormatter
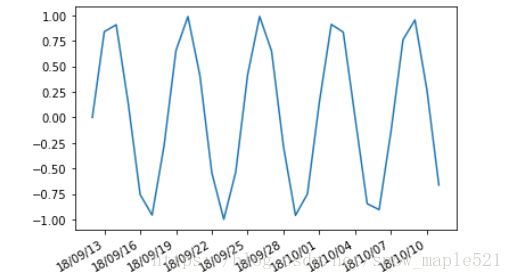
x = [datetime.date.today() + datetime.timedelta(i) for i in range(30)]
y = np.sin(np.arange(30))
plt.plot(x,y)
#设置x轴的时间间隔有,MinuteLocator,HourLocator,DayLocator,WeekLocator,MonthLocator,YearLocator
plt.gca().xaxis.set_major_locator(DayLocator(interval=3))
plt.gca().xaxis.set_major_formatter(DateFormatter('%y/%m/%d'))
plt.gcf().autofmt_xdate()
plt.show()
(4)绘制柱状图
%python
import matplotlib.pyplot as plt
import numpy as np
x = np.arange(5) #x产生5组
y1,y2 = np.random.randint(1,25,size=(2,5)) #y1,y2随机产生
width = 0.5 #代表柱状图的宽度
ax = plt.subplot(1,1,1)
ax.bar(x,y1,width,color='r')   #bar 是绘制柱状图
ax.bar(x+width,y2,width,color='g') #设置x轴,y轴,宽度,颜色
ax.set_xticks(x+width)
# ax.set_xticklabels(['a','b','c','d','e']) #自定义x的刻度标签的内容
plt.show()
width=0.5,没有设置x的刻度标签
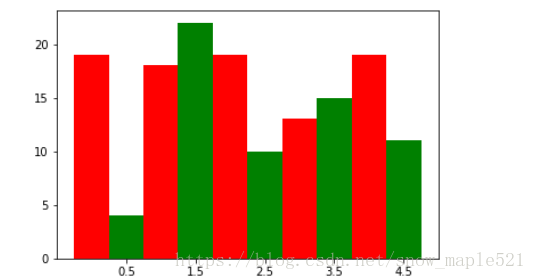
width=0.25,设置x的刻度标签
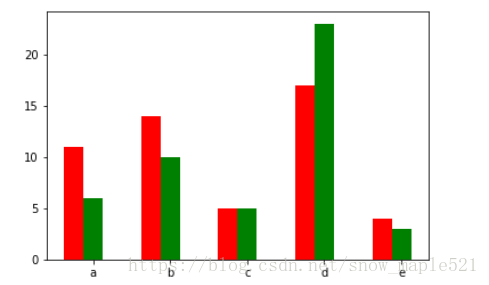
(5)矩阵绘图
%python
%matplotlib inline
import numpy as np
import matplotlib.pyplot as plt
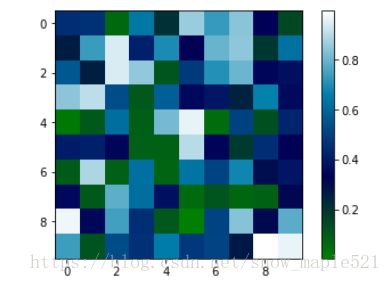
m = np.random.rand(10,10) #随机产生10x10的二维数组
# print(m)
plt.imshow(m,interpolation='nearest',cmap=plt.cm.ocean)
plt.colorbar()
plt.show()
(6)plt.subplots()
%python
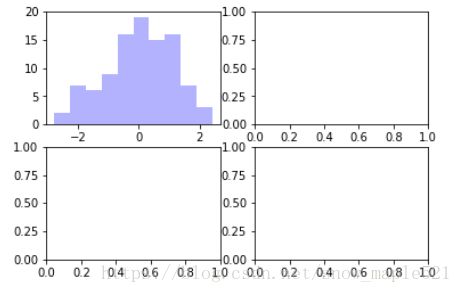
fig ,subplot_arr = plt.subplots(2,2)
subplot_arr[0,0].hist(np.random.randn(100),bins=10,color='b',alpha=0.3)
plt.show()
(7)常用颜色
    * b:blue
    * g:green
    * r:red
    * c:cyan
    * m:magenta
    * y:yellow
    * k:black
    * w:white
(8)x,y的刻度和标签及取值范围
- 设置显示的刻度
plt.xticks(),plt.yticks()
ax.set_xticks(),ax.set_yticks() - 设置刻度标签
ax.set_xticklabels(),ax.set_yticklabels() - 设置刻度范围
plt.xlim(),plt.ylim()
ax.set_xlim(),ax.set_ylime() - 设置坐标轴标签
ax.set_xlabel(),ax.set_ylabel()
案例引入:统计美国死亡率(1968-2010)
按年龄
%python
import csv
import numpy as np
import matplotlib.pyplot as plt
fig = plt.figure(figsize = (15,13))
plt.ylim(35,102)
plt.xlim(1965,2015)
labeldata =['Below 25','25-44','45-54','55-64','65-74','75-84','Over 85']
with open('mortality2.csv') as csvfile:
    mortdata = [row for row in csv.reader(csvfile)]
x = []
for row in mortdata:
    yrval = int(row[0])
    if(yrval == 1969):
        y = [[row[1]],[row[2]],[row[3]],[row[4]],[row[5]],[row[6]],[row[7]]]
    else:
        for col in range(0,7):
            y[col] += [row[col+1]]
    x += [yrval]
for col in range(0,7):
    if(col == 1):
        plt.plot(x,y[col],label=labeldata[col],linewidth=3.8)
    else:
        plt.plot(x,y[col],label=labeldata[col],linewidth=2)
plt.legend(loc=0,prop={'size':10})
plt.show()
按性别
%python
import csv
import matplotlib.pyplot as plt
fig = plt.figure(figsize=(10,4)) #设置图像大小
plt.ylim(740,1128) #设置y轴的取值范围
plt.xlim(1968,2011) #设置x轴的取值范围
with open('mortality1.csv') as csvfile:
    mortdata=[row for row in csv.DictReader(csvfile)] #打开文件 DictReader() 是用字段名作为键,字段的值作为值
x = [] #x列表
males_y = [] #男性列表
females_y = [] #女性列表
every_y = [] #全部人
yrval = 1968 #起始的统计年份
for row in mortdata:
    x += [yrval] #将1968插入x列表
    males_y += [row['Males']] #将Males那列的第一个值放入males_y的列表中
    females_y += [row['Females']] #将Females那列放入females_y列表中
    every_y += [row['Everyone']] #同上
    yrval = yrval + 1   #起始年份+1

plt.plot(x,males_y)
plt.plot(x,females_y)
plt.plot(x,every_y)
plt.legend(loc=0,prop={'size':10})
plt.show()
致谢
[1]:《python数据可视化》科斯.拉曼 (著)程豪(译)
也有借鉴了别人的博客,忘记了网址。。。。
