利用python进行零售商品数据分析
零售商品数据分析
文章目录
- 零售商品数据分析
- 1、数据集描述
- 2、明确分析目的
- 3、理解数据
- 4、数据清洗
- 4、1 缺失数据
- 4、1、1 统计缺失率
- 4、1、2 删除缺失值
- 4、2 转换数据类型
- 4、3 重复值处理
- 4、4 处理日期型数据
- 4、5 根据需要新建数列
- 5、数据分析
- 5、1 目标1:找出购买商品数量前十的国家
- 5、2 目标2:找出交易额前十的国家
- 5、3 目标3:公司在哪些月份的销售量比较好
- 5、4 目标4:客单价是多少
- 5、5 目标5:用户行为分析
- 5、6 目标6:基于RFM模型,对用户进行分类
- 5、6、1 再次进行数据清洗
- 5、6、1、1 转换Customer ID的数据类型为str
- 5、6、1、2 处理日期
- 5、6、1、3 新建字段
- 5、6、1、4 重复值处理
- 5、6、1、5 异常值处理
- 5、6、2 R、F、M
- 5、6、2、1 R
- 5、6、2、2 F
- 5、6、2、3 M
- 5、6、3 用户分级
- 5、6、4 拼接R、F、M
- 5、6、5 定义分级函数
- 5、6、6 统计用户等级分布情况
- 5、6、7 对结果可视化
- 5、7 目标7:退货订单分析
- 6、总结
这篇文章尝试着对一份零售商品数据进行分析,主要手段为描述统计与利用FRM模型进行客户分类,期望通过此次分析能达到如下目的:
- 1、找出购买商品数量前十的国家
- 2、找出交易额前十的国家
- 3、公司在哪些月份的销售量比较好
- 4、客单价是多少
- 5、用户行为分析
- 6、基于FRM模型,对用户进行分类
- 7、退货订单分析
我会将文中使用到的数据和源代码放在Github上,以便用得到的小朋友们下载:点此访问Github
1、数据集描述
这儿使用到的数据集来自Kaggle,该数据集包含2009-2010及2010-2011两个工作簿,记录了在英国注册的某公司网上零售的交易信息。主要销售产品为礼品。字段如下:
| 字段 | 描述 |
|---|---|
| Invoice | 订单编号 |
| StockCode | 产品编号 |
| Description | 产品描述 |
| Quantity | 订单商品数量 |
| InvoiceDate | 订单日期与时间 |
| Price | 商品单价 |
| Customer ID | 客户ID |
| Country | 客户所在国家/地区 |
2、明确分析目的
- 1、找出购买商品数量前十的国家
- 2、找出交易额前十的国家
- 3、公司在哪些月份的销售量比较好
- 4、客单价是多少
- 5、用户行为分析
- 6、基于FRM模型,对用户进行分类
- 7、退货订单分析
3、理解数据
# 导入相关库
import numpy as np
import pandas as pd
import matplotlib.pyplot as plt
import seaborn as sns
import plotly as py
import plotly.graph_objects as go
import csv
import os

pyplot = py.offline.plot

os.getcwd()
os.chdir("F:\DataSets\online_retail")
文中只对表格中的第一个工作簿进行分析(即2009-2010数据集),第二个工作簿分析可类似进行
# 数据读入
online_data = pd.read_excel("online_retail_II.xlsx")

# 查看数据情况
online_data.shape
(525461, 8)
online_data.head()
online_data.info()
online_data.columns
RangeIndex: 525461 entries, 0 to 525460
Data columns (total 8 columns):
Invoice        525461 non-null object
StockCode      525461 non-null object
Description    522533 non-null object
Quantity       525461 non-null int64
InvoiceDate    525461 non-null datetime64[ns]
Price          525461 non-null float64
Customer ID    417534 non-null float64
Country        525461 non-null object
dtypes: datetime64[ns](1), float64(2), int64(1), object(4)
memory usage: 32.1+ MB
Out[3]:Index(['Invoice', 'StockCode', 'Description', 'Quantity', 'InvoiceDate',
       'Price', 'Customer ID', 'Country'],
      dtype='object')
4、数据清洗
4、1 缺失数据
4、1、1 统计缺失率
# 统计缺失率
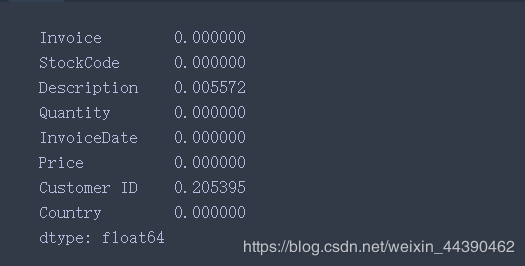
online_data.apply(lambda x: sum(x.isnull()) / len(x), axis=0)
Invoice        0.000000
StockCode      0.000000
Description    0.005572
Quantity       0.000000
InvoiceDate    0.000000
Price          0.000000
Customer ID    0.205395
Country        0.000000
dtype: float64
- Description 0.005572 Description存在数据缺失的情况,缺失率约为0.56%,暂时无法进行填充
- Customer ID 0.205395 Customer ID存在数据缺失,缺失率20.5%
4、1、2 删除缺失值
# 删除缺失值
df1 = online_data.dropna(how="any").copy()
df1.info()
Int64Index: 417534 entries, 0 to 525460
Data columns (total 8 columns):
Invoice        417534 non-null object
StockCode      417534 non-null object
Description    417534 non-null object
Quantity       417534 non-null int64
InvoiceDate    417534 non-null datetime64[ns]
Price          417534 non-null float64
Customer ID    417534 non-null float64
Country        417534 non-null object
dtypes: datetime64[ns](1), float64(2), int64(1), object(4)
memory usage: 28.7+ MB
4、2 转换数据类型
# 转换数据类型
# 转换Customer ID的数据类型为str
df1["Customer ID"] = df1["Customer ID"].astype(str)
df1.info()
Int64Index: 417534 entries, 0 to 525460
Data columns (total 8 columns):
Invoice        417534 non-null object
StockCode      417534 non-null object
Description    417534 non-null object
Quantity       417534 non-null int64
InvoiceDate    417534 non-null datetime64[ns]
Price          417534 non-null float64
Country        417534 non-null object
Customer ID    417534 non-null object
dtypes: datetime64[ns](1), float64(1), int64(1), object(5)
memory usage: 28.7+ MB
4、3 重复值处理
df1 = df1.drop_duplicates()
4、4 处理日期型数据
# 获取InvoiceDate日期部分
df1["InvoiceDate"] = df1["InvoiceDate"].dt.date
4、5 根据需要新建数列
# 新建一个销售总金额的字段 销售金额 = 单价 * 数量
df1["T_Price"] = df1.apply(lambda x: x[3] * x[5], axis=1)
5、数据分析
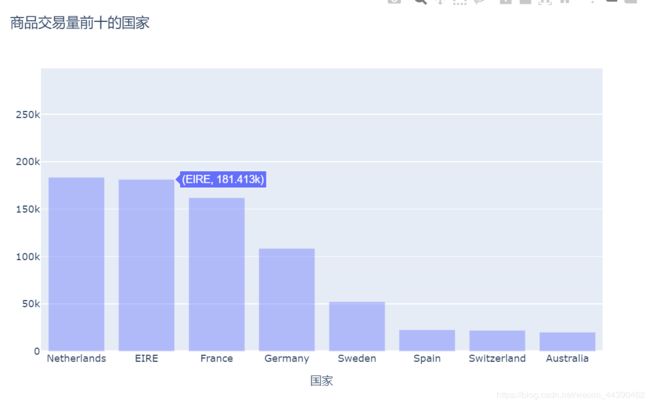
5、1 目标1:找出购买商品数量前十的国家
# 目标1:找出购买商品数量前十的国家
df1[df1["Quantity"] > 0].groupby("Country")["Quantity"].sum().sort_values(
    ascending=False).head(10)
Country
United Kingdom    4430926
Denmark            229690
Netherlands        183679
EIRE               181413
France             162048
Germany            108633
Sweden              52417
Spain               22841
Switzerland         22255
Australia           20189
Name: Quantity, dtype: int64
# 将结果可视化
quan_top_10 = df1[df1["Quantity"] > 0].groupby(
    "Country")["Quantity"].sum().sort_values(ascending=False).head(10)

trace_0 = go.Bar(x=quan_top_10.index.tolist(),
                 y=quan_top_10.values.tolist(),
                 opacity=0.4)
layout = go.Layout(title="商品交易量前十的国家", xaxis=dict(title="国家"))
fig = go.Figure(data=trace_0, layout=layout)
fig.show()
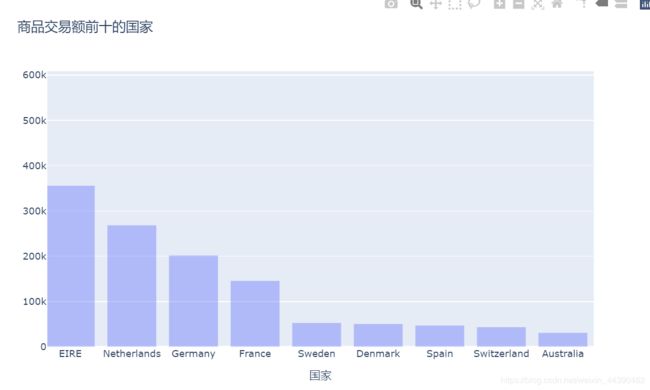
5、2 目标2:找出交易额前十的国家
# 目标2:找出交易额前十的国家
df1[df1["T_Price"] > 0].groupby("Country")["T_Price"].sum().sort_values(
    ascending=False).head(10)
Country
United Kingdom    7.381644e+06
EIRE              3.560419e+05
Netherlands       2.687844e+05
Germany           2.020254e+05
France            1.461071e+05
Sweden            5.314799e+04
Denmark           5.090685e+04
Spain             4.756865e+04
Switzerland       4.392139e+04
Australia         3.144680e+04
Name: T_Price, dtype: float64
# 将结果可视化
p_top_10 = df1[df1["T_Price"] > 0].groupby(
    "Country")["T_Price"].sum().sort_values(ascending=False).head(10)

trace_0 = go.Bar(x=p_top_10.index.tolist(),
                 y=p_top_10.values.tolist(),
                 opacity=0.4)
layout = go.Layout(title="商品交易额前十的国家", xaxis=dict(title="国家"))
fig = go.Figure(data=trace_0, layout=layout)
fig.show()
5、3 目标3:公司在哪些月份的销售量比较好
# 目标3:公司在哪些月份的销售量比较好
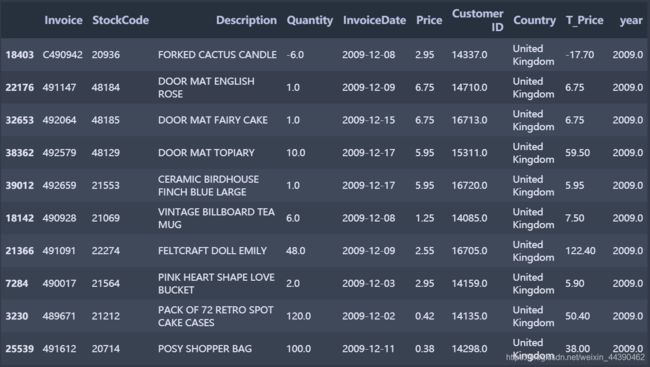
df1["year"] = pd.to_datetime(df1["InvoiceDate"]).dt.year
df1.sample(10)
# 本次数据含有2009、2010两年的销售情况
# 对这两年分别进行统计
df_09 = df1.where(df1["year"] == 2009).dropna(how="all").copy()
df_09.shape
(31276, 10)
df_09.sample(10)
df_10 = df1.where(df1["year"] == 2010).dropna(how="all").copy()
df_10.shape
(379487, 10)
09年数据量较少,仅45000行,10年数据有477533
df_09["month"] = pd.to_datetime(df1["InvoiceDate"]).dt.month
df_09[df_09["Quantity"] > 0].groupby(
    "month")["Quantity"].sum().sort_values(ascending=False)
month
12 398708.0
Name: Quantity, dtype: float64
我们可以得知,09年仅有12月的交易信息,无法得知其他月份信息,故无法进行比较
df_10["month"] = pd.to_datetime(df1["InvoiceDate"]).dt.month
df_10[df_10["Quantity"] > 0].groupby("month")["Quantity"].sum().sort_values(
    ascending=False)
month
11    653074.0
10    596497.0
9     567806.0
3     502101.0
8     452551.0
6     389880.0
5     384960.0
2     371871.0
1     370128.0
4     350604.0
7     324638.0
12    157630.0
Name: Quantity, dtype: float64
df1["InvoiceDate"].sort_values().head(5)
df_09["InvoiceDate"].sort_values(ascending=False).head(2)
df_10["InvoiceDate"].sort_values().head(2)
df_10["InvoiceDate"].sort_values(ascending=False).head(2)
观察各月份产品交易数量,发现12月份统计数量明显偏低,分析原因可能是因为12月信息统计不充分,考虑将09年12月数据填充至10年
df1["month"] = pd.to_datetime(df1["InvoiceDate"]).dt.month
df1[df1["Quantity"] > 0].groupby("month")["Quantity"].sum().sort_values(
    ascending=False)
month
11 653074
10 596497
9 567806
12 556338
3 502101
8 452551
6 389880
5 384960
2 371871
1 370128
4 350604
7 324638
Name: Quantity, dtype: int64
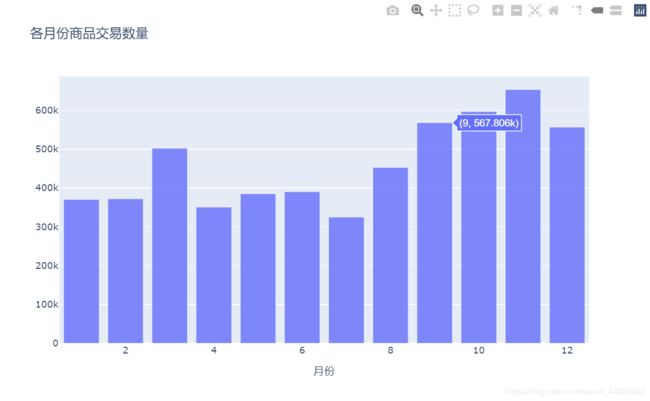
绘制图形
# 绘制图形
x1 = df1[df1["Quantity"] > 0].groupby("month")["Quantity"].sum().sort_values(
    ascending=False)
trace_0 = go.Bar(x=x1.index.tolist(),
                 y=x1.values.tolist(),
                 marker=dict(opacity=0.8))
layout = go.Layout(title="各月份商品交易数量", xaxis=dict(title="月份"))
fig = go.Figure(data=trace_0, layout=layout)
fig.show()
x2 = df1[df1["T_Price"] > 0].groupby(
    "month")["T_Price"].sum().sort_values(ascending=False)
trace_0 = go.Bar(x=x2.index.tolist(), y=x2.values.tolist(),
                 marker=dict(opacity=0.8))
layout = go.Layout(title="各月份商品交易额", xaxis=dict(title="月份"))
fig = go.Figure(data=trace_0, layout=layout)
fig.show()
- 可以得到,交易额与交易数量两个角度均表明销售最佳的月份是11月,其次是12月,下半年优于上半年。
原因分析:可能是因为数据来自欧美,他们的重大节日在下半年较多,促销活动也较多
5、4 目标4:客单价是多少
# 目标4:客单价是多少
# 客单价 = 成交金额 / 成交用户数
sum_price = df1[df1["Quantity"] > 0]["T_Price"].sum()
count_no = df1[df1["Quantity"] > 0].groupby(
    df1["Customer_ID"]).count().shape[0]
avgPrice = sum_price / count_no
print(avgPrice)
2039.4607658785349
计算得出,平均客单价为2039元
5、5 目标5:用户行为分析
# 目标5:用户行为分析
# 从用户消费次数,用户消费金额,用户购买产品数量三个维度进行探讨
customer_c = df1[df1["Quantity"] > 0].groupby("Customer ID").agg({
    "Invoice":
    "nunique",
    "Quantity":
    np.sum,
    "T_Price":
    np.sum
})
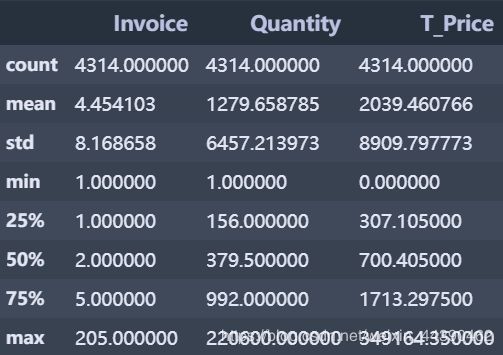
customer_c.describe()
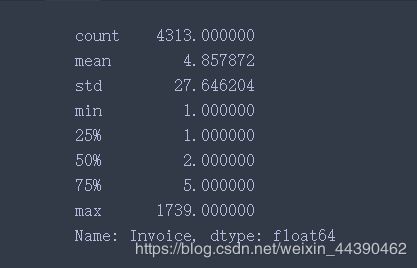
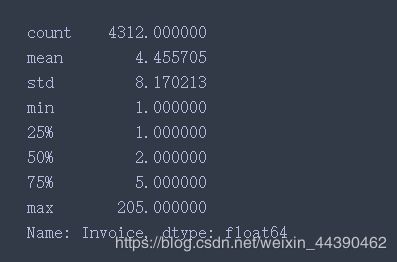
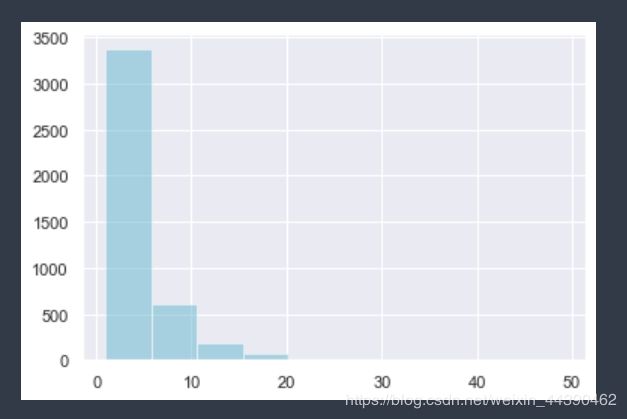
- 近一年的时间里,客户平均消费频次为4次,消费次数最高的达到205次,大部分客户的消费频次都在5次以内
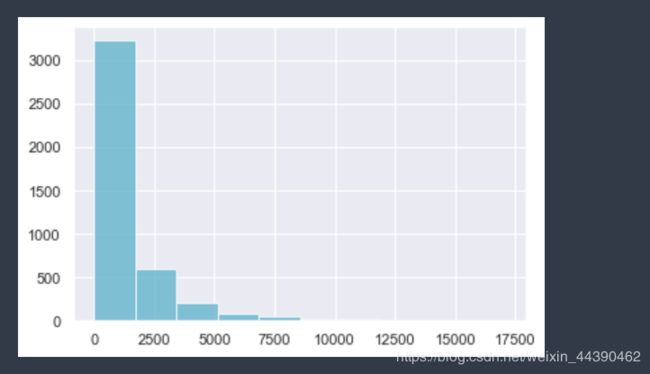
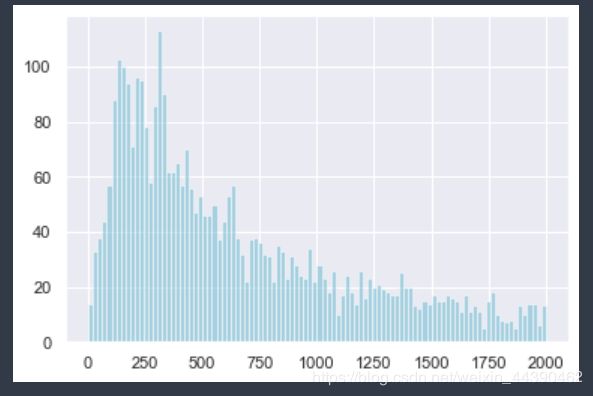
- 近一年的时间里,客户平均消费金额为2039,中位数为700元,消费金额最高的客户达到349164.35元,是我们需要重点关注的对象
- 从商品购买数量上看,大部分客户购买数量都在1000件以内
5、6 目标6:基于RFM模型,对用户进行分类
RFM模型简介:
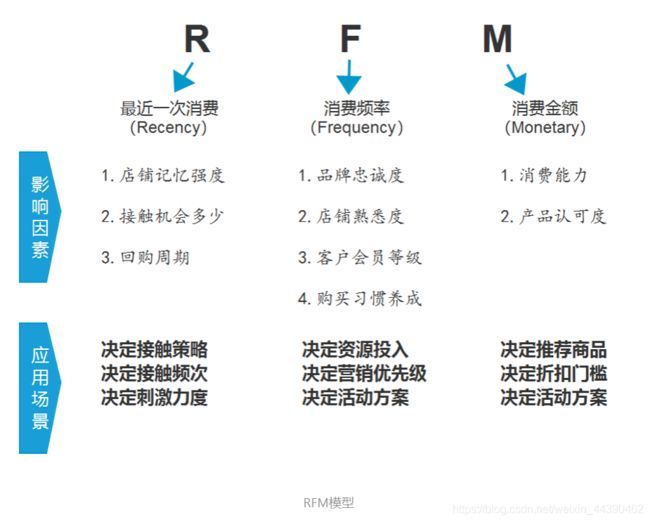
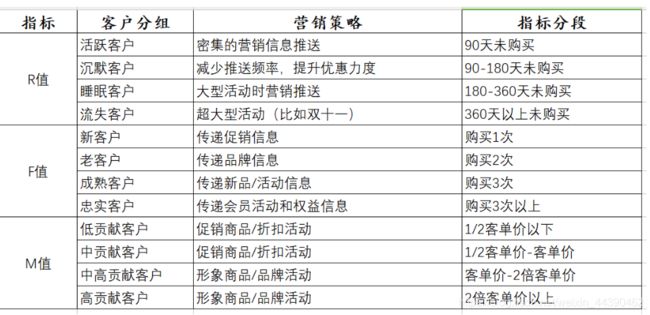
RFM模型是衡量客户价值和客户创利能力的重要工具和手段。在众多的客户关系管理(CRM)的分析模式中,RFM模型是被广泛提到的。RFM是Rencency(最近一次消费),Frequency(消费频率)、Monetary(消费金额),三个指标首字母组合。我们利用这3项指标来描述该客户的价值状况。

对比分析不同用户群体在时间、地区等维度下的交易量、交易金额,根据分析结果提出优化建议。
# 目标6:基于RFM模型,对用户进行分类
# 前期我们对Customer ID存在的缺失数据进行了删除(缺失率20.5%)
# 我们对缺失的客户ID进行常值填充(也可类似之前做删除处理,看个人选择)
online_data.info()
online_data.apply(lambda x: sum(x.isnull()) / len(x), axis=0)
# 同上,删除Description缺失数据
df2 = online_data.dropna(subset=["Description"]).copy()
# Customer ID的缺失数据通过U填充(U:表示未知)
df2["Customer ID"] = df2["Customer ID"].fillna("U")
5、6、1 再次进行数据清洗
5、6、1、1 转换Customer ID的数据类型为str
# 转换Customer ID的数据类型为str
df2["Customer ID"] = df2["Customer ID"].astype(str)
df2.info()
5、6、1、2 处理日期
# 获取InvoiceDate日期部分
df2["InvoiceDate"] = df2["InvoiceDate"].dt.date
# 新建年,月,日三个特征
# 获取InvoiceDate年份
df2["year"] = pd.to_datetime(df2["InvoiceDate"]).dt.year
# 获取InvoiceDate月份
df2["month"] = pd.to_datetime(df2["InvoiceDate"]).dt.month
# 获取InvoiceDate 日
df2["day"] = pd.to_datetime(df2["InvoiceDate"]).dt.day
# 日期
df2["date"] = pd.to_datetime(df2["InvoiceDate"])
df2.drop(["InvoiceDate"], axis=1, inplace=True)
df2.info()
df2.sample(5)
5、6、1、3 新建字段
# 新建一个销售总金额的字段 销售金额 = 单价 * 数量
df2["T_Price"] = df2["Quantity"] * df2["Price"]
df2["T_Price"][:5]
5、6、1、4 重复值处理
# 重复值处理
df2 = df2.drop_duplicates()
5、6、1、5 异常值处理
# 异常值处理
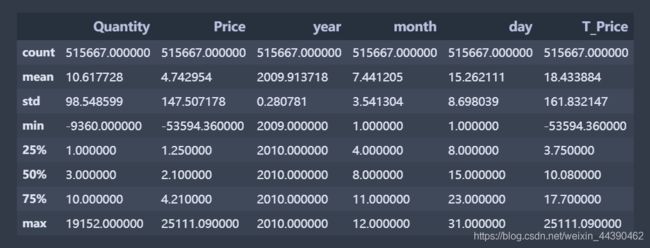
df2.describe()
# 商品数量、单价存在负值或0
# 商品数量
df2_1 = df2.loc[df2["Quantity"] <= 0]
df2_1.info()
print("异常值占比:", df2_1.shape[0] / df2.shape[0])异常值占比: 0.02031349688849587
可能是退货
# 单价
df2_2 = df2.loc[df2["Price"] <= 0]
print("异常值占比:", df2_2.shape[0] / df2.shape[0])
异常值占比: 0.0014660624007353583
异常值占比: 0.0014660624007353583
df2_2["Price"].sample(2)
350849 0.0
516202 0.0
Name: Price, dtype: float64
df2_2["Price"].groupby(df2_2["Price"]).count()
Price
-53594.36      1
-44031.79      1
-38925.87      1
 0.00        753
Name: Price, dtype: int64
单价为0的记录有759条,可能此类货品为赠品;为负的三条记录其Description均为Adjust bad debt
# 剔除退货相关的数据
df3 = df2.loc[(df2["Quantity"] > 0) & (df2["Price"] > 0)]
5、6、2 R、F、M
构建RFM值,并查看RFM信息,设置阈值
5、6、2、1 R
# R
# 客户最近一次消费时间
R_value = df3.groupby("Customer ID")["date"].max()
# 计算出客户最后一次消费距离某个截至日期的天数(以所有客户中最近一次消费时间为基准)
R = (df3["date"].max() - R_value).dt.days
R.describe()
# 绘图
sns.set(style="darkgrid")
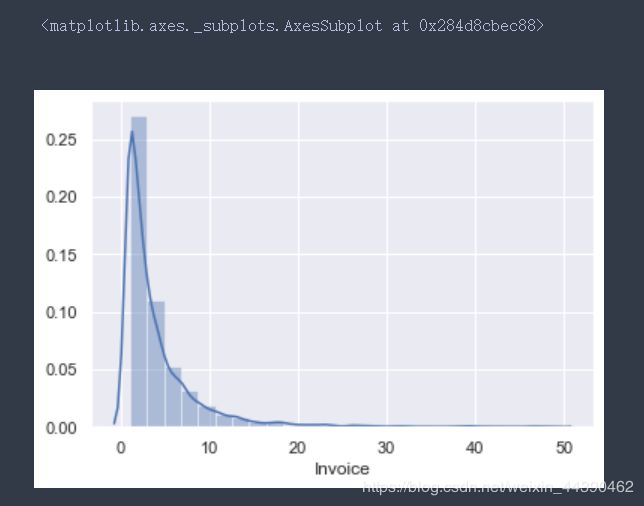
sns.distplot(R, bins=25)
5、6、2、2 F
# 客户消费频率
F = df3.groupby("Customer ID")["Invoice"].nunique()F.describe()# 绘图
# 受客户ID未知U影响,我们只查看F<50的部分
sns.distplot(F[F < 50], bins=25)5、6、2、3 M
# 客户的消费金额
M = df3.groupby("Customer ID")["T_Price"].sum()
Mdf3.info()
# 同上受客户ID未知U影响,我们只查看M<10*(75% : 1.723450e+03)的部分
plt.hist(M[M < 1.723e+04], color="c", alpha=.8)
plt.show()
# 查看金额在75%内的分布:
plt.hist(M[M < 1.73e+03], bins=100, color="c", alpha=.8)
plt.show()
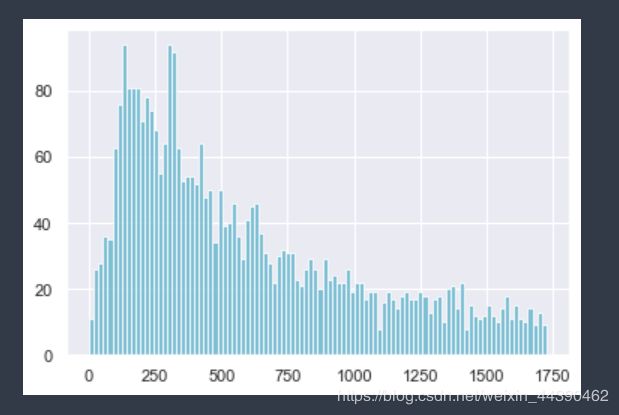
可见,客户ID缺失值用U填充对RFM值影响较大,接下来考虑删除缺失值,重复上述过程
# 剔除未知客户进行分析
df4 = df3[~(df3["Customer ID"] == "U")]
R1_value = df4.groupby("Customer ID")["date"].max()
R1 = (df4["date"].max() - R1_value).dt.days
F1 = df4.groupby("Customer ID")["Invoice"].nunique()
M1 = df4.groupby("Customer ID")["T_Price"].sum()
R1.describe()
plt.hist(R1, bins=25, color="c", alpha=.5)
plt.show()
F1.describe()
plt.hist(F1[F1 < 50], color="c", alpha=.5)
plt.show()
M1.describe()count 4312.000000
mean 2040.399825
std 8911.756229
min 2.950000
25% 307.187500
50% 701.615000
75% 1712.512500
max 349164.350000
Name: T_Price, dtype: float64
plt.hist(M1, color="c", alpha=.5)
plt.show()
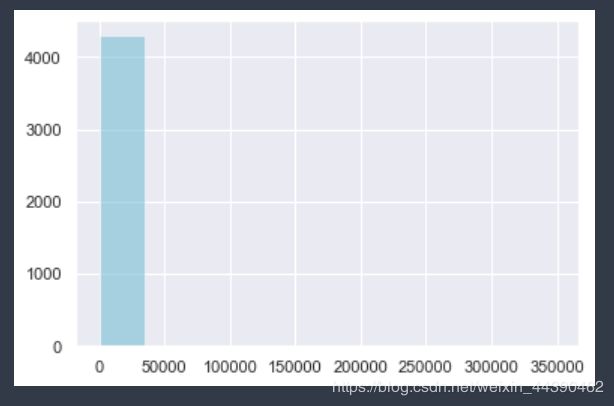
存在最大值349164干扰,导致图形展示效果较差,故调整展示范围
# 存在最大值349164
plt.hist(M[M < 2000], bins=100, color="c", alpha=.5)
plt.show()
5、6、3 用户分级
# 用户分级
# bins
R_bins = [0, 25, 50, 100, 200, 400]
F_bins = [1, 2, 5, 10, 100, 300]
M_bins = [0, 300, 600, 2000, 10000, 500000]

# 离散化
R_score = pd.cut(R1, R_bins, labels=[5, 4, 3, 2, 1], right=False)
F_score = pd.cut(F1, F_bins, labels=[1, 2, 3, 4, 5], right=False)
M_score = pd.cut(M1, M_bins, labels=[1, 2, 3, 4, 5], right=False)

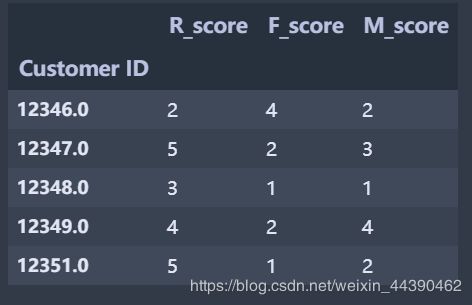
RFM = pd.concat([R_score, F_score, M_score], axis=1)
RFM.rename(columns={
    "date": "R_score",
    "Invoice": "F_score",
    "T_Price": "M_score"
},
           inplace=True)
RFM.head()
# 转换数据类型
RFM.info()
for i in ["R_score", "F_score", "M_score"]:
    RFM[i] = RFM[i].astype(float)
RFM.describe()
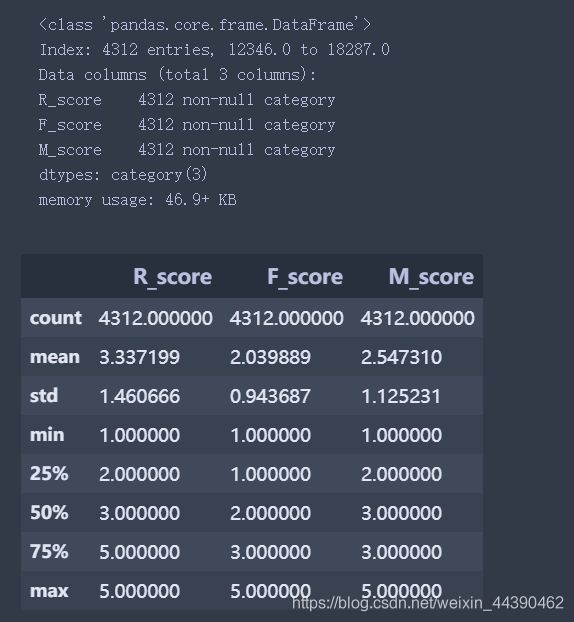
设定平均值为阈值,数值大于平均值这标记为“高”,小于均值标记为“低”
# 设定平均值为阈值,数值大于平均值这标记为“高”,小于均值标记为“低”
RFM["R"] = np.where(RFM["R_score"] > 3.337199, "高", "低")
RFM["F"] = np.where(RFM["F_score"] > 2.039889, "高", "低")
RFM["M"] = np.where(RFM["M_score"] > 2.554267, "高", "低")
RFM.sample(10)
5、6、4 拼接R、F、M
# 拼接R、F、M
RFM["value"] = RFM["R"].str[:] + RFM["F"].str[:] + RFM["M"].str[:]
5、6、5 定义分级函数
# 定义分级函数
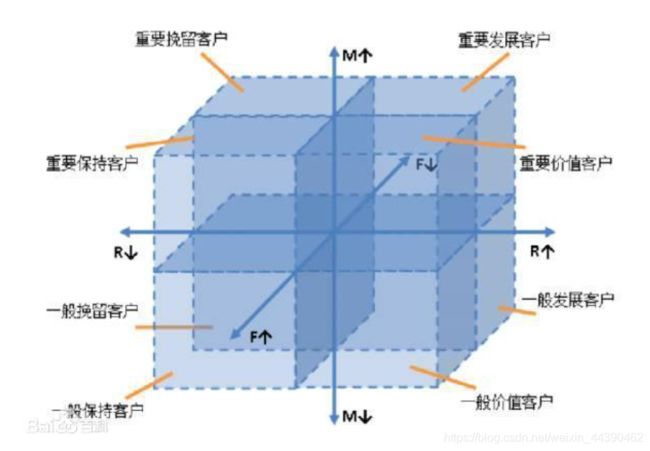
def grade(x):
    if x == "高高高":
        return "重要价值客户"
    elif x == "低高高":
        return "重要保持客户"
    elif x == "高低高":
        return "重要发展客户"
    elif x == "低低高":
        return "重要挽留客户"
    elif x == "高高低":
        return "一般价值客户"
    elif x == "低高低":
        return "一般保持客户"
    elif x == "高低低":
        return "一般发展客户"
    else:
        return "一般挽留客户"
5、6、6 统计用户等级分布情况
RFM["grade"] = RFM["value"].apply(grade)
RFM["grade"].value_counts()
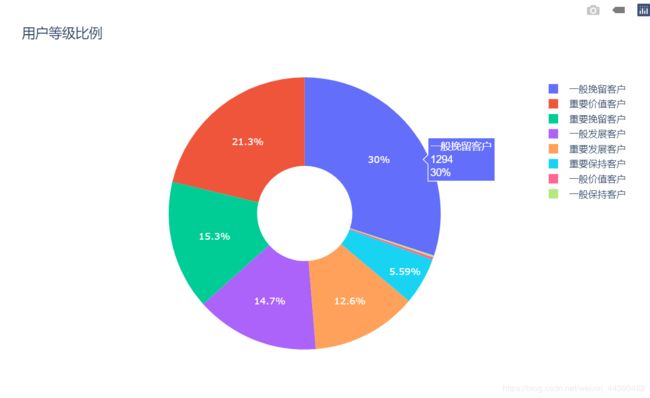
一般挽留客户 1294
重要价值客户 917
重要挽留客户 661
一般发展客户 634
重要发展客户 543
重要保持客户 241
一般价值客户 13
一般保持客户 9
Name: grade, dtype: int64
5、6、7 对结果可视化
#  对结果可视化
trace_1 = go.Bar(x=RFM["grade"].value_counts().index.tolist(),
                 y=RFM["grade"].value_counts().values.tolist(),
                 opacity=.5)
layout = go.Layout(title="用户等级信息", xaxis=dict(title="用户等级标签"))
fig = go.Figure(data=trace_1, layout=layout)
fig.show()
trace_2 = go.Pie(labels=RFM["grade"].value_counts().index.tolist(),
values=RFM["grade"].value_counts().values,
hole=0.35,
textfont=dict(size=12, color="white"))
layout = go.Layout(title="用户等级比例")
fig = go.Figure(data=trace_2, layout=layout)
fig.show()
5、7 目标7:退货订单分析
# 7、退货订单分析
# 退货金额合计
r = pd.pivot_table(df2_1,
                   index=["year"],
                   columns=["month"],
                   values=["T_Price"],
                   aggfunc={"T_Price": np.sum},
                   margins=False)
r.fillna(0)
# 计算退货率: 退货率 = 退货合计金额 / 总金额
# 总金额 (df3:剔除退货后的数据)
t = pd.pivot_table(df3,
                   index=["year"],
                   columns=["month"],
                   values=["T_Price"],
                   aggfunc={"T_Price": np.sum},
                   margins=False)
t.fillna(0)
# 退货率
r_rate = round(-r / t * 100, 5)
r_rate = r_rate.fillna(0)
r_rate.reset_index(drop=True,inplace=True)
r_rate
# r_rate.loc[1][:].tolist()
r_rate.loc[0].index.levels[1]
#  对结果可视化
trace_1 = go.Bar(x=r_rate.loc[0].index.levels[1].tolist(),
                 y=r_rate.loc[0].tolist(),
                 opacity=.5,
                 name="2009年")
trace_2 = go.Bar(x=r_rate.loc[0].index.levels[1].tolist(),
                 y=r_rate.loc[1][:].tolist(),
                 opacity=.5,
                 name="2010年")
layout = go.Layout(title="退货信息",
                   xaxis=dict(title="月份"),
                   yaxis=dict(title="退货率(百分比)"))
fig = go.Figure(data=[trace_1, trace_2], layout=layout)
fig.show()
6、总结
- 交易量前十的国家及其交易量分别为:
| 国家 | 交易量 |
|---|---|
| United Kingdom | 4430926 |
| Denmark | 229690 |
| Netherlands | 183679 |
| EIRE | 181413 |
| France | 162048 |
| Germany | 108633 |
| Sweden | 52417 |
| Spain | 22841 |
| Switzerland | 22255 |
| Australia | 20189 |
- 交易额前十的国家及其交易金额分别为:
| 国家 | 交易额 |
|---|---|
| United Kingdom | 7.414756e+06 |
| EIRE | 3.560852e+05 |
| Netherlands | 2.687860e+05 |
| Germany | 2.023953e+05 |
| France | 1.462154e+05 |
| Sweden | 5.317139e+04 |
| Denmark | 5.090685e+04 |
| Spain | 4.760142e+04 |
| Switzerland | 4.392139e+04 |
| Australia | 3.144680e+04 |
- 从交易额与交易数量两个角度均表明该公司销售最佳的月份是11月,其次是12月,下半年优于上半年。
原因分析:可能是因为数据来自欧美,他们的重大节日在下半年较多,促销活动也较多 - 在2009-12到2010-12期间:平均客单价为2039元
- 2010年近一年的时间里,客户平均消费频次为4次,消费次数最高的达到205次,大部分客户的消费频次都在5次以内
- 这一年的时间里,客户平均消费金额为2039,中位数为700元,消费金额最高的客户达到349164.35元,是我们需要重点关注的对象
- 从商品购买数量上看,大部分客户购买数量都在1000件以内
- 通过RFM模型,我们将用户分为了8各类别。该公司用户数量最多的为一般挽留客户与重要价值客户,占总用户数的51.3%,其次为重要挽留客户与一般发展客户,共占总用户数的30%。公司可以参考此用户等级及其所占占比策划营销活动,有助于提升活动效果及营销费用的利用率
- 从退货情况来看,10年12月退货率明显偏高,可参考该月份及上月销售情况及内外部因素综合考虑,分析退货率高的原因。(提供几个思考方向:产品本身,销售渠道,价格,是否是促销,售后等方面)
以上便是我对这份零售数据进行的一次探索分析,相信其中会有很多不足之处,欢迎有缘读到此篇文章的小朋友们批评指正,如有能启发或帮助到你的地方,我将倍感荣幸。(●’◡’●)


