Python:下载数据——CSV文件格式&练习题
来源:《Python编程:从入门到实践》
文章目录
- 1 CSV文件格式
- 1.1 分析CSV文件头
- 1.2 打印文件头及其位置
- 1.3 提取并读取数据
- 1.4 绘制气温图表
- 1.5 模块datetime
- 1.6 在图表中添加日期
- 1.7 涵盖更长的时间
- 1.8 再绘制一个数据系列
- 1.9 给图表区域着色
- 1.10 错误检查
- 2 练习
- 这部分的学习将访问并可视化以两种常见格式存储的数据:CSV和JSON
- 要处理各种真实世界的数据集,必须能够访问并可视化各种类型和格式的在线数据
1 CSV文件格式
- CSV文件:
要在文本文件中存储数据,最简单的方式是将数据作为一系列以逗号分隔的值(CSV)写入文件,这样的文件称为CSV文件 - 例如 下面一行CSV格式的天气数据:
2014-1-5,61,44,26,18,7,-1,56,30,9,30.34,30.27,30.15,,,,10,4,,0.00,0,,195
- 这是阿拉斯加锡特卡2014年1月5日的天气数据,其中包含当天的最高气温和最低气温,还有其他众多数据
- CSV文件对人来说阅读起来比较麻烦,但程序可轻松地提取并处理其中的值,这有助于加快数据分析过程
- 先处理少量锡特卡的CSV格式的天气数据,这些数据可在本书的配套资源中找到。
- 将文件sitka_weather_07-2014.csv复制到当前章节的文件夹
这个项目使用的天气数据是从http://www.wunderground.com/history下载而来的
1.1 分析CSV文件头
csv模块包含在Python标准库中,可用于分析CSV文件中的数据行,能够快速提取感兴趣的值- 下面先来查看这个文件的第一行,其中包含一系列有关数据的描述:
highs_lows.py
import csv

filename = 'sitka_weather_07-2014.csv'
with open(filename) as f:
    reader = csv.reader(f)
    header_row = next(reader)
    print(header_row)
- 调用
csv.reader(),将前面存储的文件对象作为实参传递给它,从而创建一个与该文件相关联的阅读器(reader)对象 - 模块csv的reader类包含next()方法,调用内置函数next()并将一个reader作为参数传递给它时,将调用reader的
next()方法,返回文件中的下一行

reader处理文件中以逗号分隔的第一行数据,并将每项数据都作为一个元素存储到列表中
1.2 打印文件头及其位置
highs_lows.py
--snip--
with open(filename) as f:
    reader = csv.reader(f)
    header_row = next(reader)

    for index, column_header in enumerate(header_row):
        print(index, column_header)
- 对列表调用
enumerate()来获取每个元素的索引及其值
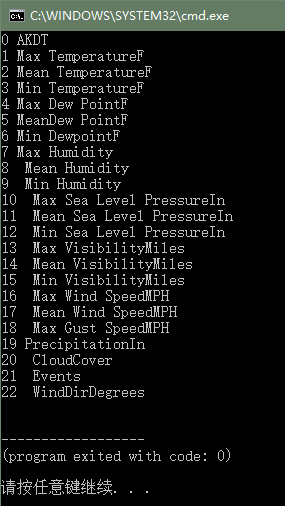
- 日期和最高气温分别在第0列和第1列
- 提取其中索引为0和1的值
1.3 提取并读取数据
- 首先读取每天的最高气温:
highs_lows.py
import csv
# 从文件中获取最高气温
filename = 'sitka_weather_07-2014.csv'
with open(filename) as f:
reader = csv.reader(f)
header_row = next(reader)
highs = []
for row in reader:
highs.append(row[1])
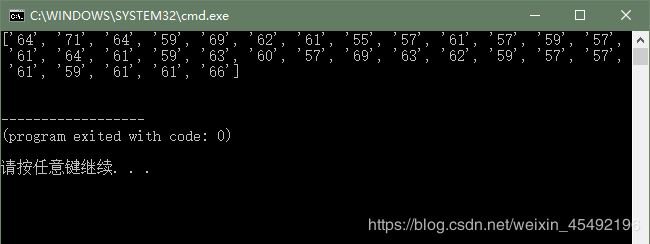
print(highs)
reader从其停留的地方继续往下读取CSV文件,每次都自动返回当前位置的下一行- 由于已经读取了文件头行,这个循环将开始于第二行——从这行开始包含实际数据
- 下面使用int()将这些字符串转换为数字,让matplotlib能够读取它们:
highs_lows.py
--snip--
    highs = []
    for row in reader:
        high = int(row[1])
        highs.append(high)

    print(highs)
- 现在已将表示最高气温的字符串转换成了数字,并附加到列表末尾
- 下面对其进行可视化
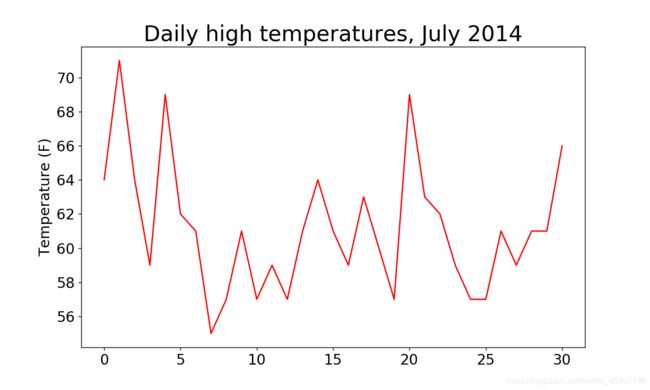
1.4 绘制气温图表
- 使用matplotlib创建一个显示每日最高气温的简单图形
highs_lows.py
import csv

import matplotlib.pyplot as plt

# 从文件中获取最高气温
--snip--

# 根据数据绘制图形
fig = plt.figure(dpi=128, figsize=(10, 6))
plt.plot(highs, c='red')

# 设置图形的格式
plt.title("Daily high temperatures, July 2014", fontsize=24)
plt.xlabel('', fontsize=16)
plt.ylabel("Temperature (F)", fontsize=16)
plt.tick_params(axis='both', which='major', labelsize=16)

plt.show()
- 设置了一些格式,如字体大小和标签;
- 但还没有添加日期,隐藏没给x轴添加标签,只修改了字体大小
1.5 模块datetime
- 在天气数据文件中,第一个日期在第二行:
2014-7-1,64,56,50,53,51,48,--snip--
- 读取该数据时,获得的是一个字符串,想办法将 ‘2014-7-1’ 转换为一个表示相应日期的对象
使用模块datetime的方法strptime()
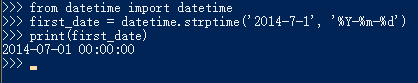
- 通过上面的终端会话可以看看strptime()的工作原理
- 第一个实参——所需日期的字符串
- 第二个实参——告诉Python如何设置日期的格式
- ‘%Y-’ 让Python将字符串第一个连字符前面的部分视为四位的年份
- '%m-让Python将第二个连字符前面的部分视为表示月份的数字
- '%d-'让Python将最后一部分视为月份中的一条
1.6 在图表中添加日期
highs_lows.py
import csv
from datetime import datetime

from matplotlib import pyplot as plt

# 从文件中获取日期 & 最高气温
filename = 'sitka_weather_07-2014.csv'
with open(filename) as f:
    reader = csv.reader(f)
    header_row = next(reader)

    dates, highs = [], []
    for row in reader:
        current_date = datetime.strptime(row[0], "%Y-%m-%d")
        dates.append(current_date)
        high = int(row[1])
        highs.append(high)

# 根据数据绘制图形
fig = plt.figure(dpi=128, figsize=(10, 6))
plt.plot(dates, highs, c='red')

# 设置图形的格式
plt.title("Daily high temperatures, July 2014", fontsize=24)
plt.xlabel('', fontsize=16)
fig.autofmt_xdate()
plt.ylabel("Temperature (F)", fontsize=16)
plt.tick_params(axis='both', which='major', labelsize=16)

plt.show()
- 将包含日期信息的数据(row[0])转换为datetime对象
- 调用
fig.autofmt_xdate()来绘制斜的日期标签,以免它们彼此重叠

1.7 涵盖更长的时间
- 将sitka_weather_2014.csv复制到本章节程序的文件夹中,该文件包含Weather Underground提供的整年的锡特卡天气数据
highs_lows.py
--snip--
# 从文件中获取日期 & 最高气温
filename = 'sitka_weather_2014.csv'
--snip--
# 设置图形的格式
plt.title("Daily high temperatures - 2014", fontsize=24)
--snip--

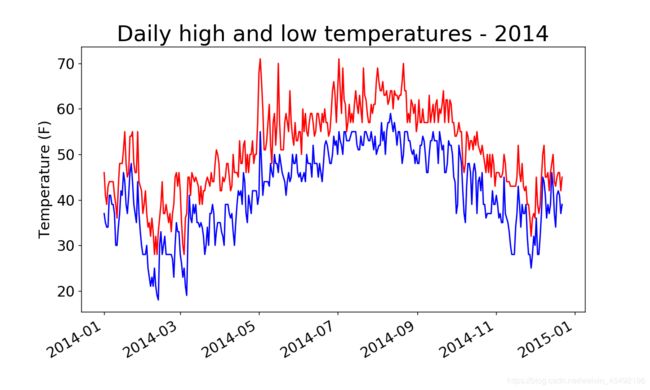
1.8 再绘制一个数据系列
- 从文件中提取最低气温,将它们添加到图表中
highs_lows.py
--snip--
# 从文件中获取日期 & 最高气温 & 最低气温
filename = 'sitka_weather_2014.csv'
with open(filename) as f:
    reader = csv.reader(f)
    header_row = next(reader)

    dates, highs, lows = [], [], []
    for row in reader:
        current_date = datetime.strptime(row[0], "%Y-%m-%d")
        dates.append(current_date)

        high = int(row[1])
        highs.append(high)

        low = int(row[3])
        lows.append(low)

# 根据数据绘制图形
fig = plt.figure(dpi=128, figsize=(10, 6))
plt.plot(dates, highs, c='red')
plt.plot(dates, lows, c='blue')

# 设置图形的格式
plt.title("Daily high and low temperatures - 2014", fontsize=24)
--snip--
- 这部分没什么多说的
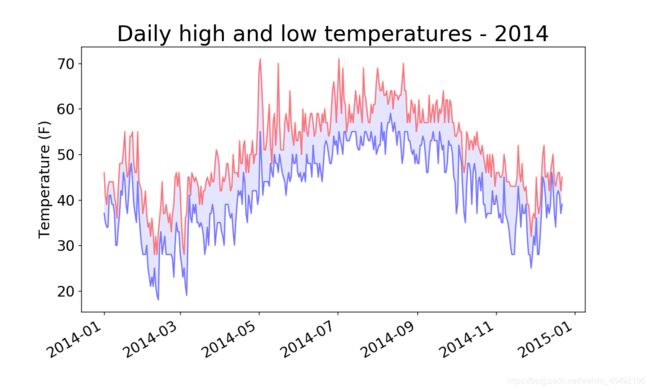
1.9 给图表区域着色
- 给图表做最后的修饰,着色呈现每天的气温范围
- 使用方法fill_between(),它接受一个x值系列和两个y值系列,并填充两个y值系列之间的空间
highs_lows.py
--snip--
# 根据数据绘制图形
fig = plt.figure(dpi=128, figsize=(10, 6))
plt.plot(dates, highs, c='red', alpha=0.5)
plt.plot(dates, lows, c='blue', alpha=0.5)
plt.fill_between(dates, highs, lows, facecolor='blue', alpha=0.1)
--snip--
- 实参alpha指定颜色透明度——0表示完全透明,1(默认值)表示不透明
- 实参facecolor指定了填充区域的颜色
1.10 错误检查
- 缺失数据可能会引发异常,如果不妥善地处理,还可能导致程序崩溃
- 我们来看看生成加利福尼亚死亡谷的气温图时出现的情况
- 将文件death_valley_2014.csv复制到本章程序所在的文件夹,再修改highs_lows.py,使其生成死亡谷的气温图
highs_lows.py
--snip--
# 从文件中获取日期 & 最高气温 & 最低气温
filename = 'death_valley_2014.csv'
with open(filename) as f:
--snip--
- 运行程序,出现了一个错误:

- traceback指出,Python无法处理其中一天的最高气温,因为它无法将空字符串(’ ')转换为整数
- 打开CSV文件,可以发现这个问题:

- 没有记录2014年2月16日的数据,表示最高温度的字符串为空
- 为解决这种问题,从CSV文件中读取值时执行错误检查代码,对分析数据集时可能出现的异常进行处理:
highs_lows.py
--snip--
# 从文件中获取日期 & 最高气温 & 最低气温
filename = 'death_valley_2014.csv'
with open(filename) as f:
    --snip--
    for row in reader:
        try:
            current_date = datetime.strptime(row[0], "%Y-%m-%d")
            high = int(row[1])
            low = int(row[3])
        except ValueError:
            print(current_date, 'missing data')
        else:
            dates.append(current_date)
            highs.append(high)
            lows.append(low)

# 根据数据绘制图形
--snip--
# 设置图形的格式
title = "Daily high and low temperatures - 2014\nDeath Valley, CA"
plt.title(title, fontsize=20)
--snip--
- 如果忘记
try-except-else代码块这部分了可以去Python:文件和异常这篇文章复习一下 - 运行highs_lows.py,发现缺失数据的日期就是这个

- 下面绘制出了图形

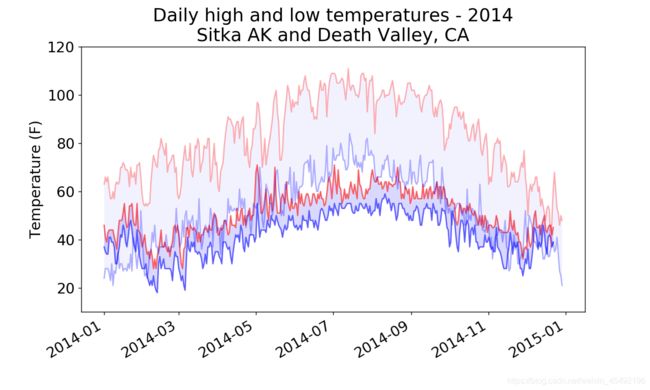
2 练习
- 比较锡特卡和死亡谷的气温: 在有关锡特卡和死亡谷的图表中,气温刻度反映了数据范围的不同。为准确地比较锡特卡和死亡谷地气温范围,需要在y轴上使用相同的刻度。为此请修改图16-5和图16-6所示图表的y轴设置,对锡特卡和死亡谷的气温范围进行直接比较。你还可以尝试在一个图表中呈现这两个数据集
solution:
- Tips1: The pyplot function ylim() allows you to set the limits of just the y-axis. If you ever need to specify the limits of the x-axis, there’s a corresponding xlim() function as well.
- Tips2: There are a number of ways you can approach plotting both data sets on the same chart. In the following solution, we put the code for reading the csv file into a function. We then call it once to grab the highs and lows for Sitka before making the chart, and then call the function a second time to add Death Valley’s data to the existing plot. The colors have been adjusted slightly to make each location’s data distinct.
import csv
from datetime import datetime
from matplotlib import pyplot as plt

def get_weather_data(filename, dates, highs, lows):
    with open(filename) as f:
        reader = csv.reader(f)
        header_row = next(reader)

        # dates, highs, lows = [], [], []
        for row in reader:
            try:
                current_date = datetime.strptime(row[0], "%Y-%m-%d")
                high = int(row[1])
                low = int(row[3])
            except ValueError:
                print(current_date, 'missing data')
            else:
                dates.append(current_date)
                highs.append(high)
                lows.append(low)

# Get weather data for Sitka.
dates, highs, lows = [], [], []
get_weather_data('sitka_weather_2014.csv', dates, highs, lows)

# Plot Sitka weather data.
fig = plt.figure(dpi=128, figsize=(10, 6))
plt.plot(dates, highs, c='red', alpha=0.6)
plt.plot(dates, lows, c='blue', alpha=0.6)
plt.fill_between(dates, highs, lows, facecolor='blue', alpha=0.15)

# Get Death Valley data.
dates, highs, lows = [], [], []
get_weather_data('death_valley_2014.csv', dates, highs, lows)

# Add Death Valley data to current plot.
plt.plot(dates, highs, c='red', alpha=0.3)
plt.plot(dates, lows, c='blue', alpha=0.3)
plt.fill_between(dates, highs, lows, facecolor='blue', alpha=0.05)

# 设置图形的格式
title = "Daily high and low temperatures - 2014"
title += "\nSitka AK and Death Valley, CA"
plt.title(title, fontsize=20)
plt.xlabel('', fontsize=16)
fig.autofmt_xdate()
plt.ylabel("Temperature (F)", fontsize=16)
plt.tick_params(axis='both', which='major', labelsize=16)
plt.ylim(10, 120)

plt.show()
Output: