RSI标志买方和卖方的相对力量强弱
R S I = 100 ∗ U P U P + D O W N RSI=100 * \frac{UP}{UP+DOWN} RSI=100∗UP+DOWNUP
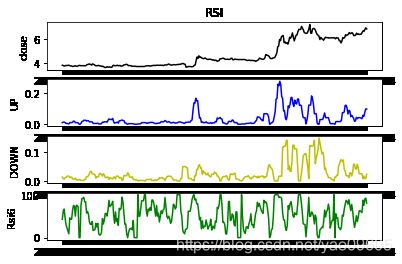
UP表示t期内股价上涨的平均值,DOWN表示t期内股价下跌的平均值
以交通银行为例进行分析
import pandas as pd
import numpy as np
import matplotlib.pyplot as plt
BOCM=pd.read_csv('BOCM.csv')
BOCM.index=BOCM.iloc[:,1]
BOCM=BOCM.iloc[:,2:]
BOCM.head()
|
Open |
High |
Low |
Close |
Volume |
| Date |
|
|
|
|
|
| 2014-01-02 |
3.82 |
3.84 |
3.80 |
3.82 |
57317900 |
| 2014-01-03 |
3.81 |
3.83 |
3.76 |
3.79 |
64039600 |
| 2014-01-06 |
3.79 |
3.79 |
3.72 |
3.75 |
73494700 |
| 2014-01-07 |
3.73 |
3.79 |
3.72 |
3.77 |
48477500 |
| 2014-01-08 |
3.77 |
3.84 |
3.76 |
3.80 |
47952000 |
BOCMclp=BOCM.Close
clprcChange=BOCMclp-BOCMclp.shift(1)
clprcChange=clprcChange.dropna()
clprcChange[0:6]
Date
2014-01-03   -0.03
2014-01-06   -0.04
2014-01-07    0.02
2014-01-08    0.03
2014-01-09   -0.01
2014-01-10    0.01
Name: Close, dtype: float64
indexprc=clprcChange.index
upPrc=pd.Series(0,index=indexprc)
upPrc[clprcChange>0]=clprcChange[clprcChange>0]
downPrc=pd.Series(0,index=indexprc)
downPrc[clprcChange<0]=-clprcChange[clprcChange<0]
rsidata=pd.concat([BOCMclp,clprcChange,upPrc,downPrc],axis=1)
rsidata.columns=['Close','PrcChange','upPrc','downPrc']
rsidata=rsidata.dropna()
rsidata.head()
/Users/yaochenli/anaconda3/lib/python3.7/site-packages/ipykernel_launcher.py:8: FutureWarning: Sorting because non-concatenation axis is not aligned. A future version
of pandas will change to not sort by default.

To accept the future behavior, pass 'sort=False'.

To retain the current behavior and silence the warning, pass 'sort=True'.
|
Close |
PrcChange |
upPrc |
downPrc |
| 2014-01-03 |
3.79 |
-0.03 |
0.00 |
0.03 |
| 2014-01-06 |
3.75 |
-0.04 |
0.00 |
0.04 |
| 2014-01-07 |
3.77 |
0.02 |
0.02 |
0.00 |
| 2014-01-08 |
3.80 |
0.03 |
0.03 |
0.00 |
| 2014-01-09 |
3.79 |
-0.01 |
0.00 |
0.01 |
SMUP=[]
SMDOWN=[]
for i in range(6,len(upPrc)+1):
SMUP.append(np.mean(upPrc.values[(i-6):i],dtype=np.float32))
SMDOWN.append(np.mean(downPrc.values[(i-6):i], dtype=np.float32))
rsi6=[100*SMUP[i]/(SMUP[i]+SMDOWN[i]) for i in range(0, len(SMUP))]
indexRsi=indexprc[5:]
Rsi6=pd.Series(rsi6,index=indexRsi)
Rsi6.head()
Date
2014-01-10    42.857141
2014-01-13    61.538465
2014-01-14    66.666665
2014-01-15    46.153845
2014-01-16    30.000001
dtype: float64
Rsi6.describe()
count    327.000000
mean      51.742495
std       27.787794
min        0.000000
25%       30.000001
50%       51.298706
75%       74.547477
max      100.000000
dtype: float64
UP=pd.Series(SMUP, index=indexRsi)
DOWN=pd.Series(SMDOWN,index=indexRsi)
plt.subplot(411)
plt.plot(BOCMclp,'k')
plt.xlabel('date')
plt.ylabel('close')
plt.title('RSI')
plt.subplot(412)
plt.plot(UP,'b')
plt.ylabel('UP')
plt.subplot(413)
plt.plot(DOWN,'y')
plt.ylabel('DOWN')
plt.subplot(414)
plt.plot(Rsi6,'g')
plt.ylabel('Rsi6')
plt.show()
RSI函数
def rsi(price,period=6):
    import pandas as pd
    clprcChange=price-price.shift(1)
    clprcChange=clprcChange.dropna()
    indexprc=clprcChange.index
    upPrc=pd.Series(0,index=indexprc)
    upPrc[clprcChange>0]=clprcChange[clprcChange>0]
    downPrc=pd.Series(0,index=indexprc)
    downPrc[clprcChange<0]=-clprcChange[clprcChange<0]
    rsidata=pd.concat([price,clprcChange,upPrc,downPrc],\
    axis=1)
    rsidata.columns=['price','PrcChange','upPrc','downPrc']
    rsidata=rsidata.dropna();
    SMUP=[]
    SMDOWN=[]
    for i in range(period,len(upPrc)+1):
        SMUP.append(np.mean(upPrc.values[(i-period):i],\
        dtype=np.float32))
        SMDOWN.append(np.mean(downPrc.values[(i-period):i],\
        dtype=np.float32))
        rsi=[100*SMUP[i]/(SMUP[i]+SMDOWN[i]) \
        for i in range(0,len(SMUP))]
    indexRsi=indexprc[(period-1):]
    rsi=pd.Series(rsi,index=indexRsi)
    return(rsi)
Rsi12=rsi(BOCMclp,12)
Rsi12.tail()
/Users/yaochenli/anaconda3/lib/python3.7/site-packages/ipykernel_launcher.py:11: FutureWarning: Sorting because non-concatenation axis is not aligned. A future version
of pandas will change to not sort by default.
To accept the future behavior, pass 'sort=False'.
To retain the current behavior and silence the warning, pass 'sort=True'.
# This is added back by InteractiveShellApp.init_path()
Date
2015-04-08 72.522525
2015-04-09 68.867922
2015-04-10 66.666665
2015-04-13 70.334930
2015-04-14 66.976744
dtype: float64
RSI天数差异
Rsi24=rsi(BOCMclp,24)
Rsi24.tail()
/Users/yaochenli/anaconda3/lib/python3.7/site-packages/ipykernel_launcher.py:11: FutureWarning: Sorting because non-concatenation axis is not aligned. A future version
of pandas will change to not sort by default.

To accept the future behavior, pass 'sort=False'.

To retain the current behavior and silence the warning, pass 'sort=True'.

  # This is added back by InteractiveShellApp.init_path()


Date
2015-04-08    72.522525
2015-04-09    68.867922
2015-04-10    66.666665
2015-04-13    70.334930
2015-04-14    66.976744
dtype: float64
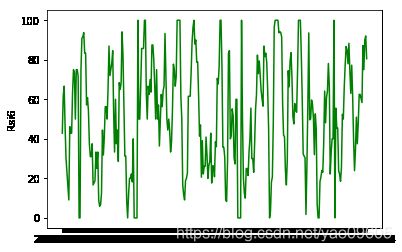
plt.plot(Rsi6,'g')
plt.ylabel('Rsi6')
Text(0, 0.5, 'Rsi6')
RSI的黄金交叉和死亡交叉
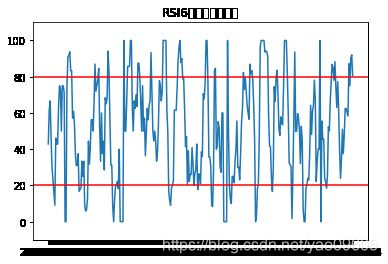
plt.plot(Rsi6)
plt.title('RSI6指标超买和超卖')
plt.ylim(-10,110)
plt.axhline(y=80,color='red')
plt.axhline(y=20,color='red')
plt.show()
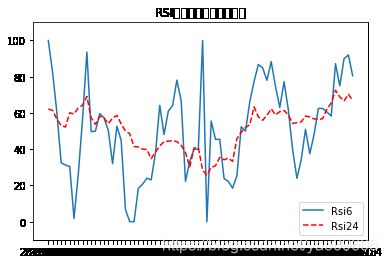
plt.plot(Rsi6['2015-01-03':],label="Rsi6")
plt.plot(Rsi24['2015-01-03':],\
label="Rsi24",color='red',\
linestyle='dashed')
plt.title("RSI的黄金交叉与死亡交叉")
plt.ylim(-10,110)
plt.legend()
交通银行实测
BOCM=pd.read_csv('BOCM.csv')
BOCM.index=BOCM.iloc[:,1]
BOCM.index=pd.to_datetime(BOCM.index, format='%Y-%m-%d')
BOCMclp=BOCM.Close
BOCMclp[0:4]
Date
2014-01-02    3.82
2014-01-03    3.79
2014-01-06    3.75
2014-01-07    3.77
Name: Close, dtype: float64
rsi6=rsi(BOCMclp,6)
rsi24=rsi(BOCMclp,24)
Sig1=[]
for i in rsi6:
if i>80:
Sig1.append(-1)
elif i<20:
Sig1.append(1)
else:
Sig1.append(0)
date1=rsi6.index
Signal1=pd.Series(Sig1,index=date1)
Signal1[Signal1==1].head(n=3)
Signal1[Signal1==-1].head(n=3)
Date
2014-02-11   -1
2014-02-12   -1
2014-02-13   -1
dtype: int64
Signal2=pd.Series(0,index=rsi24.index)
lagrsi6= rsi6.shift(1)
lagrsi24= rsi24.shift(1)
for i in rsi24.index:
    if (rsi6[i]>rsi24[i]) & (lagrsi6[i]<lagrsi24[i]):
        Signal2[i]=1
    elif (rsi6[i]<rsi24[i]) & (lagrsi6[i]>lagrsi24[i]):
        Signal2[i]=-1
signal=Signal1+Signal2
signal[signal>=1]=1
signal[signal<=-1]=-1
signal=signal.dropna()
tradSig=signal.shift(1)
ret=BOCMclp/BOCMclp.shift(1)-1
ret.head()
Date
2014-01-02         NaN
2014-01-03   -0.007853
2014-01-06   -0.010554
2014-01-07    0.005333
2014-01-08    0.007958
Name: Close, dtype: float64
ret=ret[tradSig.index]
buy=tradSig[tradSig==1]
buyRet=ret[tradSig==1]*buy
sell=tradSig[tradSig==-1]
sellRet=ret[tradSig==-1]*sell
tradeRet=ret*tradSig
plt.rcParams['font.sans-serif'] = ['SimHei']
plt.rcParams['axes.unicode_minus'] = False
plt.subplot(211)
plt.plot(buyRet,label="buyRet",color='g')
plt.plot(sellRet,label="sellRet",color='r',linestyle='dashed')
plt.title("RSI指标交易策略")
plt.ylabel('strategy return')
plt.legend()
plt.subplot(212)
plt.plot(ret,'b')
plt.ylabel('stock return')
/Users/yaochenli/anaconda3/lib/python3.7/site-packages/pandas/plotting/_converter.py:129: FutureWarning: Using an implicitly registered datetime converter for a matplotlib plotting method. The converter was registered by pandas on import. Future versions of pandas will require you to explicitly register matplotlib converters.

To register the converters:
	>>> from pandas.plotting import register_matplotlib_converters
	>>> register_matplotlib_converters()
  warnings.warn(msg, FutureWarning)


Text(0, 0.5, 'stock return')

def strat(tradeSignal,ret):
    indexDate=tradeSignal.index
    ret=ret[indexDate]
    tradeRet=ret*tradeSignal
    tradeRet[tradeRet==(-0)]=0
    winRate=len(tradeRet[tradeRet>0])/len(\
    tradeRet[tradeRet!=0])
    meanWin=sum(tradeRet[tradeRet>0])/len(\
    tradeRet[tradeRet>0])
    meanLoss=sum(tradeRet[tradeRet<0])/len(\
    tradeRet[tradeRet<0])
    perform={'winRate':winRate,\
    'meanWin':meanWin,\
    'meanLoss': meanLoss}
    return(perform)
BuyOnly=strat(buy,ret)
SellOnly=strat(sell,ret)
Trade=strat(tradSig,ret)
Test=pd.DataFrame({"BuyOnly":BuyOnly,\
        "SellOnly":SellOnly,"Trade":Trade})
Test
|
BuyOnly |
SellOnly |
Trade |
| meanLoss |
-0.009230 |
-0.028476 |
-0.019797 |
| meanWin |
0.012996 |
0.015883 |
0.014691 |
| winRate |
0.530612 |
0.569231 |
0.547826 |
cumStock=np.cumprod(1+ret)-1
cumTrade=np.cumprod(1+tradeRet)-1
plt.subplot(211)
plt.plot(cumStock)
plt.ylabel('cumStock')
plt.title('股票本身累计收益率')
plt.subplot(212)
plt.plot(cumTrade)
plt.ylabel('cumTrade')
plt.title('rsi策略累计收益率')
Text(0.5, 1.0, 'rsi策略累计收益率')

tradSig2=signal.shift(3)
ret2=ret[tradSig2.index]
buy2=tradSig[tradSig2==1]
buyRet2=ret2[tradSig2==1]*buy2
sell2=tradSig2[tradSig2==-1]
sellRet2=ret2[tradSig2==-1]*sell2
tradeRet2=ret2*tradSig2
BuyOnly2=strat(buy2,ret2)
SellOnly2=strat(sell2,ret2)
Trade2=strat(tradSig2,ret2)
Test2=pd.DataFrame({"BuyOnly":BuyOnly2,\
"SellOnly":SellOnly2,"Trade":Trade2})
Test2
|
BuyOnly |
SellOnly |
Trade |
| meanLoss |
-0.013085 |
-0.016942 |
-0.015167 |
| meanWin |
0.018347 |
0.017260 |
0.016922 |
| winRate |
0.523810 |
0.537313 |
0.537815 |
cumStock2=np.cumprod(1+ret2)-1
print(cumStock2[-1])
cumTrade2=np.cumprod(1+tradeRet2)-1
print(cumTrade2[-1])
0.809523809523808
0.29917157813927653
plt.subplot(211)
plt.plot(cumStock2)
plt.ylabel('cumStock2')
plt.title('股票本身累计收益率')
plt.subplot(212)
plt.plot(cumTrade2)
plt.ylabel('cumTrade2')
plt.title('修改rsi执行策略累计收益率')
Text(0.5, 1.0, '修改rsi执行策略累计收益率')
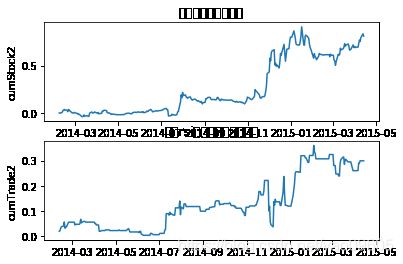
总结一下,股票原来的收益率是80% RSI的结果是29.9%,考虑2014到2015是牛市,可能出现该现象,需要分析更多数据来判断这个指标是否有效,以及指标的参数。


