《Python数据分析与挖掘实战》第6章——LM+CART
本文主要是对《Python数据分析与挖掘实战》中的第6章——电力窃漏电用户自动识别数据进行的分析。
旨在补充原文中的细节代码,并给出文中涉及到的内容的完整代码。
1 背景与目标分析
通过电力系统采集到的数据,提取出窃漏电用户的关键特征,构建窃漏电用户的识别模型。以实现自动检查、判断用户是否是存在窃漏电行为。
2 数据探索分析及数据预处理
2.1 数据特征分析
根据文中表6-4及6-5的用电电量数据,进行分析。
excelfile = pd.ExcelFile('pic.xlsx')
# 窃漏电用户的分布情况数据
usertype = excelfile.parse('usertype',encoding='utf-8')
# 正常用户用电周期性分析
data = excelfile.parse('Normal',encoding='utf-8')
# 非正常用户用电周期性分析
undata = excelfile.parse('Unnormal',encoding='utf-8')

usertype.set_index('types', inplace= True )
2.1.1 分布分析
myfont = mpl.font_manager.FontProperties(fname=r'C:\Windows\Fonts\simhei.ttf',size=18)  #微软雅黑字体
# 使用plot画图
# from matplotlib.font_manager import FontProperties
# font = FontProperties(fname=r'C:\Windos\Fonts\simhei.ttf', size=18)
fig = plt.figure()
usertype.plot(kind='bar')
plt.xlabel(u'用户类别',fontsize=12,fontproperties=myfont)
plt.ylabel(u'窃漏电用户数',fontsize=12,fontproperties=myfont)
plt.title(u'用户类别窃漏电情况',fontsize=16,fontproperties=myfont)
plt.xticks(rotation=0) # 将坐标进行旋转
plt.legend(loc='upper right',prop=myfont)
plt.savefig('usertypes.jpg')
plt.show()2.1.2 周期性分析
myfont1 = mpl.font_manager.FontProperties(fname=r'C:\Windows\Fonts\simhei.ttf', size = 15)  #微软雅黑字体

# 使用面向对象方法画图

fig  = plt.figure()
ax = fig.add_subplot(1,1,1)
ax.set_title(u"正常用户与窃漏电用电电量趋势对比", fontsize=18, fontproperties=myfont1)
# ax.set(xlabel=u'日期',ylabel=u'日用电量(KW)')
ax.set_xlabel(u'日期',fontsize=13, fontproperties=myfont1)
ax.set_ylabel(u'日用电量(KW)',fontsize=13, fontproperties=myfont1)

ax.xaxis.set_major_locator(mdates.DayLocator(bymonthday=range(1,32), interval=3))
ax.xaxis.set_major_formatter(mdates.DateFormatter("%Y-%m-%d"))
plt.subplots_adjust(bottom=0.13,top=0.95)
ax.plot(data[u'日期'],data[u'日用电量(KW)'])
ax.plot(undata[u'日期'],undata[u'日用电量(KW)'])
ax.legend(['normal','unnormal'],loc='best',prop=myfont1)
fig.autofmt_xdate() #自动根据标签长度进行旋转

'''for label in ax.xaxis.get_ticklabels():   #此语句完成功能同上
       label.set_rotation(45)
'''

plt.savefig('2.jpg')
plt.show()
2.2 数据质量分析
2.2.1 缺失值分析
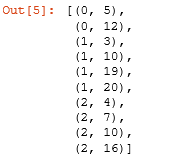
查看缺失情况
import pandas as pd
inputfile = 'missing_data.xls' #输入数据
data = pd.read_excel(inputfile, header=None)
# 判断DataFrame中的空值的位置
sij = []
for j in range(len(data.columns)):
    s1 = data[data.columns[j]].isnull()
    for i in range(len(s1)):
        if s1[i]==True:
            sij.append((j,i))
sij
此处提供了三种数据填充方法:
# 缺失值处理:补充缺失的数据
# 三种方法:Lagrange插值法和Newton插值法以及Series自带的interpolate
#1、Lagrange插值法和Newton插值法解决实际问题中关于只提供复杂的离散数据的函数求值问题,通过将所考察的函数简单化,构造关于离散数据实际函数f(x)的近似函数P(x),从而可以计算未知点出的函数值,是插值法的基本思路。
#2、实际上Lagrange插值法和Newton插值法是同一种方法的两种变形,其构造拟合函数的思路是相同的,而实验中两个实际问题用两种算法计算出结果是相同的。
#3、实验所得结果精确度并不高,一方面是因为所给数据较少,另一方面也是主要方面在Win32中C++中数据类型double精度只有7位,计算机在进行浮点运算时截断运算会导致误差。实际问题中,测量数据也可能导致误差。
#4、在解决实际问题中,更多是利用精确且高效的计算机求解。所以解决问题时不仅要构造可求解的算法,更重要是构造合理的可以编写成程序由计算机求解的算法,而算法的优化不仅可以节省时间空间,更能得到更为精确有价值的结果。
# <1> 拉格朗日插值法
# 自定义列向量插值函数
# s为列向量, n为被插值的位置, k为取前后的数据个数, 默认为5
from scipy.interpolate import lagrange #导入拉格朗日插值函数
data1 = pd.read_excel(inputfile, header=None,names=['A','B','C'])

def plotinterplate_columns(s, n, k=5):
    y = s[list(range(n-k,n) + list(range(n+1, n+1+k)))]
    y = y[y.notnull()]#剔除空值
    return lagrange(y.index, list(y))(n)#向位置n出插值并返回该插值结果

# 逐个判断每列是否需要插值
lagij = []
for i in data1.columns:
    for j in range(len(data1)):
        if (data1[i].isnull())[j]:
            data1[i][j] = plotinterplate_columns(data1[i],j)
            lagij.append((i,j,data1[i][j]))


print data1

data1.to_csv('lagrange.csv')
from pandas import Series
Series(lagij).to_csv('lagij.csv')
# <2> 牛顿插值法
import matplotlib.pyplot as plt
"""
@brief: 计算n阶差商 f[x0, x1, x2 ... xn]
@param: xi 所有插值节点的横坐标集合 o
@param: fi 所有插值节点的纵坐标集合 / \
@return: 返回xi的i阶差商(i为xi长度减1) o o
@notice: a. 必须确保xi与fi长度相等 / \ / \
b. 由于用到了递归,所以留意不要爆栈了. o o o o
c. 递归减递归(每层递归包含两个递归函数), 每层递归次数呈二次幂增长,总次数是一个满二叉树的所有节点数量(所以极易栈溢出)
"""
def get_order_diff_quot(xi = [], fi = []):
if len(xi) > 2 and len(fi) > 2:
return (get_order_diff_quot(xi[:len(xi) - 1], fi[:len(fi) - 1]) - get_order_diff_quot(xi[1:len(xi)], fi[1:len(fi)])) / float(xi[0] - xi[-1])
return (fi[0] - fi[1]) / float(xi[0] - xi[1])
"""
@brief: 获得Wi(x)函数;
Wi的含义举例 W1 = (x - x0); W2 = (x - x0)(x - x1); W3 = (x - x0)(x - x1)(x - x2)
@param: i i阶(i次多项式)
@param: xi 所有插值节点的横坐标集合
@return: 返回Wi(x)函数
"""
def get_Wi(i = 0, xi = []):
def Wi(x):
result = 1.0
for each in range(i):
result *= (x - xi[each])
return result
return Wi
"""
@brief: 获得牛顿插值函数
"""
def get_Newton_inter(xi = [], fi = []):
def Newton_inter(x):
result = fi[0]
for i in range(2, len(xi)):
result += (get_order_diff_quot(xi[:i], fi[:i]) * get_Wi(i-1, xi)(x))
return result
return Newton_inter
# 自定义列向量插值函数
# s为列向量, n为被插值的位置,k为取前后的数据个数, 默认为5
def plotnewton_columns(s):
y = s[s.notnull()]#剔除空值
Nx= get_Newton_inter(y.index, list(y)) #向位置n出插值并返回该插值结果
return Nx
import pandas as pd
from scipy.optimize import newton #导入牛顿插值函数
inputfile = 'missing_data.xls' #输入数据
data2 = pd.read_excel(inputfile, header=None,names=['A','B','C'])
newij = []
for i in data2.columns:
Newton = plotnewton_columns(data2[i])
for j in range(len(data1)):
if (data2[i].isnull())[j]:
data2[i][j] = Newton(j)
newij.append((i,j,data2[i][j]))
data2.to_csv('newton.csv')
from pandas import Series
Series(newij).to_csv('newij.csv')
newij# <3> Series自带的iterplote
data3=pd.read_excel('missing_data.xls',header=None,names=['A','B','C'])
###利用Pandas中interpolate进行缺失值的补充
data_out = data3.interpolate()
df = data_out - data3.fillna(0)
Serij = []
for i in df.columns:
for j in range(len(df)):
if df[i][j] != 0:
Serij.append((i,j,df[i][j]))
data_out.to_csv('Series.csv')
Series(Serij).to_csv('Serij.csv')
N_L_S = pd.concat([data1,data2,data_out],axis=1)
N_L_S.to_csv('nls.csv')## 比较三者的填充结果
N = pd.DataFrame(newij,columns = ['col', 'row', 'value'])
L = pd.DataFrame(lagij,columns = ['col', 'row', 'value'])
S = pd.DataFrame(Serij,columns = ['col', 'row', 'value'])
N.set_index(['col','row'],inplace = True)
L.set_index(['col','row'],inplace = True)
S.set_index(['col','row'],inplace = True)compare = pd.merge(N,pd.merge(L,S,left_index = True, right_index = True),left_index = True, right_index = True)
compare.rename(columns={'value':'Newton','value_x':'lagrange','value_y':'Series'},inplace= True)
compare.ix[:,:] = compare.ix[:,:].applymap(lambda x: '%.3f' % x) # 一旦执行这个操作,数据类型转成字符串型
# compare['Newton'] = compare['Newton'].astype('float64') # 这一句不能要,否则又恢复原样了
# compare = compare.round(3)# 此句话对科学计数法没起作用
compare.to_csv('compare.csv')
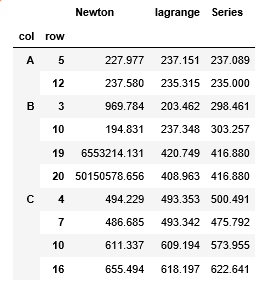
compare结果如下:
通过上述结果,可以发现,在此文中,牛顿插值法不适用,使用拉格朗日插值和Series自带的插值法效果更好。
3 模型构建
# 1> 数据划分 取20%做测试样本,剩下做训练样本

import pandas as pd
import numpy as np


dt = pd.read_excel('model.xls')
simpler = np.random.permutation(len(dt))
dt = dt.take(simpler) #导入随机函数shuffle,用来打乱数据 注意:不能用shuffle
dt = dt.as_matrix() #将表格转成矩阵格式


p=0.8 #设置训练集的比例
train = dt[:int(len(dt)*p), :] #前80%为训练集
test = dt[int(len(dt)*p):, :] #后20%为测试集
3.1 LM神经网络
#构建LM神经网络模型
from keras.models import Sequential #导入神经网络初始化函数
from keras.layers.core import Dense, Activation #导入神经网络层函数、激活函数

netfile = 'net.model' #构建的神经网络模型存储路径
net = Sequential() # 建立神经网络
net.add(Dense(input_dim = 3, output_dim = 10)) # 添加输入层(3节点)到隐藏层(10节点)的连接
net.add(Activation('relu')) # 隐藏层使用relu激活函数(通过实验确定的relu函数)
net.add(Dense(input_dim = 10, output_dim = 1)) # 添加隐藏层(10节点)到输出层(1节点)的连接
net.add(Activation('sigmoid')) # 输出层使用sigmoid激活函数
net.compile(loss = 'binary_crossentropy', optimizer = 'adam',metrics=None)#编译模型,用adam方法求解

net.fit(train[:,:3], train[:,3], nb_epoch=1000, batch_size=1)# 训练模型,循环1000次
net.save_weights(netfile) #保存模型

predict_result = net.predict_classes(train[:,:3]).reshape(len(train)) #预测类别结果变形
'''
注意:keras使用predict给出预测的概率,使用predict_classes给出预测类别,而且两者预测结果都是nx1维数组
'''
predict_result1 = net.predict(train[:,:3]).reshape(len(train)) #预测概率结果变形
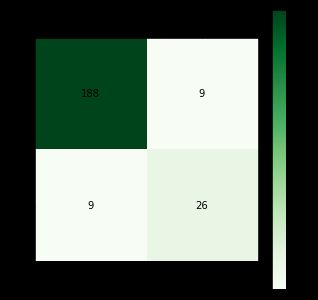
画混淆矩阵:
# 导入相关库,生成混淆矩阵
from sklearn.metrics import confusion_matrix
import matplotlib.pyplot as plt
plt.rc('figure',figsize=(5,5))

cm = confusion_matrix(train[:,3],predict_result)
plt.matshow(cm,cmap = plt.cm.Greens) # 背景颜色
plt.colorbar() # 颜色标签

# 内部添加图例标签
for x in range(len(cm)):
    for y in range(len(cm)):
        plt.annotate(cm[x,y], xy = (x,y), horizontalalignment = 'center', verticalalignment = 'center')
plt.ylabel('True Label')
plt.xlabel('Predicted Label')
plt.title('LM_train')
plt.savefig('confusionMatrix.jpg')
plt.show()
# 2.2> 计算预测正确率
# 利用混淆矩阵
from __future__ import division
correctRate = (cm[1,1] + cm[0,0]) / cm.sum()
print correctRate3.2 CART决策树
from sklearn.tree import DecisionTreeClassifier #导入决策树模型

treefile = 'tree.pkl' #模型输出名字
tree1 = DecisionTreeClassifier() # 建立决策树模型
tree1.fit(train[:,:3], train[:,3]) #训练

#保存模型, 当数据量比较大时,我们更希望把模型持久化的形式保存在磁盘文件中,而不是以字符串(string)的形式保存在内存中 (***)
from sklearn.externals import joblib
joblib.dump(tree1, treefile)

predict_CartResult = tree1.predict(train[:,:3]) # 使用predict给出预测类别,而且预测结果都是1xN维数组
画混淆矩阵
# 导入相关库,生成混淆矩阵
from sklearn.metrics import confusion_matrix
import matplotlib.pyplot as plt
plt.rc('figure',figsize=(5,5))

cm = confusion_matrix(train[:,3], predict_CartResult)
plt.matshow(cm,cmap = plt.cm.Blues) # 背景颜色
plt.colorbar() # 颜色标签

# 内部添加图例标签
for x in range(len(cm)):
    for y in range(len(cm)):
        plt.annotate(cm[x,y], xy = (x,y), horizontalalignment = 'center', verticalalignment = 'center')
plt.ylabel('True Label')
plt.xlabel('Predicted Label')
plt.title('Cart_train')
plt.savefig('confusionMatrix1.jpg')
plt.show()
# 3.2> 计算预测正确率
# 利用混淆矩阵
from __future__ import division
correctRate = (cm[1,1] + cm[0,0]) / cm.sum()
print correctRate交叉验证(十折)
from sklearn import model_selection
from sklearn.tree import DecisionTreeClassifier #导入决策树模型
alg = DecisionTreeClassifier() # 建立决策树模型
cv_result = model_selection.cross_validate(alg, train[:,:3], train[:,3], cv  = 10)
print(cv_result['test_score'].mean())
cv_result
3.3 模型评价
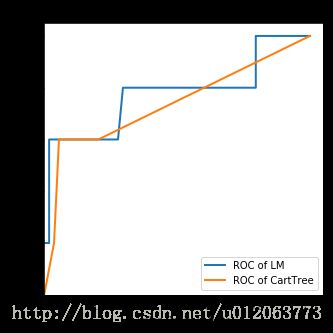
# 采用ROC曲线评价方法来测试评估模型分类的性能,一个优秀的分类器应该是尽量靠近左上角的

from sklearn.metrics import roc_curve # 导入ROC曲线
predict_result = net.predict(test[:,:3]).reshape(len(test)) #预测结果变形
fpr, tpr, thresholds = roc_curve(test[:,3], predict_result, pos_label=1)
plt.plot(fpr, tpr, linewidth=2, label='ROC of LM') #作出LM的ROC曲线

fpr1, tpr1, thresholds1 = roc_curve(test[:,3], tree1.predict_proba(test[:,:3])[:,1], pos_label=1)
plt.plot(fpr1, tpr1, linewidth=2, label = 'ROC of CartTree')#做出ROC曲线

plt.xlabel('False Positive Rate')
plt.ylabel('True Positive Rate')
plt.xlim(0,1.05)
plt.ylim(0,1.05)
plt.legend(loc=4)
plt.title('comparation of LM and CartTree')
plt.savefig('LOC.jpg')
plt.show()
备注:本章节所有代码见 点击打开链接


