数据分析上海长租房市场
数据分析上海长租房市场
- Python数据爬虫
- R语言数据处理
- 上海租房市场分析
目录
用 [TOC]来生成目录:
- 数据分析上海长租房市场
- 目录
- 前言
- 链家数据获取(Python)
- 上海租房市场数据可视化 (R语言)
- R资源包加载和数据录入
- 房价,面积,房龄的平均水平
- 变量间关系分析
- 结语
前言

不久前,CSDN微信公众号推送了一篇关于北京租房的文章,通过数据分析了链家网中北京租房的情况。本工程汪觉得这个话题非常有意思,加上本就刚刚来到上海,对魔都租房的体验有一番自身的理解,所以想通过数据分析还有个人经历与大家分享交流。
[附:北京房租大涨?6个维度,数万条数据帮你揭穿 作者:丁彦军]
链家数据获取(Python)
数据爬虫的方法上述文章已经详细介绍,代码附在下面,在此仅简略描述
Python的几package可以快速的扫描网页,并提取关键信息数据,这段script运行过程如下:

1. 选定根url进行搜索 (https://sh.lianjia.com/zufang)
2. 选择区域(浦东、闵行等)
3. 选定搜索页面(1,2,3…)
4. 提取关键信息(房租、面积、朝向等)
此代码有一处error,搜索最后一个区的时候会发生connection error,必须手动终止程序,sorry~
# -*- coding: utf-8 -*-
"""
Created on Sun Aug 26 17:37:24 2018

@author: sxl740
"""

import requests
import time
import re
from lxml import etree

# 获取某市区域的所有链接
def get_areas(url):
    print('start grabing areas')
    headers = {
        'User-Agent': 'Mozilla/5.0 (X11; Linux x86_64) AppleWebKit/537.36 (KHTML, like Gecko) Chrome/63.0.3239.108 Safari/537.36'}
    resposne = requests.get(url, headers=headers)
    content = etree.HTML(resposne.text)
    areas = content.xpath("//dd[@data-index = '0']//div[@class='option-list']/a/text()")
    areas_link = content.xpath("//dd[@data-index = '0']//div[@class='option-list']/a/@href")
    for i in range(1,len(areas)):
        area = areas[i]
        area_link = areas_link[i]
        link = 'https://sh.lianjia.com' + area_link
        print("开始抓取页面")
        get_pages(area, link)

#通过获取某一区域的页数,来拼接某一页的链接
def get_pages(area,area_link):
    headers = {
        'User-Agent': 'Mozilla/5.0 (X11; Linux x86_64) AppleWebKit/537.36 (KHTML, like Gecko) Chrome/63.0.3239.108 Safari/537.36'}
    resposne = requests.get(area_link, headers=headers)
    pages =  int(re.findall("page-data=\'{\"totalPage\":(\d+),\"curPage\"", resposne.text)[0])
    print("这个区域有" + str(pages) + "页")
    for page in range(1,pages+1):
        url = area_link + 'pg' + str(1)
#        url = 'https://sh.lianjia.com/zufang/xuhui/pg' + str(page)
        print("开始抓取" + str(page) +"的信息")
        get_house_info(area,url)

#获取某一区域某一页的详细房租信息
def get_house_info(area, url):
    headers = {
        'User-Agent': 'Mozilla/5.0 (X11; Linux x86_64) AppleWebKit/537.36 (KHTML, like Gecko) Chrome/63.0.3239.108 Safari/537.36'}
    time.sleep(2)
    try:
        resposne = requests.get(url, headers=headers)
        content = etree.HTML(resposne.text)
        info=[]
        for i in range(30):
            title = content.xpath("//div[@class='where']/a/span/text()")[i]
            room_type = content.xpath("//div[@class='where']/span[1]/span/text()")[i]
            square = re.findall("(\d+)",content.xpath("//div[@class='where']/span[2]/text()")[i])[0]
            position = content.xpath("//div[@class='where']/span[3]/text()")[i].replace(" ", "")
            try:
                detail_place = re.findall("([\u4E00-\u9FA5]+)租房", content.xpath("//div[@class='other']/div/a/text()")[i])[0]
            except Exception as e:
                detail_place = ""
            floor =re.findall("([\u4E00-\u9FA5]+)\(", content.xpath("//div[@class='other']/div/text()[1]")[i])[0]
            total_floor = re.findall("(\d+)",content.xpath("//div[@class='other']/div/text()[1]")[i])[0]
            try:
                house_year = re.findall("(\d+)",content.xpath("//div[@class='other']/div/text()[2]")[i])[0]
            except Exception as e:
                house_year = ""
            price = content.xpath("//div[@class='col-3']/div/span/text()")[i]
            with open('链家上海租房.txt','a',encoding='utf-8') as f:
                f.write(area + ',' + title + ',' + room_type + ',' + square + ',' +position+
                        ','+ detail_place+','+floor+','+total_floor+','+price+','+house_year+'\n')

            print('writing work has done!continue the next page')

    except Exception as e:
        print( 'ooops! connecting error, retrying.....')
        time.sleep(20)
        return get_house_info(area, url)


def main():
    print('start!')
    url = 'https://sh.lianjia.com/zufang'
    get_areas(url)


if __name__ == '__main__':
    main()
这个程序的output就是叫做一个“链家上海租房.txt”的文档文件,将其清理后转化为csv文件,数据清洗是个繁琐的过程,就不一一赘述了,需要我清理后的数据文件可以@我。一切处理好即可用R语言做进一步数据分析了。
上海租房市场数据可视化 (R语言)
R资源包加载和数据录入
在分析数据的过程中,我用到了以下资源包,如果你的IDE中没有它们,可以在RStudio中搜索并安装。
library(dplyr)
library(ggplot2)
library(cluster)
我将数据加载入名为df的数据帧(data frame),这个数据帧共有19972行,8列,每列数据分别记录了以下信息。注意将量化数据的格式改成数字(as.numeric)
- 房子面积:单位平方米
- 房子所在楼层数
- 房租金额:单位RMB
- 建成年份:例如1990
- 区域:浦东、闵行等
- 房子所在楼层类型:低、中、高
- 房子厅的数量
- 房子室的数量
# 加载数据
df <- read.csv("Lianjia-Shanghai-Rent.csv")
# 列举数据帧大小,数据内容
dim(df)
str(df)
# 改变数据格式为数字
df$TotalArea <- as.numeric(df$TotalArea)
df$Floor <- as.numeric(df$Floor)
df$Rent <- as.numeric(df$Rent)
df$YearBuilt <- as.numeric(df$YearBuilt)
df$Halls <- as.numeric(df$Halls)
df$Rooms <- as.numeric(df$Rooms)![]()

清理一下数据,排除缺失的信息后,加入一列新的维度,房屋使用年数,即建成年份至今的时间。
df <- df %>% filter(Floor.Lev != "????")
df <- df %>% filter(!is.na(YearBuilt))
df <- df %>% mutate(房屋使用年数=2018-YearBuilt)
房价,面积,房龄的平均水平
根据以上信息,R语言的ggplot与dplyr可以帮助我们完成可视化数据分析
# 上海市各区长租房平均房租
df %>% group_by(District) %>% summarise(平均房租 = mean(Rent)) %>%
  ggplot( aes(x = reorder(District,平均房租), y = 平均房租)) +
  geom_bar(stat="identity", fill = "steelblue") +
  labs(title="上海市各区长租房平均房租", x="区域", y = "月房租(¥)") + coord_flip()
依照上图,在所有的房子中(不分面积,建成年份),静安区的租金均价是最高的,其次为徐汇区和长宁区,奉贤区和金山区离市中心最远,也难怪那边的租金均价最低。
# 上海市各区长租房平均面积
df %>% group_by(District) %>% summarise(平均面积 = mean(TotalArea)) %>%
  ggplot( aes(x = reorder(District,平均面积), y = 平均面积)) +
  geom_bar(stat="identity", fill = "steelblue") +
  labs(title="上海市各区长租房平均面积", x="区域", y = "公寓面积(平方米)") + coord_flip()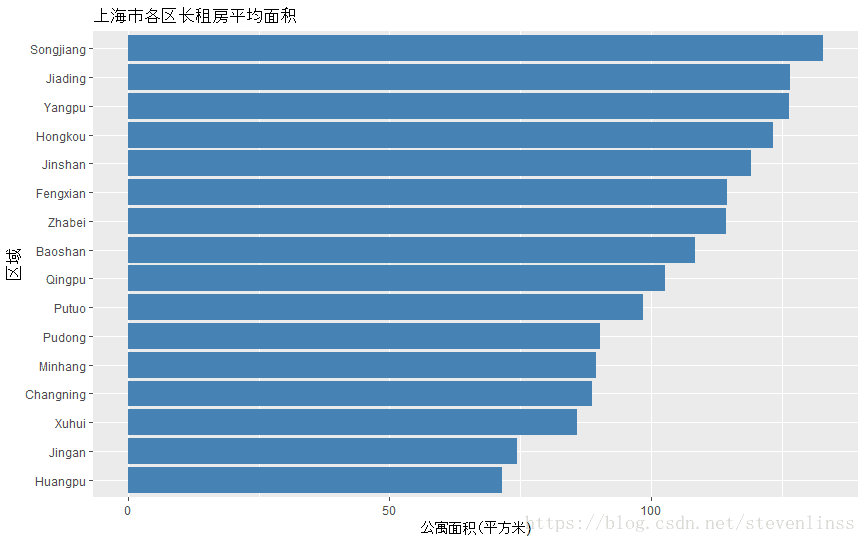
上图为我们展示了各区长租房的平均面积,黄埔,静安,徐汇和长宁是平均面积最小的几个区域,但是他们的房租却是最贵的。而相反的,松江,嘉定还有杨浦的大房子还是蛮多的,看起来经济实惠,所以我们一起来看看平均单位房租(¥/平米)的比较。
# 上海市各区长租房平均单位房租
df %>% group_by(District) %>% summarise(平均单位房租 = mean(Rent)/mean(TotalArea)) %>%
  ggplot( aes(x = reorder(District,平均单位房租), y = 平均单位房租)) +
  geom_bar(stat="identity", fill = "steelblue") +
  labs(title="上海市各区长租房平均单位房租", x="区域", y = "平均单位房租(¥/平方米)") + coord_flip()
静安,黄埔,徐汇和长宁在对比中明显比其他区域贵出不少,看来不是适合我这种职场菜鸟住的地方咯。
# 上海市各区长租房平均房龄
df %>% group_by(District) %>% summarise(平均房龄 = mean(房屋使用年数)) %>%
  ggplot( aes(x = reorder(District,平均房龄), y = 平均房龄)) +
  geom_bar(stat="identity", fill = "steelblue") +
  labs(title="上海市各区长租房平均房龄", x="区域", y = "平均房龄(年)") + coord_flip()
至于房龄,市中心区域的房子都比较老,而周边嘉定,松江等开发区域房子会新很多。
变量间关系分析
首先,我用一个多维的图像了解了长租房的数据分布
# 多维度租房信息
ggplot(data = df, aes(x = TotalArea, y = Rent, size = 房屋使用年数)) +
  geom_point(alpha = 0.01) +
  labs(title="上海各种面积公寓的房租情况", x="公寓面积(平方米)", y = "月房租(¥)") +
  scale_color_brewer(palette="Dark2") + theme_classic()
上图中圆圈大小代表房屋使用年数,圈越大说明房子越老。总体来看,租金与房子面积成正比,大的房子租金确实会更贵一些。但是这个说法并不严谨,因为还是有很多经济实惠又面积大的房子,它们大多都在100平米以上。100平米以上的长租房,平均使用年数是17.50年,相比之下,那些小的长租房则新出很多,平均使用年数仅为13.67年。
# 房屋使用年数对比:100平米以上房子 vs 100平米及以下房子
df%>%filter(TotalArea>100)%>%summarise(mean(房屋使用年数))
df%>%filter(TotalArea<=100)%>%summarise(mean(房屋使用年数))
以上数据说明存在潜变量,房屋使用年数、楼层等因素都会影响租金。因此,利用租金、面积、房屋使用年和楼层数将全部数据进行分组 K-Means Clustering
# 这组数据中可能有潜变量Latent Variable
# 利用K-Means Clustering分组
set.seed(20)
irisCluster <- kmeans(df[, c(1,2,3,9)], 2, nstart = 20)
df$cluster <- as.factor(irisCluster$cluster)
ggplot(data = df %>% filter(TotalArea < 200), aes(x = TotalArea, y = Rent, color = cluster)) +
  geom_point() + geom_smooth(method=lm) +
  labs(title="上海各种面积公寓(< 100平方米)的房租情况", x="公寓面积(平方米)", y = "月房租(¥)") +
  scale_color_brewer(palette="Dark2") + theme_classic()
分组过后,可以看出高端房与平价房的区别。高端房的月租金与面积有很强的正比关系,而低端房源房价则不怎么受面积影响,这个价位的房型的面积分布很广,且对房价影响不大。
最后来特别关注一下小编这类租房用户,收入一般的职场菜鸡,在大上海有很多人房租预算在5000¥以下,在此作一个假设,考虑到合租的情况,所以人均房租的计算是通过月房租处以房间数得到的。
# 加入人均房租的数据
# 假设:人均房租 = 月租金 / 房间数
df$RentPerPerson <- df$Rent / df$Rooms
focus <- df %>% filter(RentPerPerson <= 5000)
符合条件的长租房只剩下8387个,这其中大多数都是一居室和两居室的房子,所以想要独居或者合租的小伙伴还是有很多选择的。
# 5000¥以下长租房中房间数分布
focus %>% group_by(Rooms) %>% summarise(amount = n()) %>%
  ggplot(aes(x="", y = amount, fill = factor(Rooms))) + geom_bar(width = 0.5, stat = "identity") +
  coord_polar("y", start=0) +
  labs(title="月租金5000¥以下长租房中房间数分布", x="", y = "")
小编比较习惯的一居室房源中,价格分布也是因区而异,总体上3000 - 4000元的一居室房源较多。
# 月租金5000¥以下一居室长租房租金分布
focus %>% filter(Rooms==1) %>%
  ggplot(aes(x = RentPerPerson)) +
  geom_density(aes(group=District, colour = District, fill = District), alpha = 0.3) +
  labs(title="月租金5000¥以下一居室长租房租金分布", x="月租金(¥)", y = "密度")
结语
今天的分享就到这里了,第一次写CSDN blog,希望大家多多讨论。也感谢来自父母和女朋友的支持,让我在找工作之余有了更多和大家交流学习的机会。
