信贷数据分析及贷前风险评估建模
场景解析
首先我到lengdingclub公司官网下载了2017年4个季度的贷款数据,18,19年的数据没有下载(后面会有解释)
数据获取地址:https://www.lendingclub.com/info/download-data.action(因为是美国的一家P2P公司,所以该链接需要才可以访问,可以下载到该公司近10年左右的贷款数据)
- 拿到这份数据之后我主要做了下面两个方面的工作:
①探索性数据分析及可视化②建立风险模型用于预测申请人能否及时还款 - 分析数据,数据为非结构化数据,需要做特征类型转换,数据规格也相差悬殊,需要对其做特征缩放,将特征缩放至同一个规格,在数据质量方面,出现了大量的空值,可以确定字段loan_status为目标列,其他列为特征列。
一、读取数据
我用的是jupyter notebook,为了美观,部分out展示的内容我会直接复制在代码中
import numpy as np
import pandas as pd
pd.set_option('display.float_format', lambda x: '%.4f' % x)#防止数据显示使用科学计数法
from pandas import Series,DataFrame
import os
import matplotlib.pyplot as plt
plt.style.use("ggplot")
%matplotlib inline
import seaborn as sns
sns.set(font="SimHei")
plt.rcParams['font.sans-serif'] = ['SimHei']  # 指定默认字体
import warnings
warnings.filterwarnings('ignore')
list_data = os.listdir("./data")
list_data
['LoanStats_2017Q1.csv',
 'LoanStats_2017Q2.csv',
 'LoanStats_2017Q3.csv',
 'LoanStats_2017Q4.csv']
LoanStats_2017Q1 = pd.read_csv("./data/LoanStats_2017Q1.csv",skiprows=1,low_memory=False)
LoanStats_2017Q2 = pd.read_csv("./data/LoanStats_2017Q2.csv",skiprows=1,low_memory=False)
LoanStats_2017Q3 = pd.read_csv("./data/LoanStats_2017Q3.csv",skiprows=1,low_memory=False)
LoanStats_2017Q4 = pd.read_csv("./data/LoanStats_2017Q4.csv",skiprows=1,low_memory=False)
data_to_concat = [LoanStats_2017Q1,LoanStats_2017Q2,LoanStats_2017Q3,LoanStats_2017Q4]
查看各个季度的数据量
for i in data_to_concat:
    print(i.shape)
(96781, 144)
(105453, 144)
(122703, 144)
(118650, 144)
数据纵向级联
loan_data = pd.concat(data_to_concat,ignore_index=True)#ignore_index=True级联之后的数据不保留原先的下标
loan_data.head()
查看数据规模
loan_data.shape
(443587, 144)
二、探索性数据分析
2.1.检查缺失值数量以及每列缺失值的百分比
# 构建计算缺失值数量的函数
def missing_values_table(df):
    # 每列总缺失值数量
    mis_val = df.isnull().sum()

    # 缺失值的百分比
    mis_val_percent = 100*df.isnull().sum() / len(df)

    # 将结果级联成一个表格
    mis_val_table = pd.concat([mis_val,mis_val_percent],axis=1)

    # 给表格的列重命名
    mis_val_table = mis_val_table.rename(columns = {0 : "缺失值数量", 1 : "缺失值占比"})

    # 按照缺失值占比降序排序
    mis_val_table = mis_val_table[mis_val_table.iloc[:,1] != 0].sort_values("缺失值占比", ascending=False).round(1)

    # 打印一些总结信息
    print("输入的对象一共有" + str(df.shape[1]) + "个特征.\n"
         "其中一共有" + str(mis_val_table.shape[0]) + "个特征具有缺失值.")

    # 返回缺失值表格
    return mis_val_table
将数据放入函数查看缺失值
mis_val_table = missing_values_table(loan_data)
mis_val_table.head(10)
输入的对象一共有144个特征.
其中一共有144个特征具有缺失值.
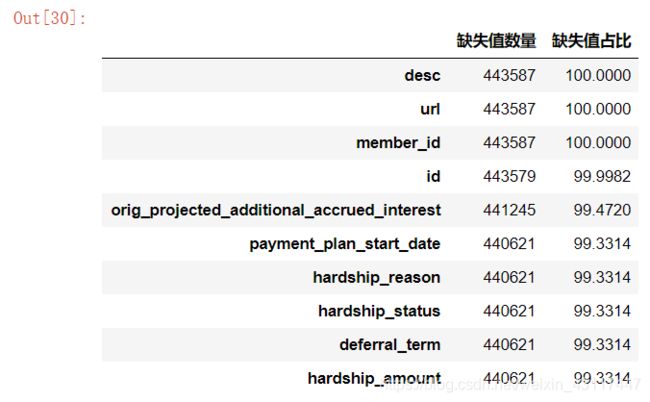
# 找出缺失值在40%以上的列
columns_missing_40 = list(mis_val_table[mis_val_table.iloc[:,1] > 40].index)
len(columns_missing_40)
43
可以看出有43列特诊缺失值在40%以上,我们把这些缺失值过多的列删除
# 删除缺失值大于40%的列
loan_data = loan_data.drop(columns_missing_40, axis=1)
loan_data.shape
(443587, 101)
# 删除缺失值大于50%的行
na1 = loan_data.shape[1]/2
loan_data = loan_data.dropna(thresh=na1,axis=0)
loan_data.shape
(443579, 101)
发现只少了8条数据,说明行数据比较完整
#再次检查缺失值分布
mis_val_table = missing_values_table(loan_data)
mis_val_table
# 将初步处理的数据存入csv
loan_data.to_csv("./loan_data2017.csv",index=False)
# 读取新的csv文件
loan_data = pd.read_csv("./loan_data2017.csv")
loan_data.head()
2.2.查看数据类型
loan_data.dtypes.value_counts()
float64    77
object     24
dtype: int64
loan_data.describe()
数据集属性较多,初步聚焦几个重要特征展开分析
2.3.单变量分析
贷款状态分布
loan_data["loan_status"].value_counts()
Current               257574
Fully Paid            134159
Charged Off            40101
Late (31-120 days)      7687
In Grace Period         1950
Late (16-30 days)       1823
Default                  285
Name: loan_status, dtype: int64
可以发现有7个目标类
其中:
Current 正常还款,由于用是17年的数据,这部分贷款已经正常还款近2年,默认为正常贷款
Fully Paid 完全付清
Charged Off 违约
Late (31-120 days) 贷款延迟
In Grace Period 宽限期
Late (16-30 days) 贷款延迟
Default 超过120天未还款
# 其中处于宽限期的不确实是否违约,且数据量较少,这里选择删除
loan_data = loan_data[loan_data["loan_status"] != "In Grace Period"]
# 对剩下的六类重新分类,正常为0,违约为1
status_replace = {
    "loan_status" : {"Current":0,
                     "Fully Paid": 0,
                     "Charged Off": 1,
                     "Late (31-120 days)":1,
                     "Late (16-30 days)":1,
                     "Default":1}
}
loan_data = loan_data.replace(status_replace)
查看贷款状态分布
value_count = loan_data["loan_status"].value_counts()
value_count
0    391733
1     49896
Name: loan_status, dtype: int64
可视化贷款状态
plt.style.use("ggplot")
plt.figure(figsize=(16,8))
# 画饼状图
ax = plt.subplot(1,2,1)
value_count.plot(kind = 'pie', autopct = "%0.3f%%", title="贷款状态分布", fontsize=16)
# 柱状图
ax = plt.subplot(1,2,2)
value_count.plot(kind = 'bar',fontsize=16,rot=0)
plt.savefig("./picture/贷款状态分布")

从上图及上面的数据可以看出:
1.2017年公司贷款不良率达到了11.298%;
2.此列数据将作为建模的标签,数据属于不平衡数据集,在后面的建模过程中将对这个问题进行处理
2.3.2 贷款金额分布
loan_data["loan_amnt"].describe()
count   441629.0000
mean     14835.9854
std       9630.7593
min       1000.0000
25%       7200.0000
50%      12000.0000
75%      20000.0000
max      40000.0000
Name: loan_amnt, dtype: float64
plt.figure(figsize=(16, 8))
sns.set(font="SimHei")
sdisplot_loan = sns.distplot(loan_data['loan_amnt'] )
plt.xticks(rotation=90,fontsize=14)
plt.xlabel('Loan amount',fontsize=16)
plt.title('贷款金额分布',fontsize=16)
sdisplot_loan.figure.savefig('./picture/贷款金额分布')

由上图及数据可以看出,平台贷款呈现偏右正态分布,贷款金额最小值为1000美元,最大值为40,000美元,贷款金额主要集中在10,000美元左右,中位数为12,000美元,可以看出平台业务主要以小额贷款为主。
2.3.3 贷款期限分布
term_count = loan_data["term"].value_counts()
term_count
36 months    319194
 60 months    122435
Name: term, dtype: int64
plt.style.use("ggplot")#虽然之前设置过样式,不过这里没生效,再加载一次即可
plt.figure(figsize=(16,8))
ax = plt.subplot(1,2,1)
term_count.plot(kind = 'pie', autopct = "%0.3f%%", title="贷款期限分布",fontsize=16)
# 柱状图
ax = plt.subplot(1,2,2)
term_count.plot(kind = 'bar',fontsize=16)
plt.savefig("./picture/贷款期限分布")
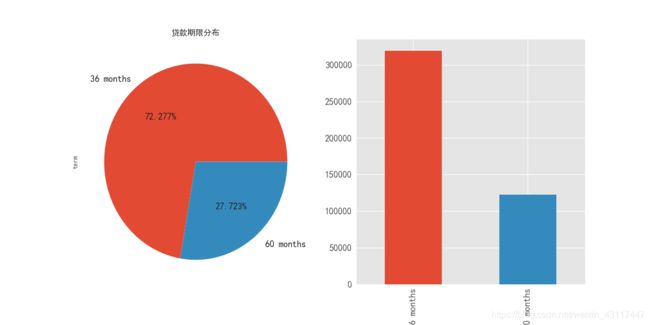
平台贷款产品期限分为36个月和60个月两种,其中贷款期限为60个月的贷款占比为27.723%,贷款期限为36个月的贷款占比为72.277%。一般来说贷款期限越长,不确定性越大,违约的可能性更大,期限较长的贷款产品风险越高 。从期限角度看,平台风险偏小的资产占大部分。
2.3.4 贷款用途分析
purpose_count = loan_data["purpose"].value_counts()
purpose_count
debt_consolidation    243897
credit_card            91137
home_improvement       34544
other                  32942
major_purchase         11084
medical                 6859
car                     5338
small_business          4903
vacation                4014
moving                  3629
house                   2990
renewable_energy         290
educational                1
wedding                    1
Name: purpose, dtype: int64
plt.figure(figsize=(18, 9))
ax = sns.countplot(x="purpose", data=loan_data)
ax.set(yscale = "log")#因为各用途数量相差悬殊,用科学计数比较美观
plt.yticks(fontsize=25)
plt.xticks(rotation=90,fontsize=20)
plt.title('贷款用途',fontsize=24)
plt.show()
ax.figure.savefig("./picture/贷款用途分析")
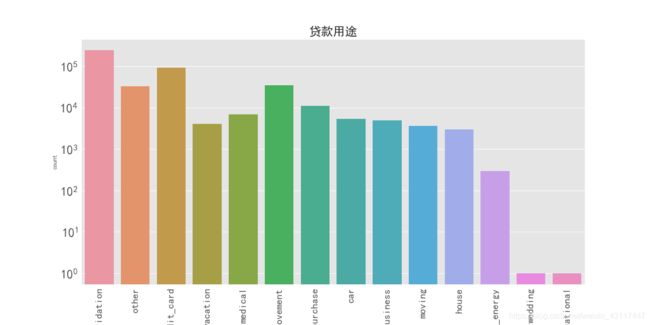
可以看出该平台贷款用途最多的为债务重组(借新债还旧债),其次是信用卡还款,第三是住房改善。一般来说,贷款用途为债务重组和信用卡还款的客户现金流较为紧张,此类客户也是在传统银行渠道无法贷款才转来P2P平台贷款,这部分客户的偿还贷款能力较弱,发生违约的可能性较高。
2.3.5 客户信用等级占比
grade_count = loan_data["grade"].value_counts()
grade_count
C    144373
B    132705
A     78660
D     56285
E     19994
F      6181
G      3431
Name: grade, dtype: int64
plt.rcParams['font.sans-serif'] = ['SimHei']  # 指定默认字体
plt.figure(figsize=(8, 8))
grade_count.plot(kind="pie",autopct = "%0.3f%%", title="客户信用等级占比",fontsize=14,colormap="Accent")
plt.savefig("picture/客户信用等级占比")

Lending Club平台对客户的信用等级分7类,A~G,信用等级为A的客户信用评分最高,信用等级为G的客户最低.目前,平台客户信用等级占比较多的客户为C类,其次是B类和A类,三者合计占比超过80%。此外信用等级为E、F、G类的客户占比不到7%。可以看出Lending Club授信部门对申请人的资信情况把关较严。
2.3.6 贷款利率分布
在分析之前,由于%的存在需要将利率进行类型转换
loan_data['int_rate'] = loan_data['int_rate'].str.rstrip('%').astype('float')/100
# 异常值检测
loan_data['int_rate'].describe()
count   441629.0000
mean         0.1323
std          0.0519
min          0.0532
25%          0.0993
50%          0.1262
75%          0.1599
max          0.3099
Name: int_rate, dtype: float64
plt.figure(figsize=(16, 8))
int_rate = sns.distplot(loan_data['int_rate'] )
plt.xticks(rotation=90)
plt.xlabel('Interest Rate',fontsize=20)
plt.title('贷款利率分布',fontsize=20)
int_rate.figure.savefig("./picture/利率分布图")

平台贷款利率呈现右偏正态分布,利率中位数为12.6%,最高达到了30.9%
2.4多变量分析
2.4.1 贷款量与时间的关系
time_amout = loan_data[["issue_d","loan_amnt"]]
time_amout.head()
# 查看时间数据类型
time_amout.dtypes
issue_d       object
loan_amnt    float64
dtype: object
# 这里需要将issue_d转换为时间类型
time_amout["issue_d"] = pd.to_datetime(time_amout['issue_d'])
# 查看时间数据类型
time_amout.dtypes
issue_d      datetime64[ns]
loan_amnt           float64
dtype: object
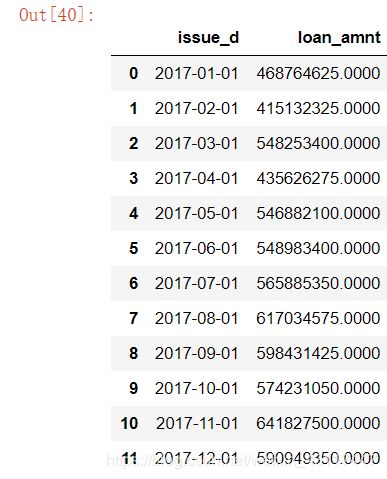
amount_groupby_date = time_amout.groupby(["issue_d"]).sum().reset_index()
amount_groupby_date
amount_groupby_date["issue_month"] = amount_groupby_date["issue_d"].apply(lambda x: x.to_period('M'))
amount_groupby_date
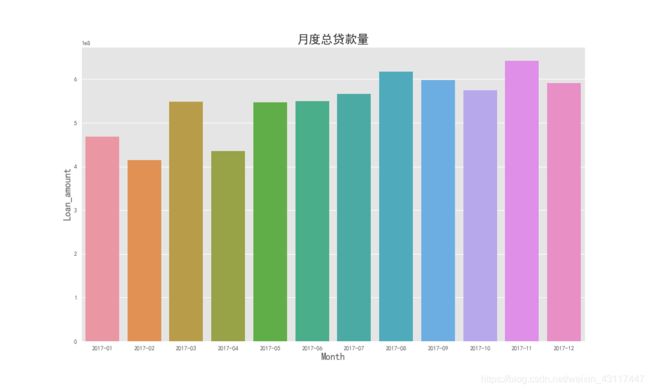
# 结果可视化
plt.figure(figsize=(15, 9))
plot1 = sns.barplot(x="issue_month", y="loan_amnt", data = amount_groupby_date)
plt.xlabel('Month',fontsize = 16)
plt.ylabel('Loan_amount',fontsize = 16)
plt.title("月度总贷款量", fontsize = 20)
plot1.figure.savefig("./picture/2017年月度贷款量")
2.4.2 贷款期限与利率的关系
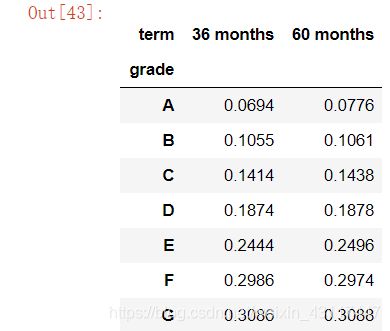
groupby_grade_term = loan_data.groupby(["grade","term"])["int_rate"].mean().unstack()
groupby_grade_term
# 绘图进行可视化展示
f,ax1=plt.subplots(figsize=(16,9))
groupby_grade_term.plot(kind="bar",ax = ax1,rot = 0,fontsize=16)
plt.title('各信用等级贷款利率',fontsize=20)
ax1.set_xlabel('信用评级',fontsize=16)
ax1.set_ylabel('利率',fontsize=16)
ax1.legend(fontsize=16)
ax1.figure.savefig("./picture/各信用等级贷款利率情况")

从上图及表格可以看出:
1.该平台利率最高为30.8%,最低接近7%,总体利率相对传统银行高;
2.信用评级越高,违约发生的可能性将越低,因此利率也更低;
3.从贷款期限角度来看,期限长的相对来说利率高了一点点.
2.4.3贷款金额与利率的关系
plt.figure(figsize=(16,8))
jointplot = sns.jointplot("loan_amnt", "int_rate", data = loan_data, kind = "reg", size=10)
jointplot.savefig("./picture/贷款金额与利率关系图")
2.4.4 工作年限与违约率的关系
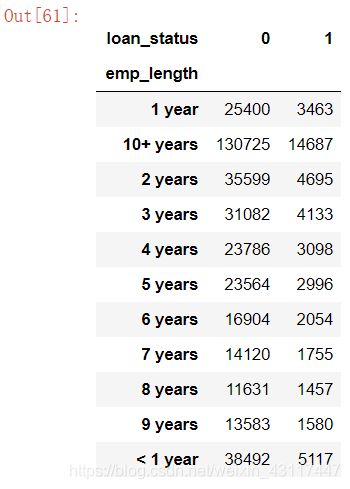
emp_length_status = loan_data.groupby(["emp_length","loan_status"])["loan_status"].count().unstack()
emp_length_status
emp_length_status = loan_data.groupby(["emp_length","loan_status"])["loan_status"].count().unstack()
emp_length_status = emp_length_status.reindex(index=["< 1 year","1 year","2 years","3 years","4 years","5 years",
                                                     "6 years","7 years","8 years","9 years","10+ years"])
emp_length_status
# 计算违约率
emp_length_status["DefaultedRate"] = emp_length_status[1]/(emp_length_status[1]+emp_length_status[0])
emp_length_status
# 查看绘图风格种类
plt.style.available
['bmh',
 'classic',
 'dark_background',
 'fast',
 'fivethirtyeight',
 'ggplot',
 'grayscale',
 'seaborn-bright',
 'seaborn-colorblind',
 'seaborn-dark-palette',
 'seaborn-dark',
 'seaborn-darkgrid',
 'seaborn-deep',
 'seaborn-muted',
 'seaborn-notebook',
 'seaborn-paper',
 'seaborn-pastel',
 'seaborn-poster',
 'seaborn-talk',
 'seaborn-ticks',
 'seaborn-white',
 'seaborn-whitegrid',
 'seaborn',
 'Solarize_Light2',
 '_classic_test']
# 可视化结果
plt.style.use("ggplot")#此处试验过几次,需要再次设置才会有效果
f,ax1=plt.subplots(figsize=(16,8))
ax1.set(yscale = "log")
emp_length_status[[0,1]].plot(kind="bar",ax = ax1,rot = 0,fontsize=12)
ax2=ax1.twinx()
plt.style.use("seaborn-white")# 由于ggplot默认有背景网格,画违约率刻度时选用此模式可避免重复网格,影响图片美观
plt.rcParams['font.sans-serif'] = ['SimHei']  # 指定默认字体(图片风格变化之后需重新设置中文)
emp_length_status["DefaultedRate"].plot(ax = ax2,style='r.-',fontsize=14)
plt.title('工作年限与违约率关系图',fontsize=20)
ax1.set_xlabel('工作年限',fontsize=16)
ax1.set_ylabel('数量',fontsize=16)
ax2.set_ylabel('违约率',fontsize=16)
ax2.legend(loc=9,fontsize=14)
ax1.legend(loc=1,fontsize=14)
plt.savefig("./picture/工作年限与违约率关系图")
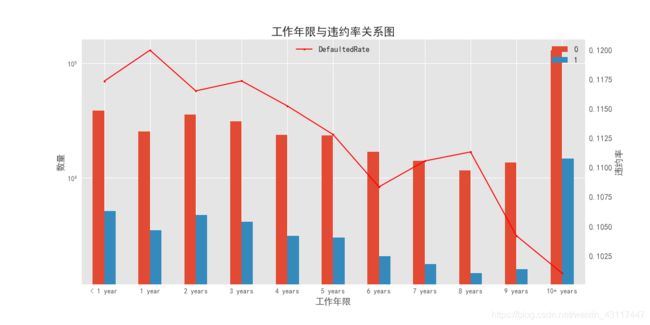
由上图可以看出:
1.总体上来看,工作年限越长,违约率越低,不过从数值上来看违约率相差不是特别大;
2.该平台工作超过10年以上的贷款人数最大,可以看出该平台偏向借贷于此类人群.
2.4.5 年收入对贷款状态的影响
其中verification_status表示年收入是否被核实,在这里我们需要将经过核实的年收入筛选出来进行分析
# verification_status收入是否经过核实
loan_data["verification_status"].value_counts()
Source Verified    170807
Not Verified       158170
Verified           112652
Name: verification_status, dtype: int64
# 选取年收入经过核实的的数据
annual_inc_data = loan_data[['loan_status', 'annual_inc', "verification_status"]]
annual_inc_data = annual_inc_data[annual_inc_data["verification_status"] != "Not Verified"][["loan_status","annual_inc"]]
annual_inc_data.head()
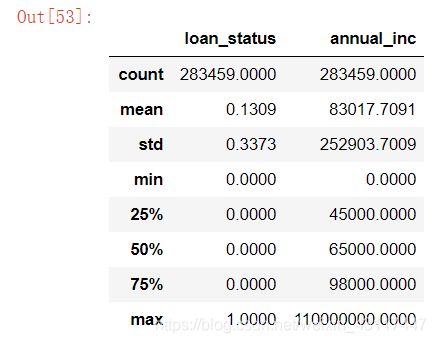
# 查看年收入分布,用于确定分段标准
annual_inc_data.describe()
# 分段标准
to_bins = np.array([-1,25000,50000,75000,100000,150000,200000,200000000])
# 给年收入分段
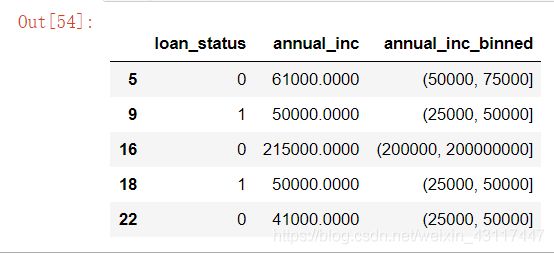
annual_inc_data["annual_inc_binned"] = pd.cut(annual_inc_data["annual_inc"], bins = to_bins)
annual_inc_data.head()
# 使用groupby来统计数量
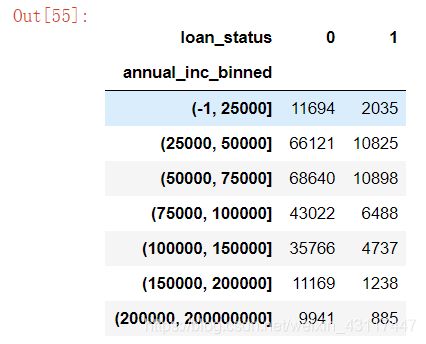
annual_group = annual_inc_data.groupby(["annual_inc_binned", "loan_status"])["loan_status"].count().unstack()
annual_group
# 知识点,如果需要将index重命名需要对其数据类型进行更改
# 计算违约率
annual_group["DefaultedRate"] = annual_group[1]/(annual_group[1]+annual_group[0])
# 绘图进行可视化展示
plt.style.use("ggplot")
f,ax1=plt.subplots(figsize=(14,7))
annual_group[[0,1]].plot(kind="bar",ax = ax1,rot = 0,fontsize=12)
ax2=ax1.twinx()
plt.style.use("seaborn-white")
plt.rcParams['font.sans-serif'] = ['SimHei']
annual_group["DefaultedRate"].plot(ax = ax2,style='g.-',fontsize=14)
plt.title('收入与违约率的关系',fontsize=20)
ax1.set_xlabel('IncomeRange',fontsize=16)
ax1.set_ylabel('Count',fontsize=16)
ax2.legend(loc='center right',fontsize=14)
ax1.legend(fontsize=14)
plt.savefig("./picture/年收入与违约率分布图")
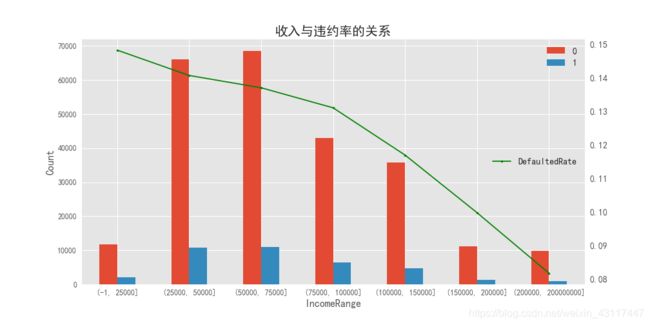
从图中可以看出:
1.正常来讲,收入越高,意味着偿还贷款的能力越强,违约率越低;
2.该平台贷款的人员主要集中在中等收入群体.
2.4.6 信用卡透支比例对违约率的影响
# 取出需要的数据
revol_data = loan_data[["revol_util", "loan_status"]]
# 查看数据类型
revol_data.dtypes
revol_util     object
loan_status     int64
dtype: object
# 转换object类型
revol_data["revol_util"] = revol_data["revol_util"].str.rstrip('%').astype("float")/100
revol_data.head()
revol_data["revol_util"].describe()
count   441187.0000
mean         0.4773
std          0.2473
min          0.0000
25%          0.2860
50%          0.4690
75%          0.6640
max          1.7320
Name: revol_util, dtype: float64
to_bins2 = np.array([-0.1,0.2,0.4,0.6,0.8,1,2])
# 给信用卡透支率分段
revol_data["revol_util_binned"] = pd.cut(revol_data["revol_util"], bins = to_bins2)
revol_data.head(10)
revol_group = revol_data.groupby(["revol_util_binned","loan_status"])["loan_status"].count().unstack()
revol_group
# 计算违约率
revol_group["DefaultedRate"] = revol_group[1]/(revol_group[0]+revol_group[1])
# 开始绘图
plt.style.use("ggplot")
f,ax1 = plt.subplots(figsize=(14,7))
revol_group[[0,1]].plot(kind = "bar", ax = ax1, rot = 0,fontsize = 16)
ax1.set_xlabel('Credit_use_rate',fontsize=18)
ax1.set_ylabel('Count',fontsize=18)
ax2=ax1.twinx()
plt.style.use("seaborn-white")
revol_group["DefaultedRate"].plot(style="g.-",ax = ax2,fontsize = 16)
ax1.legend(fontsize=16)
ax2.legend(loc='center right',fontsize=16)
plt.title('DefaultedRate by Credit_use_rate',fontsize=20)
plt.savefig("./picture/信用卡透支率与贷款状态关系图")

从上图可以看出:
1.大部分人都有使用信用卡;
2.总的来说,随着信用卡的透支比例越来越高,违约率也越来越高.
2.4.7 信用评级对违约率的影响
grade_data = loan_data[["grade","loan_status"]]
grade_group = grade_data.groupby(["grade", "loan_status"])["loan_status"].count().unstack()
# 计算违约率
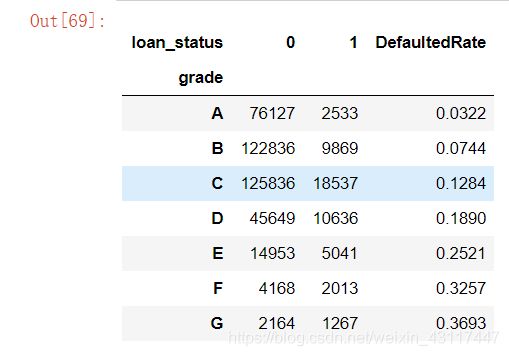
grade_group["DefaultedRate"] = grade_group[1]/(grade_group[1]+grade_group[0])
grade_group
# 开始绘图
plt.style.use("ggplot")
f,ax1 = plt.subplots(figsize=(14,7))
grade_group[[0,1]].plot(kind="bar",ax = ax1, rot=0, fontsize=16)
ax1.set_xlabel("LCgrade",fontsize=16)
ax1.set_ylabel('Count',fontsize=16)
ax2 = ax1.twinx()
plt.style.use("seaborn-white")
grade_group[["DefaultedRate"]].plot(style='g.-',ax=ax2,fontsize=14)
ax1.legend(fontsize=14)
ax2.legend(loc='center right',fontsize=14)
plt.title('DefaultedRate by LCgrade',fontsize=20)
plt.savefig("./picture/信用评级与违约率关系图")

从上图可以看出:
1.平台大部分人信用评级在D级(含)以上;
2.随着信用等级降低,他的违约率在逐步升高;
3.当信用等级在D以下时,其违约率已经高过了25%.
2.4.8 过去两年借款人信用档案中逾期30天以上的拖欠次数对违约率的影响
delinq_2yrs_data = loan_data[["delinq_2yrs","loan_status"]]
delinq_2yrs_group = delinq_2yrs_data.groupby(["delinq_2yrs","loan_status"])["loan_status"].count().unstack()
delinq_2yrs_group.tail()
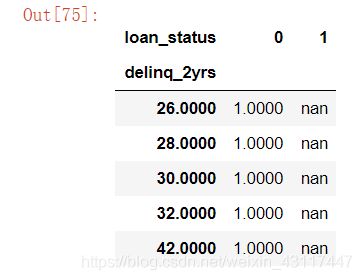
可以看出,有的违约次数多达42次,为了便于展示,我将多于6次的进行求和
# 对违约6次以上的求和
delinq_2yrs_group.iloc[6:,:].sum()
loan_status
0   1915.0000
1    267.0000
dtype: float64
delinq_2yrs_group = delinq_2yrs_group.iloc[:6,:]
delinq_2yrs_group
# 将后面的列加上去
delinq_2yrs_group.loc["6+"] = [4407.0,1138.0]
delinq_2yrs_group
# 计算违约率
delinq_2yrs_group["DefaultedRate"] = delinq_2yrs_group[1]/(delinq_2yrs_group[1]+delinq_2yrs_group[0])
# 绘图
plt.style.use("ggplot")
f,ax1=plt.subplots(figsize=(16,9))
delinq_2yrs_group[[0,1]].plot(kind='bar',ax=ax1,rot=0,fontsize=14)
ax1.set_xlabel('DelinquenciesLast2Years',fontsize=16)
ax1.set_ylabel('Count',fontsize=16)
ax1.set(yscale = "log")
ax2=ax1.twinx()
plt.style.use("seaborn-white")
delinq_2yrs_group['DefaultedRate'].plot(style='g.-',ax=ax2,fontsize=14)
ax1.legend(fontsize=16)
ax2.legend(loc='center right',fontsize=14)
plt.title('DefaultedRate by DelinquenciesLast2Years',fontsize=20)
plt.savefig("./picture/两年内信用违约次数与违约率关系图")
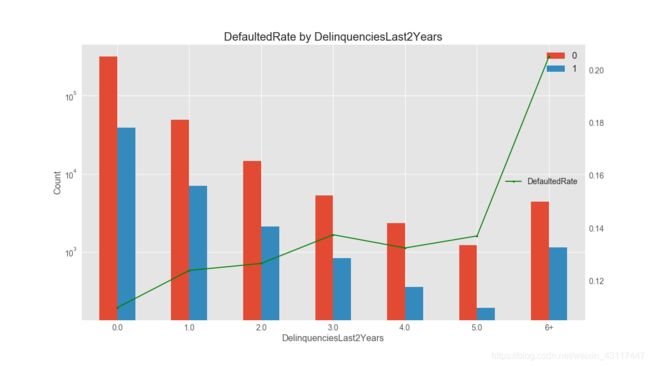
从上图可以看出:
1.总体来说过去2年违约次数越多,违约率越高
2.过去2年未违约的人数占绝大部分,可以看出平台更偏爱未违约的人群
前段总结
1.影响风险的因素
一般而言.高收入人群相对来说偿债能力越强,风险越低;过往的征信记录也能反映贷款人的偿还意愿,对于有征信不良记录的人而言,为平衡风险,应匹配更高的利率定价.
2.贷款平台特点
1.从整个年度来看,该平台业务处于持续增长中
2.该平台贷款主要集中在10000美元左右,以小额贷款为主
3.总体而言,利率相对传统银行较高
4.该平台贷款不良率达到了11.298%,需要加强风险控制
贷前风险建模
三、数据预处理
3.1 凭常识删除部分特征
阅读特征词典
# 构建特征信息表
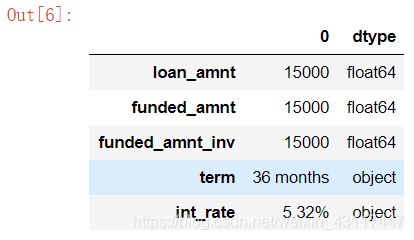
information_dict = pd.DataFrame(loan_data.loc[0])
information_dict["dtype"] = loan_data.dtypes
information_dict.head()
# 取第一行数据保存
information_dict.to_csv("./各特征含义信息表.csv")
# 查看英文文档,填充<各特征含义信息表>,使用excel打开文件根据特征词典手动填写每一项特征的信息,保存为xlsx格式
# 将<各特征含义信息表>复制保存后读取
infor_dict = pd.read_excel("各特征含义信息表.xlsx")
infor_dict.head(10)
colums_to_del = infor_dict[infor_dict["去留"] == "删"].index
colums_to_del
# 凭常识删除贷后特征
loan_data_new = loan_data.drop(colums_to_del,axis=1)
loan_data_new.shape
(443579, 73)
还剩下73个特征
# 同值化处理
#nunique在计算唯一值时排除了空值
loan_data_new = loan_data_new.loc[:,loan_data_new.apply(pd.Series.nunique) != 1]
loan_data_new.shape
(443579, 72)
# 检查缺失值
mis_val_table = missing_values_table(loan_data_new)#该函数在上面创建过了
mis_val_table
输入的对象一共有72个特征.
其中一共有13个特征具有缺失值.

3.2.1分类变量缺失值处理
object_columns = loan_data_new.select_dtypes("object")
# 检查缺失值
mis_val_table_obj = missing_values_table(object_columns)
mis_val_table_obj
输入的对象一共有11个特征.
其中一共有2个特征具有缺失值.

可以看到revol_util是由于%的导致的,将其转化为数值类型
loan_data_new["revol_util"] = loan_data_new["revol_util"].str.rstrip("%").astype("float")/100
# 检查emp_length
loan_data_new["emp_length"].value_counts()
10+ years    146057
< 1 year      43835
2 years       40456
3 years       35362
1 year        28985
4 years       26993
5 years       26660
6 years       19043
7 years       15932
9 years       15229
8 years       13156
Name: emp_length, dtype: int64
# 可以联想工作时间这一特征很可能是由于申请人无工作经验所以没有填写,将空值填充为"无经验"
loan_data_new["emp_length"] = loan_data_new["emp_length"].fillna("无")
3.2.2 数值变量缺失值处理
loan_data_new.dtypes.value_counts()
float64    62
object     10
dtype: int64
使用众数填充缺失值,该方法一直卡在这,我根据警告提示导入了SimpleImputer之后解决了问题
# from sklearn.preprocessing import Imputer
# imr = Imputer(strategy="most_frequent")
# loan_data_new[numColumns] = imr.fit_transform(loan_data_new[numColumns])
# 选取有缺失值的特征
mis_col = loan_data_new[numColumns].isnull().sum()[loan_data_new[numColumns].isnull().sum()>0].index
from sklearn.impute import SimpleImputer
imputer = SimpleImputer(strategy="most_frequent")
imputer.fit(loan_data_new[mis_col])
loan_data_new[mis_col] = imputer.transform(loan_data_new[mis_col])
import missingno as msno
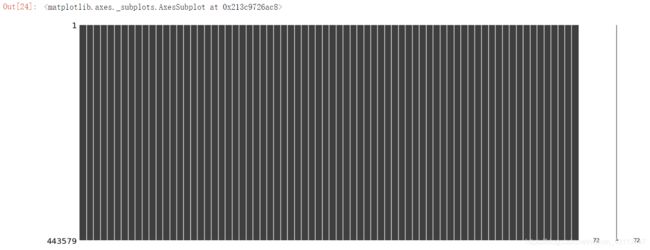
msno.matrix(loan_data_new) # 再次检查缺失值情况
# 再次检查缺失值
mis_val_table = missing_values_table(loan_data_new)
mis_val_table
输入的对象一共有72个特征.
其中一共有0个特征具有缺失值.
3.3 同值化处理
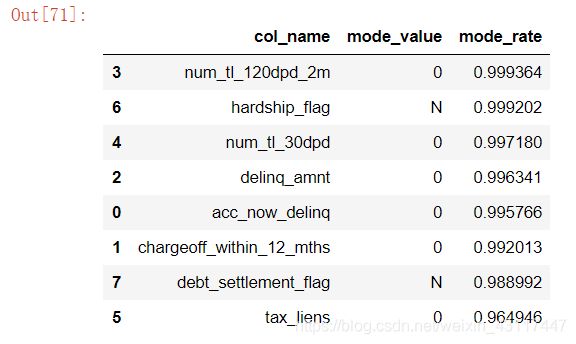
如果一个变量大部分的观测都是相同的特征,那么这个特征或者输入变量就是无法用来区分目标时间,这里临界值选择95%.
equi_fea = []
for col in loan_data_new.columns:
    #将该列出现最多次数的值取出
    mode_value = loan_data_new[col].value_counts().index[0]
    mode_rate = loan_data_new[col].value_counts().iloc[0]/loan_data_new.shape[0]
    if mode_rate > 0.95:
        equi_fea.append([col,mode_value,mode_rate])

equi = pd.DataFrame(equi_fea,columns=["col_name","mode_value","mode_rate"])
equi.sort_values(by="mode_rate",ascending=False)
# 删除这些同一只值
droplist = equi.col_name.values
loan_data_new.drop(droplist,axis=1,inplace=True)
loan_data_new.shape
(443579, 64)
8个特征已经被删除
四、特征工程
4.1 特征衍生
已知申请人年收入"annual_inc",期望贷款金额"loan_amnt",贷款周期"term",可以用月收入(“annual_inc”/12)除以月还款本金(“loan_amnt”/int(“term”))
新特征代表申请人每月还款本金与月收入的比,可以反映出贷款人的偿债压力
# 有部分无收入的,当作为除数的时候会出现无穷值inf,给出除数加1可避免
term =loan_data_new["term"].str.rstrip("months").astype("int")
loan_data_new["repay_month"] = (loan_data_new["loan_amnt"]/term)/(loan_data_new["annual_inc"]/12+1)
4.2 特征抽象
将数据转换成算法可以理解的数据
loan_data_new.select_dtypes("object").apply(pd.Series.nunique,axis=0)
term                    2
grade                   7
emp_length             12
home_ownership          5
verification_status     3
loan_status             7
purpose                14
application_type        2
dtype: int64
4.2.1 有序特征映射
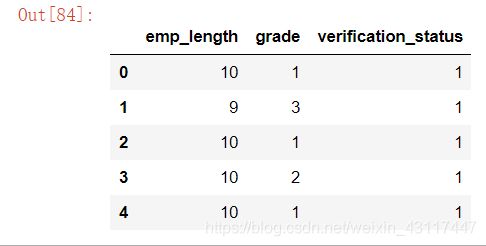
# "verification_status"(年收入是否经过验证可再细分为两类)
mapping_dict = {
    "emp_length": {
        "10+ years": 10,
        "9 years": 9,
        "8 years": 8,
        "7 years": 7,
        "6 years": 6,
        "5 years": 5,
        "4 years": 4,
        "3 years": 3,
        "2 years": 2,
        "1 year": 1,
        "< 1 year":0,
        "无": 0
    },
    "grade":{
        "A": 1,
        "B": 2,
        "C": 3,
        "D": 4,
        "E": 5,
        "F": 6,
        "G": 7
    },
    "verification_status":{
        "Source Verified":0,
        "Not Verified":1,
        "Verified":0
    }
}

loan_data_new = loan_data_new.replace(mapping_dict)
# 查看效果
loan_data_new[["emp_length","grade","verification_status"]].head()
loan_data_new.select_dtypes("object").apply(pd.Series.nunique,axis=0)
term                 2
home_ownership       5
loan_status          7
purpose             14
application_type     2
dtype: int64
对于具有2个唯一类别的分类变量(dtype == object),我们将使用标签编码,对于具有2个以上唯一类别的分类变量,我们将使用独热编码。
对于标签编码,我们使用Scikit-Learn LabelEncoder,对于独热编码,使用pandas get_dummies(df)函数。
标签编码
from sklearn.preprocessing import LabelEncoder
# 创建一个标签编码对象
le = LabelEncoder()
le_count = 0

# 迭代所有的列
for col in loan_data_new:
    if loan_data_new[col].dtype == 'object':
        # 如果只有两类唯一值
        if len(loan_data_new[col].unique()) == 2:
            # 训练满足条件的这一列
            le.fit(loan_data_new[col])
            # 转化这一列
            loan_data_new[col] = le.transform(loan_data_new[col])
            # 查看有多少列被标签编码了
            le_count += 1

print('%d 列被标签编码了.' % le_count)
独热编码
cols = ["home_ownership","purpose"]
dummy_df = pd.get_dummies(loan_data_new[cols])# 用get_dummies进行one hot编码
loan_data_new = pd.concat([loan_data_new, dummy_df], axis=1) #当axis = 1的时候,concat就是行对齐,然后将不同列名称的两张表合并
# 将原来的两列删除
loan_data_new.drop(["home_ownership","purpose"],axis=1,inplace=True)
loan_data_new.shape
(443579, 82)
4.3 特征缩放
1.去量纲
2.加快算法收敛速度
# 将目标变量取出
target = loan_data_new["loan_status"]
# 取出数据集(不含目标变量)
loans = loan_data_new.drop("loan_status",axis=1)
loans.shape
(441629, 81)


