python科学数据包-初识pandas
文章目录
- 1.pandas课程介绍
- 2.ipython开发环境搭建
- 3.numpy简介
- 4.pandas快速入门(一)
- pandas快速入门(二)
- pandas快速入门(三)
- 7.实例:MovieLens 电影数据分析
- 8.实例:MovieLens 电影数据分析(续)
- 9.pandas 核心数据结构
- 10.pandas 核心数据结构(续)
- 11.pandas 基础运算
1.pandas课程介绍
什么是pandas
pandas 是python环境下最有名的数据统计包,它非常像 Excel,提供了分析数据的功能。它提供了两个数据类型 Series 和 DataFrame。
pandas能做什么
结构化数据分析
课程内容
ipython介绍
pandas快速入门
pandas核心数据结构和基础运算
pandas高级内容
数据可视化
实例
课程目标
会使用pandas进行简单的数据分析
2.ipython开发环境搭建
参考该博客即可:https://blog.csdn.net/DawnRanger/article/details/48866365?utm_medium=distribute.pc_relevant.none-task-blog-BlogCommendFromBaidu-3&depth_1-utm_source=distribute.pc_relevant.none-task-blog-BlogCommendFromBaidu-3
3.numpy简介
import numpy as np
a=np.array([[1,2,3],
            [4,5,6]])
b=range(10)
c=np.arange(5,15)
d=np.arange(10)
e=a.reshape(3,2)
f=np.ones((2,3,3))
g=np.arange(100,step=10)
h=g[2]
i=g[2:]
print('a:',a,'\n','b:',b,'\n','c:',c,'\n','d:',d,'\n','e:',e,'\n','f:',f,'\n','g:',g,'\n','h:',h,'\n','i:',i)
print('_____________________________________________________________')
j=np.arange(16).reshape(4,4)
k=j[1]
l=j[1:3]
m=j[:,2:4]
n=j[1:3,2:4]
o=j[[1,3],[2,2]]
p,q=j[1,2],j[3,3]
r=j>10
s=j[r]
print('j:',j,'\n','k:',k,'\n','l:',l,'\n','m:',m,'\n','n:',n,'\n','o:',o,'\n','p:',p,'\n','q:',q,'\n','r:',r,'\n','s:',s)
print('_____________________________________________________________')
t=j[j>10]
u=j[j%2==0]
v=np.arange(1,5).reshape(2,2)
w=np.arange(5,9).reshape(2,2)
x=v+w
y=v*w
z=v.dot(w)
print('t:',t,'\n','u:',u,'\n','v:',v,'\n','w:',w,'\n','x:',x,'\n','y:',y,'\n','z:',z)
'''
运行结果
a: [[1 2 3]
 [4 5 6]]
 b: range(0, 10)
 c: [ 5  6  7  8  9 10 11 12 13 14]
 d: [0 1 2 3 4 5 6 7 8 9]
 e: [[1 2]
 [3 4]
 [5 6]]
 f: [[[ 1.  1.  1.]
  [ 1.  1.  1.]
  [ 1.  1.  1.]]

 [[ 1.  1.  1.]
  [ 1.  1.  1.]
  [ 1.  1.  1.]]]
 g: [ 0 10 20 30 40 50 60 70 80 90]
 h: 20
 i: [20 30 40 50 60 70 80 90]
_____________________________________________________________
j: [[ 0  1  2  3]
 [ 4  5  6  7]
 [ 8  9 10 11]
 [12 13 14 15]]
 k: [4 5 6 7]
 l: [[ 4  5  6  7]
 [ 8  9 10 11]]
 m: [[ 2  3]
 [ 6  7]
 [10 11]
 [14 15]]
 n: [[ 6  7]
 [10 11]]
 o: [ 6 14]
 p: 6
 q: 15
 r: [[False False False False]
 [False False False False]
 [False False False  True]
 [ True  True  True  True]]
 s: [11 12 13 14 15]
_____________________________________________________________
t: [11 12 13 14 15]
 u: [ 0  2  4  6  8 10 12 14]
 v: [[1 2]
 [3 4]]
 w: [[5 6]
 [7 8]]
 x: [[ 6  8]
 [10 12]]
 y: [[ 5 12]
 [21 32]]
 z: [[19 22]
 [43 50]]
'''
4.pandas快速入门(一)
import pandas as pd
import numpy as np
a=pd.Series([1,3,5,np.NaN,8,4])#创建Series数据
b=pd.date_range('20200507',periods=6)#创建日期数据
c=pd.DataFrame(np.random.randn(6,4),index=b,columns=list('ABCD'))#创建dataframe数据
d={'A':1,'B':pd.Timestamp('20200507'),'C':range(4),'D':np.arange(4)}
e=pd.DataFrame(d)#根据字典创建dataframe数据
f=e.dtypes#返回数据类型
g=e.A#返回A列数据
h=e.B#返回B列数据
i=e.head()#返回前几行数据,默认五行
j=e.tail()#返回倒数几行数据,默认五行
k=e.index#行标签
l=e.index#列标签
print('a:',a,'\n','______________','\n','b:',b,'\n','______________','\n','c:',c,'\n','______________','\n',
      'd:',d,'\n','______________','\n','e:',e,'\n','______________','\n','f:',f,'\n','______________','\n',
      'g:',g,'\n','______________','\n','h:',h,'\n','______________','\n','i:',i,'\n','______________','\n',
      'j:',j,'\n','______________','\n','k:',k,'\n','______________','\n','l:',l,'\n','______________','\n',)
m=e.describe()#f的各种数据的描述
n=e.T#转置
print(e)
o=e.sort_index(axis=0,ascending=False)#列标签降序排序
p=e['A']#A列排序
#DataFrame的loc方法是帮助选择数据的,比如选择索引位置为0的一行数据(注意我们是用dates作为索引的)
q=e.loc['20200508':'20200510']#按行标签选择
r=e.loc[:,['A','C']]#按行和列标签选择
s=e[e>0]#选取表中大于0的元素
#DataFrame数据框允许我们使用iloc方法来像操作array(数组)一样对DataFrame进行切片操作,其形式上,跟对数组进行切片是一样的
t=e.iloc[:,[1,3]]
e.B=200#修改元素B列
e.iloc[:,2:4]#修改子表元素
print('m:',m,'\n','______________','\n','n:',n,'\n','______________','\n','o:',o,'\n','______________','\n',
      'p:',p,'\n','______________','\n','q:',q,'\n','______________','\n','r:',r,'\n','______________','\n',
      's:',s,'\n','______________','\n','t:',t,'\n','______________','\n','e:',e)
'''
运行结果
a: 0    1.0
1    3.0
2    5.0
3    NaN
4    8.0
5    4.0
dtype: float64
 ______________
 b: DatetimeIndex(['2020-05-07', '2020-05-08', '2020-05-09', '2020-05-10',
               '2020-05-11', '2020-05-12'],
              dtype='datetime64[ns]', freq='D')
 ______________
 c:                    A         B         C         D
2020-05-07  0.311543 -0.082666  0.924050  1.477414
2020-05-08 -1.131805  0.865119 -0.716186  0.219056
2020-05-09 -0.555966 -0.124749  1.488843  1.194666
2020-05-10 -0.451080 -0.979333 -1.709324 -0.113792
2020-05-11  0.398288 -0.483292  0.116533 -0.969372
2020-05-12  0.178899 -0.429515 -0.916258  0.243992
 ______________
 d: {'A': 1, 'B': Timestamp('2020-05-07 00:00:00'), 'C': range(0, 4), 'D': array([0, 1, 2, 3])}
 ______________
 e:    A          B  C  D
0  1 2020-05-07  0  0
1  1 2020-05-07  1  1
2  1 2020-05-07  2  2
3  1 2020-05-07  3  3
 ______________
 f: A             int64
B    datetime64[ns]
C             int32
D             int32
dtype: object
 ______________
 g: 0    1
1    1
2    1
3    1
Name: A, dtype: int64
 ______________
 h: 0   2020-05-07
1   2020-05-07
2   2020-05-07
3   2020-05-07
Name: B, dtype: datetime64[ns]
 ______________
 i:    A          B  C  D
0  1 2020-05-07  0  0
1  1 2020-05-07  1  1
2  1 2020-05-07  2  2
3  1 2020-05-07  3  3
 ______________
 j:    A          B  C  D
0  1 2020-05-07  0  0
1  1 2020-05-07  1  1
2  1 2020-05-07  2  2
3  1 2020-05-07  3  3
 ______________
 k: RangeIndex(start=0, stop=4, step=1)
 ______________
 l: RangeIndex(start=0, stop=4, step=1)
 ______________

   A          B  C  D
0  1 2020-05-07  0  0
1  1 2020-05-07  1  1
2  1 2020-05-07  2  2
3  1 2020-05-07  3  3
m:          A         C         D
count  4.0  4.000000  4.000000
mean   1.0  1.500000  1.500000
std    0.0  1.290994  1.290994
min    1.0  0.000000  0.000000
25%    1.0  0.750000  0.750000
50%    1.0  1.500000  1.500000
75%    1.0  2.250000  2.250000
max    1.0  3.000000  3.000000
 ______________
 n:                      0                    1                    2  \
A                    1                    1                    1
B  2020-05-07 00:00:00  2020-05-07 00:00:00  2020-05-07 00:00:00
C                    0                    1                    2
D                    0                    1                    2

                     3
A                    1
B  2020-05-07 00:00:00
C                    3
D                    3
 ______________
 o:    A          B  C  D
3  1 2020-05-07  3  3
2  1 2020-05-07  2  2
1  1 2020-05-07  1  1
0  1 2020-05-07  0  0
 ______________
 p: 0    1
1    1
2    1
3    1
Name: A, dtype: int64
 ______________
 q: Empty DataFrame
Columns: [A, B, C, D]
Index: []
 ______________
 r:    A  C
0  1  0
1  1  1
2  1  2
3  1  3
 ______________
 s:    A          B    C    D
0  1 2020-05-07  NaN  NaN
1  1 2020-05-07  1.0  1.0
2  1 2020-05-07  2.0  2.0
3  1 2020-05-07  3.0  3.0
 ______________
 t:            B  D
0 2020-05-07  0
1 2020-05-07  1
2 2020-05-07  2
3 2020-05-07  3
 ______________
 e:    A    B  C  D
0  1  200  0  0
1  1  200  1  1
2  1  200  2  2
3  1  200  3  3
'''
import pandas as pd
import numpy as np
df=pd.DataFrame(np.random.randn(6,4),columns=list('ABCD'))
#通过布尔索引完成的筛选数据
a=df[df.D>0]#筛选D列数据中大于0的行
b=df[(df.D>0)&(df.C>0)]#筛选D列数据中大于0且C列数据中小于的行
c=df[['A','B']][(df.D>0)&(df.C>0)]#只需要A和B列数据,而D和C列数据都是用于筛选的
alist=[0.051312,0.654564,0.123135]
d=df['D'].isin(alist)#查看D列中是否存在alist中的值
print('a:',a,'\n','______________','\n','b:',b,'\n','______________','\n','c:',c,'\n','______________','\n',
      'd:',d,'\n','______________','\n')
pandas快速入门(二)
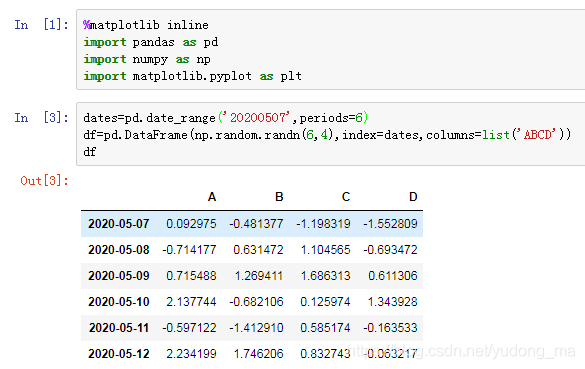
使用jupyter进行操作,%matplotlib inline可以直接生成表格
本单元主要学习内容,是根据pandas各种方法实现
**
- 处理丢失数据
- 数据运算
- 数据合并
- 数据分组
# %matplotlib inline
import pandas as pd
import numpy as np
import matplotlib.pyplot as plt
dates=pd.date_range('20200507',periods=6)
df=pd.DataFrame(np.random.randn(6,4),index=dates,columns=list('ABCD'))
print(df)
'''
运行结果
                   A         B         C         D
2020-05-07  0.363980 -0.382298  0.378075  2.247585
2020-05-08  0.538731 -0.861282 -0.578067  0.163687
2020-05-09 -0.778318 -0.689559 -1.131059 -1.428594
2020-05-10 -1.141363  2.219472 -1.656231 -1.217820
2020-05-11 -0.094511 -0.121862  0.103443  2.838505
2020-05-12  1.263840 -0.232635 -1.677991 -0.609847
'''
pandas快速入门(三)
本单元主要学习内容,是根据pandas各种方法实现
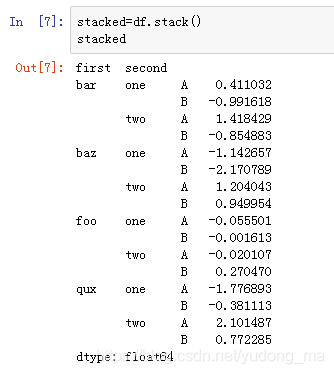
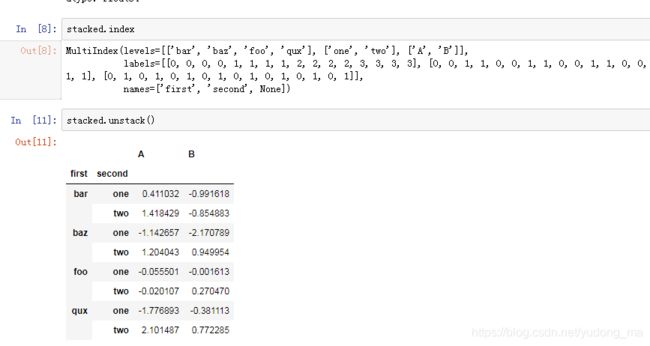
- 数据整形
- 数据透视
- 时间序列
- 数据可视化
# %matplotlib inline
import pandas as pd
import numpy as np
import matplotlib.pyplot as plt
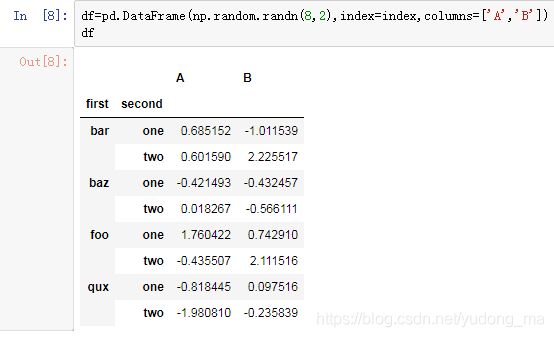
tuples=list(zip(*[['bar','bar','baz','baz',
                  'foo','foo','qux','qux'],
               ['one','two','one','two',
                'one','two','one','two']]))
index=pd.MultiIndex.from_tuples(tuples,names=['first','second'])
df=pd.DataFrame(np.random.randn(8,2),index=index,columns=['A','B'])
print(tuples,index,df,sep=('\n'+'________________'+'\n'))
'''
运行结果
[('bar', 'one'), ('bar', 'two'), ('baz', 'one'), ('baz', 'two'), ('foo', 'one'), ('foo', 'two'), ('qux', 'one'), ('qux', 'two')]
________________
MultiIndex(levels=[['bar', 'baz', 'foo', 'qux'], ['one', 'two']],
           labels=[[0, 0, 1, 1, 2, 2, 3, 3], [0, 1, 0, 1, 0, 1, 0, 1]],
           names=['first', 'second'])
________________
                     A         B
first second
bar   one     0.425901  2.404225
      two     0.246681 -1.343732
baz   one    -0.700777 -0.975630
      two     1.994023  0.345906
foo   one    -0.146203 -0.836873
      two    -0.051473  0.159613
qux   one     2.241274  0.506070
      two     0.447710 -0.472121

Process finished with exit code 0

'''
 |
 |
|---|---|
 |
 |
 |
 |
 |
 |
 |
 |
 |
7.实例:MovieLens 电影数据分析
需要先下载ml-lm/users.dat
import pandas as pd
unames=['user_id','gender','age','occupation','zip']#根据内容建表
users=pd.read_table('ml-lm/users.dat',sep='::',header=None)
print(len(users))
print(users.head(5))
rating_names = ['user_id', 'movie_id', 'rating', 'timestamp']#根据内容建表
ratings = pd.read_table('ml-1m/ratings.dat', sep='::', header=None, names=rating_names, engine='python')
movie_names = ['movie_id', 'title', 'genres']#根据内容建表
movies = pd.read_table('ml-1m/movies.dat', sep='::', header=None, names=movie_names, engine='python')
data = pd.merge(pd.merge(users, ratings), movies)#把表拼起来
data[data.user_id == 1]
mean_ratings_gender = data.pivot_table(values='rating', index='title', columns='gender', aggfunc='mean')#数据透视,按性别分析数据
mean_ratings_gender.head(5)
8.实例:MovieLens 电影数据分析(续)
import pandas as pd
unames=['user_id','gender','age','occupation','zip']
users=pd.read_table('ml-lm/users.dat',sep='::',header=None)
print(len(users))
print(users.head(5))
rating_names = ['user_id', 'movie_id', 'rating', 'timestamp']
ratings = pd.read_table('ml-1m/ratings.dat', sep='::', header=None, names=rating_names, engine='python')
movie_names = ['movie_id', 'title', 'genres']
movies = pd.read_table('ml-1m/movies.dat', sep='::', header=None, names=movie_names, engine='python')
data = pd.merge(pd.merge(users, ratings), movies)
data[data.user_id == 1]
mean_ratings_gender = data.pivot_table(values='rating', index='title', columns='gender', aggfunc='mean')
mean_ratings_gender.head(5)
ratings_by_movie_title = data.groupby('title').size()#按title进行分组,然后看电影总评分
ratings_by_movie_title.head(5)
top_ratings = ratings_by_movie_title[ratings_by_movie_title > 1000]
top_10_ratings = top_ratings.sort_values(ascending=False).head(10)#参与评分人数最多的电影
mean_ratings = data.pivot_table(values='rating', index='title', aggfunc='mean')#每部电影平均得分
mean_ratings[top_10_ratings.index]#前十大热门电影评分
9.pandas 核心数据结构
import pandas as pd
import numpy as np
'''Series 是**一维带标签的数组**,数组里可以放任意的数据(整数,浮点数,字符串,Python Object)。其基本的创建函数是:
s = pd.Series(data, index=index)
其中 index 是一个列表,用来作为数据的标签。data 可以是不同的数据类型:'''
s1 = pd.Series(np.random.randn(5), index=['a', 'b', 'c', 'd', 'e'])#从字典创建
s2 = pd.Series(np.random.randn(5))
d = {'a' : 0., 'b' : 1., 'd' : 3}
s3 = pd.Series(d, index=list('abcd'))# 空值的默认处理
s = pd.Series(np.random.randn(5), index=['a', 'b', 'c', 'd', 'e'])
s['d']=3#用字典的方式赋值
s1 = pd.Series(np.random.randn(3), index=['a', 'c', 'e'])
s2 = pd.Series(np.random.randn(3), index=['a', 'd', 'e'])
print('{0}\\n\\n{1}'.format(s1, s2))
print(s1+s2)#自动对齐进行运算
'''
DataFrame 是**二维带行标签和列标签的数组**。可以把 DataFrame 想你成一个 Excel 表格或一个 SQL 数据库的表格,
还可以相像成是一个 Series 对象字典。它是 Pandas 里最常用的数据结构。
创建 DataFrame 的基本格式是:
df = pd.DataFrame(data, index=index, columns=columns)
其中 index 是行标签,columns 是列标签,data 可以是下面的数据:
 由一维 numpy 数组,list,Series 构成的字典,* 二维 numpy 数组,
一个 Series,另外的 DataFrame 对象
'''
d = {'one' : pd.Series([1, 2, 3], index=['a', 'b', 'c']),
     'two' : pd.Series([1, 2, 3, 4], index=['a', 'b', 'c', 'd'])}
pd.DataFrame(d)#从字典创建
print(d)
pd.DataFrame(d, index=['d', 'b', 'a']) #从字典创建
data = [(1, 2.2, 'Hello'), (2, 3., "World")]#从列表创建
pd.DataFrame(data)
data = [{'a': 1, 'b': 2}, {'a': 5, 'b': 10, 'c': 20}]#从字典列表创建
pd.DataFrame(data)
d = {('a', 'b'): {('A', 'B'): 1, ('A', 'C'): 2},
     ('a', 'a'): {('A', 'C'): 3, ('A', 'B'): 4},
     ('a', 'c'): {('A', 'B'): 5, ('A', 'C'): 6},
     ('b', 'a'): {('A', 'C'): 7, ('A', 'B'): 8},
     ('b', 'b'): {('A', 'D'): 9, ('A', 'B'): 10}}
pd.DataFrame(data)#从复杂结构创建
s = pd.Series(np.random.randn(5), index=['a', 'b', 'c', 'd', 'e'])
pd.DataFrame(s)# 从 Series 创建
10.pandas 核心数据结构(续)
import pandas as pd
import numpy as np
df = pd.DataFrame(np.random.randn(10, 4), columns=['one', 'two', 'three', 'four'])
df['three'] = df['one'] + df['two']# 列选择/增加/删除
df.insert(1, 'bar', df['one'])# 指定插入位置
df.assign(Ratio=df['one']/df['two'])# 使用 assign() 方法来插入新列
df = pd.DataFrame(np.random.randint(1, 10, (6, 4)), index=list('abcdef'), columns=list('ABCD'))
df[1:4]#切片
'''DataFrame 在进行数据计算时,会自动按行和列进行数据对齐。最终的计算结果会合并两个 DataFrame'''
df1 = pd.DataFrame(np.random.randn(10, 4), index=list('abcdefghij'), columns=['A', 'B', 'C', 'D'])
df2 = pd.DataFrame(np.random.randn(7, 3), index=list('cdefghi'), columns=['A', 'B', 'C'])
df1 + df2
df1 - df1.iloc[0]# 数据对齐
np.asarray(df) == df.values
'''
Panel 是三维带标签的数组。实际上,Pandas 的名称由来就是由 Panel 演进的,即 pan(el)-da(ta)-s。Panel 比较少用,
但依然是最重要的基础数据结构之一。
items: 坐标轴 0,索引对应的元素是一个 DataFrame
major_axis: 坐标轴 1, DataFrame 里的行标签
minor_axis: 坐标轴 2, DataFrame 里的列标签
'''
data = {'Item1' : pd.DataFrame(np.random.randn(4, 3)),
    'Item2' : pd.DataFrame(np.random.randn(4, 2))}
pn = pd.Panel(data)#根据Panel创建
11.pandas 基础运算
import pandas as pd
import numpy as np

s = pd.Series([1, 3, 5, 6, 8], index=list('acefh'))
s.reindex(list('abcdefgh'), method='ffill')# 重新索引
df = pd.DataFrame(np.random.randn(4, 6), index=list('ADFH'), columns=['one', 'two', 'three', 'four', 'five', 'six'])# DataFrame
df2 = df.reindex(index=list('ABCDEFGH'))
df.loc['A']['one'] = 100
df.reindex(columns=['one', 'three', 'five', 'seven'])
df.reindex(columns=['one', 'three', 'five', 'seven'], fill_value=0)
df.reindex(columns=['one', 'three', 'five', 'seven'], method='ffill')# fill method 只对行有效
df.reindex(index=list('ABCDEFGH'), method='ffill')
df = pd.DataFrame(np.random.randn(4, 6), index=list('ABCD'), columns=['one', 'two', 'three', 'four', 'five', 'six'])
df.drop('A')# 丢弃部分数据
df2 = df.drop(['two', 'four'], axis=1)
df.iloc[0, 0] = 100
print(df2)# 数据拷贝
df = pd.DataFrame(np.arange(12).reshape(4, 3), index=['one', 'two', 'three', 'four'], columns=list('ABC'))
df.loc['one']
print(df - df.loc['one']) # 广播运算
'''
函数计算时
apply: 将数据按行或列进行计算
applymap: 将数据按元素为进行计算
'''
df = pd.DataFrame(np.arange(12).reshape(4, 3), index=['one', 'two', 'three', 'four'], columns=list('ABC'))
df.apply(lambda x: x.max() - x.min())# 每一列作为一个 Series 作为参数传递给 lambda 函数
df.apply(lambda x: x.max() - x.min(), axis=1)# 每一行作为一个 Series 作为参数传递给 lambda 函数
def min_max(x):# 返回多个值组成的 Series
    return pd.Series([x.min(), x.max()], index=['min', 'max'])
df.apply(min_max, axis=1)
df = pd.DataFrame(np.random.randn(4, 3), index=['one', 'two', 'three', 'four'], columns=list('ABC'))# applymap: 逐元素运算
formater = '{0:.02f}'.format
formater = lambda x: '%.02f' % x
df.applymap(formater)
df = pd.DataFrame(np.random.randint(1, 10, (4, 3)), index=list('ABCD'), columns=['one', 'two', 'three'])
df.sort_values(by='one')# 排序
s = pd.Series([3, 6, 2, 6, 4])# 排序
s.rank(method='first', ascending=False)# 排名
s = pd.Series(list('abbcdabacad'))
s.unique()# 值只返回一次
