OpenLayers使用
OpenLayers是Web GIS前端开发的利器,如果你想在浏览器中进行Web GIS的开发,那么OpenLayers可以大大减少你的工作量,让你快速开发出应用。
OpenLayers概览
OpenLayers是一个用于开发WebGIS客户端的JavaScript包。OpenLayers 支持的地图来源包括Google Maps、Yahoo、 Map、微软Virtual Earth 等,用户还可以用简单的图片地图作为背景图,与其他的图层在OpenLayers 中进行叠加,在这一方面OpenLayers提供了非常多的选择。除此之外,OpenLayers实现访问地理空间数据的方法都符合行业标准。OpenLayers 支持Open GIS 协会制定的WMS(Web Mapping Service)和WFS(Web Feature Service)等网络服务规范,可以通过远程服务的方式,将以OGC 服务形式发布的地图数据加载到基于浏览器的OpenLayers 客户端中进行显示。OpenLayers采用面向对象方式开发,并使用来自Prototype.js和Rico中的一些组件。
OpenLayers操作
OpenLayers 除了可以在浏览器中帮助开发者实现地图浏览的基本效果,比如放大(Zoom In)、缩小(Zoom Out)、平移(Pan)等常用操作之外,还可以进行选取面、选取线、要素选择、图层叠加等不同的操作,甚至可以对已有的OpenLayers 操作和数据支持类型进行扩充,为其赋予更多的功能。例如,它可以为OpenLayers 添加网络处理服务WPS 的操作接口,从而利用已有的空间分析处理服务来对加载的地理空间数据进行计算。同时,在OpenLayers提供的类库当中,它还使用了类库Prototype.js 和Rico 中的部分组件,为地图浏览操作客户端增加Ajax 效果。
OpenLayers引用
1、在官网:https://openlayers.org/download/下载
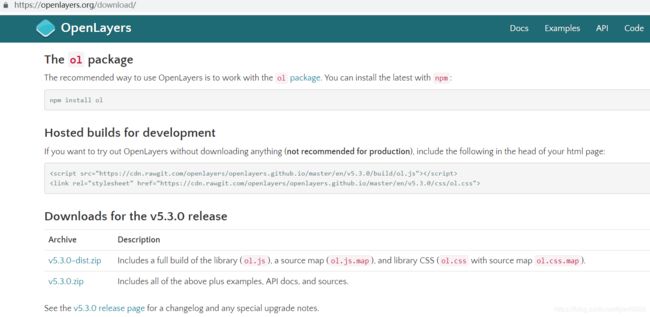
2、选择版本压缩包下载,完成后解压文件;
3、引用有两种:
<1>引用openlayers中的css和js:
https://openlayers.org/en/v5.3.0/css/ol.css" type="text/css">
<2>引用下载到本地的css和js:
例如我们将文件解压到了C盘则如下:
c://v5.3.0/css/ol.css" rel="stylesheet" type="text/css"/>
要显示下面地图

代码如下:
F:\\v5.3.0\v5.3.0\css\ol.css" rel="stylesheet" type="text/css" />
拷贝该段代码在空的txt文件上,另存为html文件格式,用浏览器打开html文件即可看到地图。如果在本地,只需改写红色部分ol.css和ol.js位置,当然以上代码注明html文件编码为utf-8,所以你新建的html文件本身编码需要保证为utf-8,不然会导致中文乱码。
(注:如果你需要将该网页发布到网站上,需要使用iis、tomcat等容器,配置网页进行发布。)
以上代码基本过程是:创建一个地图对象(new ol.Map),设置地图对象三个属性项:图层( new ol.layer.Tile),视图 (view: new ol.View),地图容器( target: 'map' )。图层属性项中还需要引入地图服务(source: new ol.source.OSM())。
OpenLayers基本组件
地图(Map),对应的类是ol.Map,之前已有接触。从代码上来看,它就像是一个空壳子,感觉没做什么实事,因为具体事务都由其他组成部分处理了。但没有它,整个地图的其他组成部分就不能有效协调,组织在一起。同时对于开发者而言,它就是第一个入口,我们必须要掌握。
视图(View),对应的类是ol.View,之前已有接触,控制地图显示的中心位置,范围,层级等,此处不再过多介绍。
图层(Layer),OpenLayers 有多种多样用于不同业务的图层,每一种图层在实现上都对应于一个类,放在包ol.layer下面,之前已接触过的ol.layer.Tile就是其中的一种。OpenLayers允许多个layer重叠在一起,相互之间互不干扰,是一种图形显示和管理的有效方式。应用这种方式能有效处理地图数据来源的多样性和复杂性问题。对开发者而言,它更多的表现为组织管理的类。
数据源(Source),它是和图层一一对应的,OpenLayers 存在多种不同的数据源,每一种在实现上也对应于一个具体的类,它们都放在包ol.source下面,之前接触过的ol.source.OSM就是其中的一种。 毫无 疑问,它是整个地图背后真正的核心。 如果没有数据,那么渲染引擎将没有任何价值。在数据技术(Data Technology)大行其道的今天,GIS引擎将需要支持各式各样的数据来源。目前ol也确实是这样做的,已支持多种多样在线或离线的数据源;可以是静态图或者瓦片图;也可以是栅格化的或者矢量的。如果你想在地图上加载某种格式的数据,或者某种服务提供的数据,都可以优先查看一下OpenLayers是否已经支持了。
控件(Control),它为用户提供了和地图交互的入口。 针对不同的用途,具有不同的控件。其实现类都放在包ol.control下面,在此之前还没有具体接触过,但我们在地图上看到的放大缩小按钮就是众多控件中的一种。控件具备相同的一个特性,就是一直保持在地图的某个固定位置,不会随着地图移动而移动,也不会随着地图放大缩小而变化,一直处于地图的最上层。
交互(Interaction),这是所有软件都具备的一个组成部分,直观地是看不见的,其实现类放在包ol.interaction下面,之前也没具体接触过,但其实是使用到了,如果没有它,我们就没有办法直接用鼠标控制地图放大、缩小、移动。这并不仅仅存在于GIS引擎中,它存在于任何产品中。任何优秀的产品必然有着良好的交互能力,即使没有任何GIS知识,也能体会到它的作用和重要性。
以上组件调用的逻辑是:map提供程序的入口,首先寻找到source,source导入layer,layer传递给map,map通过读取view的参数,展示在浏览器端。展示过程中,如果涉及到map 的放大缩小,及控件传参等交互事件时,以事件方式向map发送消息,通过消息的参数触发map做出相应的调整。下面我们就以此顺序阐述 OpenLayers使用的整个过程。
Map:

单从包含层次看,浏览器包裹了map控件,map控件包裹了map对象,而map对象则收揽了view、layer、source、交互等所有的地图组件。map对象是地图浏览、导航、互操作、数据处理的基石,它承载了浏览器上整个的地图服务。我们从上面代码的过程也可得知map是所有地图组件的容器。官网中初始化map的代码如下:
var map = new Map({
  view: new View({
    center: [0, 0],
    zoom: 1
  }),
  layers: [
    new TileLayer({
      source: new OSM()
    })
  ],
  target: 'map'
});
初始化参数有:
| Name | Type | Default | Description |
|---|---|---|---|
controls |
module:ol/Collection~Collection. |
Controls initially added to the map. If not specified, |
|
pixelRatio |
number | window.devicePixelRatio | The ratio between physical pixels and device-independent pixels (dips) on the device. |
interactions |
module:ol/Collection~Collection. |
Interactions that are initially added to the map. If not specified, |
|
keyboardEventTarget |
HTMLElement | Document | string | The element to listen to keyboard events on. This determines when the |
|
layers |
Array. |
Layers. If this is not defined, a map with no layers will be rendered. Note that layers are rendered in the order supplied, so if you want, for example, a vector layer to appear on top of a tile layer, it must come after the tile layer. |
|
maxTilesLoading |
number | 16 | Maximum number tiles to load simultaneously. |
loadTilesWhileAnimating |
boolean | false | When set to |
loadTilesWhileInteracting |
boolean | false | When set to |
moveTolerance |
number | 1 | The minimum distance in pixels the cursor must move to be detected as a map move event instead of a click. Increasing this value can make it easier to click on the map. |
overlays |
module:ol/Collection~Collection. |
Overlays initially added to the map. By default, no overlays are added. |
|
target |
HTMLElement | string | The container for the map, either the element itself or the |
|
view |
module:ol/View~View | The map's view. No layer sources will be fetched unless this is specified at construction time or through |
controls(控件):初始化控件。如果未指定,使用默认模式
pixelRatio(设备上物理像素和逻辑像素的比例)
interactions(交互):初始化交互模式。如果未指定,使用默认模式
keyboardEventTarget(键盘监听事件):这是触发敲击键盘发出的事件消息与map交互的,如果未指定,使用默认方式。
layers(地图图层矩阵):如果未定义,则将呈现没有图层的地图。
maxTilesLoading(同时最大加载的切片数量)
loadTilesWhileAnimating(是否在动画期间加载切片):此项为布尔型,选择true,在动画期间,可以改善地图质量。
loadTilesWhileInteracting(是否在交互期间加载切片):此项为布尔型,选择true,在地图交互期间,可以改善地图质量。
moveTolerance(光标靠近容差):光标必须移动的最小距离(以像素为单位)才能被检测为地图移动事件而非点击。增加此值可以更轻松地单击地图。
overlays(图层叠加):初始化时叠加图层。默认情况下不叠加
target(地图容器):用以挂载map对象
view(地图视图):控制地图的显示
以上很多并非初始化地图必须项,选择性填写即可,layers,target,view一般为必填项。
map对象方法较多,如下:
有增加控件、交互、图层,获取控件、交互、坐标、图层、图层组,移除等功能。方法较为简单,不做介绍,可参看api docs.
https://openlayers.org/en/latest/apidoc/module-ol_Map-Map.html
source:
(本小节中以ol.source.WMTS重点阐述数据源如何引用国家天地图服务,其他不再赘述)
在GIS中,数据是GIS的核心,它同样也适用于Web GIS。在Web GIS中,数据常常指的是网络地图服务。
以各个厂商发布的服务来分,网络地图服务有:Google地图,天地图,高德地图,百度地图、Open Street Map服务等。
以OGC标准来分,网络地图服务有如下几种:
| 服务类型 |
描述 |
|---|---|
| OGC 网络地图服务 (WMS) |
网络地图服务用于提供按地理配准的地图图像。WMS 服务也可包含样式化图层描述符 (SLD),用于指定 WMS 图层的符号化和描绘方式。 |
| OGC Web 地图切片服务 (WMTS) |
Web 地图切片服务提供预先生成的地理配准的地图图像。WMTS 服务可包含一个或多个样式、维度或切片方案,以指定 WMTS 图层的显示方式。 |
| OGC 网络覆盖服务 (WCS) |
网络覆盖服务提供栅格数据和像元值,如数字高程模型 (DEM) 的高程值或多波段图像的像素值。 |
| OGC 网络要素服务 (WFS) |
网络要素服务使用地理标记语言 (GML) 配置文件提供、查询和更新要素几何和属性。 |
而以OpenLayers的角度来看,只有三种服务:ol.source.Tile,ol.source.Image和ol.source.Vector。
ol.source.Tile对应的是瓦片数据源,现在网页地图服务中,绝大多数都是使用的瓦片地图,而OpenLayers作为一个WebGIS引擎,理所当然应该支持瓦片。ol.source.Image对应的是一整张图,而不像瓦片那样很多张图,从而无需切片,也可以加载一些地图,适用于一些小场景地图。ol.source.Vector对应的是矢量地图源,点,线,面等等常用的地图元素(Feature),就囊括到这里面了。这样看来,只要这两种Source就可以搞定80%的需求了。
(注:这里我们就不再纠结于什么地图服务、瓦片服务,要素服务什么了,我们得按照OpenLayers的规则来。)
在三种服务中,ol.source.Tile最为复杂,因为它需要兼顾不同厂商发布的网络地图服务。下面为OpenLayers source调用不同数据源的接口继承图:
从上图可以发现,ol.source.tile分支最多。上图中的类是按照继承关系,从左向右展开的,左边的为父类,右边的为子类。在使用时,一般来说,都是直接使用叶子节点上的类,基本就可以完成需求。父类需要自己进一步扩展或者处理才能有效使用的。
我们先了解最为复杂的ol.source.Tile,其叶子节点类有很多,大致可以分为几类:
- 在线服务的
Source,包括ol.source.BingMaps(使用的是微软提供的Bing在线地图数据),ol.source.MapQuest(使用的是MapQuest提供的在线地图数据)(注: 由于MapQuest开始收费,ol v3.17.0就移除了ol.source.MapQuest),ol.source.OSM(使用的是Open Street Map提供的在线地图数据),ol.source.Stamen(使用的是Stamen提供的在线地图数据)。没有自己的地图服务器的情况下,可直接使用它们,加载地图底图。 - 支持协议标准的
Source,包括ol.source.TileArcGISRest,ol.source.TileWMS,ol.source.WMTS,ol.source.UTFGrid,ol.source.TileJSON。如果要使用它们,首先你得先学习对应的协议,之后必须找到支持这些协议的服务器来提供数据源,这些服务器可以是地图服务提供商提供的,也可以是自己搭建的服务器,关键是得支持这些协议。 - ol.source.XYZ,这个需要单独提一下,因为是可以直接使用的,而且现在很多地图服务(在线的或者自己搭建的服务器)都支持xyz方式的请求。国内在线的地图服务,高德,天地图等,都可以通过这种方式加载,本地离线瓦片地图也可以,用途广泛,且简单易学,需要掌握。
ol.source.Image虽然有几种不同的子类,但大多比较简单,因为不牵涉到过多的协议和服务器提供商。而ol.source.Vector就更加的简单了,但有时候其唯一的子类ol.source.Cluster在处理大量的Feature时,我们可能需要使用。
在大概了解了整个Source之后,紧接着该介绍它的搭档Layer了,同样的,我们还是先从OpenLayers现有的Layer类图大致了解一下:
一般而言,各个厂商的底图服务,都是tiles服务,只要ol.source.Tile能识别他们,进而直接传递给ol.source.Layer即可加载到浏览器中。因此如何使ol.source.Tile能识别各种不同厂商的数据源变成了关键。
带有现成接口或者协议标准的网络地图加载方式
ol.source对于一些厂商提供了接口,由于地图厂商众多,也只是少部分提供而已。如:open street map、 bing、arcgisrest等已有现成接口,直接加载就行,代码如下:
// Open Street Map 地图层
    var openStreetMapLayer = new ol.layer.Tile({
        source: new ol.source.OSM()
    });

    // Bing地图层
    var bingMapLayer = new ol.layer.Tile({
        source: new ol.source.BingMaps({
            key: 'AkjzA7OhS4MIBjutL21bkAop7dc41HSE0CNTR5c6HJy8JKc7U9U9RveWJrylD3XJ',
      imagerySet: 'Road'
        })
    });

    // Stamen地图层
    var stamenLayer = new ol.layer.Tile({
        source: new ol.source.Stamen({
            layer: 'watercolor'
        })
    });

    // MapQuest地图层
    var mapQuestLayer = new ol.layer.Tile({
        source: new ol.source.MapQuest({
            layer: 'osm'
        })
    });
加载rest
new ol.layer.Tile({
source: new ol.source.TileArcGISRest({
ratio: 1,
params: {},
url: 'https://sampleserver1.arcgisonline.com/ArcGIS/rest/services/Specialty/ESRI_StateCityHighway_USA/MapServer'
})
})标准协议调用方式
我们现行的天地图完全支持OGC标准,使用了wmts服务,可利用ol.source.WMTS驱动WMTS服务,直接加载天地图服务。(本节主要阐述如何加载天地图服务,其他可以参照ol官网API和相关例子学习)
ol 的API文档ol.source.WMTS参数如下:
Type Definitions
Options{Object}
Properties:
| Name | Type | Argument | Default | Description |
|---|---|---|---|---|
attributions |
module:ol/source/Source~AttributionLike | Attributions. |
||
cacheSize |
number | 2048 | Cache size. |
|
crossOrigin |
null | string | The |
||
tileGrid |
module:ol/tilegrid/WMTS~WMTSTileGrid | Tile grid. |
||
projection |
module:ol/proj~ProjectionLike | Projection. |
||
reprojectionErrorThreshold |
number | 0.5 | Maximum allowed reprojection error (in pixels). Higher values can increase reprojection performance, but decrease precision. |
|
requestEncoding |
module:ol/source/WMTSRequestEncoding| string | 'KVP' | Request encoding. |
|
layer |
string | Layer name as advertised in the WMTS capabilities. |
||
style |
string | Style name as advertised in the WMTS capabilities. |
||
tileClass |
Class. |
Class used to instantiate image tiles. Default is |
||
tilePixelRatio |
number | 1 | The pixel ratio used by the tile service. For example, if the tile service advertizes 256px by 256px tiles but actually sends 512px by 512px images (for retina/hidpi devices) then |
|
format |
string | 'image/jpeg' | Image format. Only used when |
|
version |
string | '1.0.0' | WMTS version. |
|
matrixSet |
string | Matrix set. |
||
dimensions |
Object | Additional "dimensions" for tile requests. This is an object with properties named like the advertised WMTS dimensions. |
||
url |
string | A URL for the service. For the RESTful request encoding, this is a URL template. For KVP encoding, it is normal URL. A |
||
tileLoadFunction |
module:ol/Tile~LoadFunction | Optional function to load a tile given a URL. The default is |
||
urls |
Array. |
An array of URLs. Requests will be distributed among the URLs in this array. |
||
wrapX |
boolean | false | Whether to wrap the world horizontally. |
|
transition |
number | Duration of the opacity transition for rendering. To disable the opacity transition, pass |
其中;url,matrixSet,format,projection,tileGrid,style,wrapX需要填写。我们需要找到这些信息。
国家天地图服务如下:
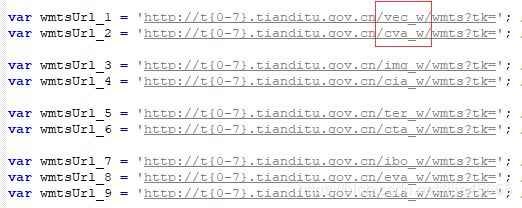
// 全球影像地图服务(经纬度) http://t0.tianditu.com/img_c/wmts
// 全球影像注记服务(经纬度) http://t0.tianditu.com/cia_c/wmts
// 全球影像地图服务(墨卡托投影) http://t0.tianditu.com/img_w/wmts
// 全球影像注记服务(墨卡托投影) http://t0.tianditu.com/cia_w/wmts
// 全球矢量地图服务(经纬度) http://t0.tianditu.com/vec_w/wmts
// 全球矢量注记服务(经纬度) http://t0.tianditu.com/cva_w/wmts
// 全球矢量地图服务(墨卡托投影) http://t0.tianditu.com/vec_c/wmts
// 全球矢量注记服务(墨卡托投影) http://t0.tianditu.com/cva_c/wmts
自2018年开始,国家天地服务加入key,需要在后面加入一段key代码(从国家天地图网站开发者用户那获得)。
以天地图影像地图服务为例,参数设置如下:
url(数据源服务地址):http://t{0-7}.tianditu.com/img_c/wmts?tk=""
matrixSet(投影坐标系设置矩阵):'EPSG 4326'
(注:img_c中的C表示经纬度,W表示网络墨卡托。而天地图经纬度为cgcs2000坐标系,ol只支持wgs84参数,所以使用EPSG 4326,对应的网络墨卡托投影为EPSG 3857)
format(图片格式):'tiles'(image/png)
projection(数据投影坐标系):ol.proj.get("EPSG:4326")
注:从EPSG 4326获取
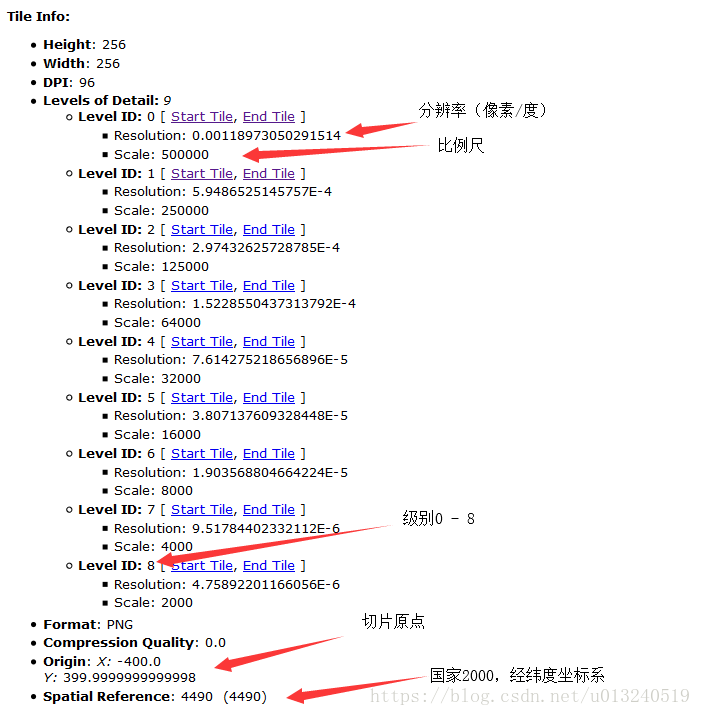
tileGrid(瓦片网格对象):new ol.tilegrid.TileGrid({
origin: origin=[-400, 400];, //原点(左上角)
resolutions: resolutions= [0.00118973050291514, 5.9486525145757E-4,
2.97432625728785E-4, 1.5228550437313792E-4,
7.614275218656896E-5, 3.807137609328448E-5,
1.903568804664224E-5, 9.51784402332112E-6] //分辨率数组
matrixIds: matrixIds=[0, 1, 2, 3, 4, 5, 6, 7] //矩阵标识列表,与地图级数保持一致
})
(注:此项涉及较多参数,涉及地图服务原点,地图各级分辨率大小,以及地图层级)
示意:
style(风格):'default'
wrapX(地图是否横向覆盖):'true'
通用接口加载方式
在谷歌浏览器上,我们按住F12,进入开发者模式,随便找一个网络地图,如百度地图,找到一张切片如下:

网络地址为:https://ss0.bdstatic.com/8bo_dTSlR1gBo1vgoIiO_jowehsv/starpic/?qt=satepc&u=x=1473;y=315;z=13;v=009;type=sate&fm=46&app=webearth2&v=009&udt=20190620
后面的有u=x=1473;y=315;z=13的字样(我们通常使用xyz这样的坐标来精确定位一张瓦片。通常z用于表示地图层级,而xy表示某个层级内的瓦片平面,x为横纵坐标,y为纵轴坐标,类似于数学上常见的笛卡尔坐标系。在这个瓦片平面上的每一个瓦片在横轴和纵轴上都有对应的坐标:x和y。),说明它也是瓦片地图常规的表示形式,这也是所有瓦片需要定位显示的基本参数。
正因为如此,OpenLayers 提供了ol.source.XYZ这种通用的Source来适应广大的在线瓦片地图数据源,具备很好的适用性。通常情况下,开发者想要加载不同的在线瓦片地图源,则只需要更改ol.source.XYZ的构造参数中url就可以了。 比如我们就可以不用ol.source.OSM,而用ol.source.XYZ来加载Open Street Map地图,结果一样:
// Open Street Map 地图层
        var openStreetMapLayer = new ol.layer.Tile({
            source: new ol.source.XYZ({
                url: 'http://{a-c}.tile.openstreetmap.org/{z}/{x}/{y}.png'
            })
        });
高德地图:
// 高德地图层
var gaodeMapLayer = new ol.layer.Tile({
    source: new ol.source.XYZ({
        url:'http://webst0{1-4}.is.autonavi.com/appmaptile?lang=zh_cn&size=1&scale=1&style=7&x={x}&y={y}&z={z}'
    })
});
Yahoo地图:
var yahooMapLayer = new ol.layer.Tile({
    source: new ol.source.XYZ({
        tileSize: 512,
        url:'https://{0-3}.base.maps.api.here.com/maptile/2.1/maptile/newest/normal.day/{z}/{x}/{y}/512/png8?lg=ENG&ppi=250&token=TrLJuXVK62IQk0vuXFzaig%3D%3D&requestid=yahoo.prod&app_id=eAdkWGYRoc4RfxVo0Z4B'
    })
});
通过上面的示例我们已经发现,其实可以非常轻松地加载多种不同来源的在线瓦片地图。但遗憾地是,上面这种简单方法并不适用于所有的在线瓦片地图,总有一些是特殊的,比如百度地图,上面这种方式就不生效了。此时,我们需要回过头来思考一下瓦片地图加载的整个过程:瓦片地图加载的关键在于找对瓦片,但要找对瓦片,就得知道瓦片的坐标,而坐标又需要明确的坐标系。我们在坐标里说过,任何坐标都得有坐标系才有意义。在OpenLayers 3中,默认使用的瓦片地图的坐标系是如何定义的?经分析可知,OpenLayers 3的瓦片坐标系的原点在左上角,向上为y轴正方向,向右为x轴正方向。具体到地图上来讲,地球经过投影,投影到一个平面上,平面最左边对应地球最西边,平面最上边对应地球最北边。原点就处于整个平面的左上角,即地球的西北角,从北向南为y轴负方向,从西向东为x轴正方向。理解这一点非常重要,因为并不是所有在线的瓦片地图都是采用这样的坐标系。用OpenLayers 3加载它们的时候,如果坐标系不同,计算出来的瓦片地址就获取不到对应的瓦片,为解决这个问题,我们必须要先对瓦片坐标进行转换。那么,具体该怎么实现转换?最详细明了的方式还是看实例,下面我们看一下加载百度地图一种实现方式:
代码如下:
和前面几个加载在线瓦片地图的例子不一样的地方在于,我们没有设置url,而是设置了tileUrlFunction,这是一个获取瓦片url的函数,如果自定义这个函数,就可以实现不同坐标系之间的转换,从而返回在线地图服务对应瓦片的url。通过代码可以看到,函数入参是一个瓦片坐标,然后进行一系列的转换,得到百度在线地图的瓦片地址。效果参见上方地图,不妨拖动、缩放试试,拼接无缝,并没有什么问题。
tileUrlFunction这个自定义函数的代码实现有可能看不懂,虽然知道在进行坐标转换,但并不知道为什么要这样实现。为了彻底弄明白代码,我们必须得把之前遗漏的一个很重要环节补上:弄明白待加载的在线瓦片地图的坐标系。对百度在线瓦片坐标系进行简单分析发现,它是以某一个位置为原点,向右为x正方向,向上为y正方向的坐标系,进一步分析发现,原点应该在中心位置,为此,我们假设百度地图是以经纬度[0,0]为原点,在此基础上编写函数tileUrlFunction的实现。halfTileNum表示的是在当前缩放层级之下,总的瓦片个数的一半,意味着它就是中心位置。对于baiduX小于0的情况,百度使用了M来表示负号,所以要特殊处理一下。想必这下应该更加理解代码实现了。不同的在线瓦片地图的转换代码可能不同,需要根据对应的坐标系来确定。
但上面这个地图并不完美,因为我们设定的地图中心为成都,然而实际上显示的地图中心并不在成都。虽然无缝拼接,但位置偏差有点远。由此基本可以排除坐标转换的问题,看起来应该是OpenLayers 3的分辨率和百度在线瓦片地图使用的分辨率对不上。经过分析发现,确实如此,在网上也有很多分析文章可以查阅。那么我们是否可以重新定义分辨率呢? 答案是肯定的,我们可以使用ol.source.XYZ的父类来解决问题。
重新定义OpenLayers 的瓦片坐标系
ol.source.TileImage作为ol.source.XYZ的父类,除了可以转换坐标之外,还具备更加强大的功能,修改分辨率。下面我们使用它来加载百度地图,这次是正确的:
对应的代码:
这个代码同上面的代码相比,引入了ol.tilegrid.TileGrid,由名字可见,这是定义瓦片网格,其实就是瓦片坐标系,构造时需要设定原点,紧接着设置分辨率,其作用在于设定每一地图层级的分辨率。我们是否遗漏了坐标系的正向和负向的设定?默认情况下,从左向右为x正方向,从下向上为y轴正方向。这和我们数学上通常定义的笛卡尔坐标系是一样的,这一点需要大家记住。如代码所示,就可以重新定义OpenLayers 3的瓦片地图坐标系,这种方式的代码比上一种方式更加的可读和简洁。 如果用通用的方法解决不了,请别忘记还有这一强大灵活的处理方式。
分析瓦片地图坐标系
如何分析不同在线瓦片地图的坐标系呢?非常重要的一点是,先从特例出发,找简单的情况分析,比如选择z为2或者3进行分析,这种情况下,瓦片的数量比较少,可以查看整个地球范围内的地图的瓦片请求,注意分析其请求的url参数。上述的所有地图都可以以这样的方式入手来分析,包括百度地图,可以自行尝试该方法。如果你有更好的方法,愿意的话,请给大家一起分享一下。
解密瓦片url
瓦片的url解析对于想直接使用在线瓦片服务的开发者而言,是一项经常要做的事。根据难度,大致可以分为三种情况:
- 第一种是最简单的,请求瓦片的
url明确有xyz参数,比如高德地图和百度地图。 - 第二种稍微难一点,
xyz作为路径直接存在于url里面,没有明确的参数表明哪些是xyz,比如Open Street Map和Yahoo地图,这种情况下,地图服务器接收到请求后,就直接在服务器按照这个路径获取图片,按照这个逻辑,一般第一个参数表示是z,第二个参数为x,第三个参数为y。要想确认是否真是这样,可以写一个小程序来验证一下,如果还有问题,建议按照上面分析地图坐标系中的方法,从z比较小的情况入手来分析x,y,z的位置。 - 第三种则最难,地图服务提供商为了防止大家直接非法使用瓦片地图,对瓦片的url进行了加密,比如现在的微软Bing中文地图和Google地图,这种情况下只有知道如何解密才能使用。
加载微软Bing中文地图
前面两种url的实例已经有了,此处分享一下第三种情况的url解密,以微软Bing中文地图为例:
图中显示的瓦片地图请求的url,没有明显的xyz参数,最有可能的存放xyz参数的地方在于url前面那一串数字,真实情况确实是这样的,经过分析和解码,最终实现了加载Bing中文地图:
代码如下:
需要注意的是地图数据是非常昂贵的,如果使用某一个在线地图服务,请先核实对方的版权和数据使用申明,不要侵犯对方的权益,按照要求合法使用地图。几乎所有的在线地图服务都提供了响应的服务接口,强烈建议在商用项目中使用这些接口。对于这些接口的使用,服务商都有详细的说明,在此不累述。
google地图加载
有许多人都在问google地图加载的问题,因为地图url是加密的,通过分析url,可以采用下面的方式来加载:
代码如下:
各类地图加载深入
上图中列了关于瓦片图层加载相关的重要方法。
- Map对象初始化时根据options.renderer创建ol.renderer.Map的实例,默认是ol.renderer.canvas.Map;
- ol.render.canvas.Map实现了抽象方法createLayerRenderer,这是一个简单工厂,根据不同的图层创建对应的ol.renderer.Layer。其中ol.layer.Tile对应的就是ol.renderer.canvas.TileLayer;
- ol.renderer.canvas.TileLayer.prepareFrame调用source对应的 TileGrid.getTileRangeForExtentAndResolution获取可视范围内的瓦片范围,并循环遍历加载瓦片;
- TileGrid在初始化时就计算出了对应layer的所有瓦片范围:
- calculateTileRanges-》循环遍历resolutions,调用 getTileRangeForExtentAndZ,根据extent计算瓦片范围;
- getTileRangeForExtentAndResolution计算瓦片的范围:
  ol.tilegrid.TileGrid.prototype.getTileRangeForExtentAndResolution = function(
    extent, resolution, opt_tileRange) {
    var tileCoord = ol.tilegrid.TileGrid.tmpTileCoord_;
    // 根据extent的左下角的计算瓦片坐标;
    this.getTileCoordForXYAndResolution_(
      extent[0], extent[1], resolution, false, tileCoord);
    var minX = tileCoord[1];
    var minY = tileCoord[2];
      // 根据extent的右上角的计算瓦片坐标;
     this.getTileCoordForXYAndResolution_(
        extent[2], extent[3], resolution, true, tileCoord);
    // 得到某个resolution级别下的瓦片范围(左下角瓦片坐标 - 右上角瓦片坐标)
    return ol.TileRange.createOrUpdate(
      minX, tileCoord[1], minY, tileCoord[2], opt_tileRange);
   };

  // 根据extent左下角及右上角的坐标-origin后得到地图的长宽 / resolution得到像素值;
  // 然后 / tileSize 得到需要多少张瓦片;
  // 当计算extent右上角的瓦片坐标时,因为瓦片坐标是从0开始计算,当瓦片数量为例如1.5此类小数时,
  // 应该是2张瓦片,从0开始计算,那么XY就应该向下取整,取1;0,1两张瓦片;
  ol.tilegrid.TileGrid.prototype.getTileCoordForXYAndResolution_ = function(
    x, y, resolution, reverseIntersectionPolicy, opt_tileCoord) {
    var z = this.getZForResolution(resolution);
    var scale = resolution / this.getResolution(z);
    var origin = this.getOrigin(z);
    var tileSize = ol.size.toSize(this.getTileSize(z), this.tmpSize_);

    var adjustX = reverseIntersectionPolicy ? 0.5 : 0;
    var adjustY = reverseIntersectionPolicy ? 0 : 0.5;
    var xFromOrigin = Math.floor((x - origin[0]) / resolution + adjustX);
    var yFromOrigin = Math.floor((y - origin[1]) / resolution + adjustY);
    var tileCoordX = scale * xFromOrigin / tileSize[0];
    var tileCoordY = scale * yFromOrigin / tileSize[1];

    if (reverseIntersectionPolicy) {
      tileCoordX = Math.ceil(tileCoordX) - 1;
      tileCoordY = Math.ceil(tileCoordY) - 1;
    } else {
      tileCoordX = Math.floor(tileCoordX);
      tileCoordY = Math.floor(tileCoordY);
    }

    return ol.tilecoord.createOrUpdate(z, tileCoordX, tileCoordY, opt_tileCoord);
  };
通过上述分析后,应该能较好的理解瓦片的坐标是如何计算的,当应用到不同的地图瓦片加载时就可以得心应手。以下通过不同的几种类型继续说明瓦片计算的方式:
1、TMS瓦片加载
先看看TMS瓦片的规则,origin在左下角,X轴从左至右递增,Y轴从下往上递增(先计算左下角,然后计算右上角)。
而TileGrid设置origin为ol.extent.getBottomLeft(extent)后,规则也是从左下角到右上角,X轴从左至右递增,Y轴从下往上递增,与TMS规则是完全一致的,参考代码与参考效果如下:
  var resolutions = [];
  var tileSize = 256;
  var extent = [12665080.52765571, 2550703.6338763316, 12725465.780000998, 2601457.820657688]; //深圳地区
  var projection = new ol.proj.get("EPSG:3857");
  var projectionExtent = projection.getExtent();

  for (var i = 0; i < 19; i++) {
    resolutions[i] = Math.pow(2, 18 - i);
  }

  var tilegrid = new ol.tilegrid.TileGrid({
    origin: ol.extent.getBottomLeft(projectionExtent),
    resolutions: resolutions,
    extent: projectionExtent,//extent,
    tileSize: [256, 256],
  });

  var map = new ol.Map({
    target: "map",
    layers: [
      // 调试瓦片
      new ol.layer.Tile({
        source: new ol.source.TileDebug({
          projection: projection,
          tileGrid: tilegrid,
          tileSize: [256, 256],
          extent :  projectionExtent,
          wrapX: false
        }),
      })
    ],
    view: new ol.View({
      projection: projection,
      center: [12697184.079535482, 2563239.3065151004],//深圳
      resolutions: resolutions,
    }),
  });
  map.getView().setZoom(1);
假如上面代码中,我想只显示深圳地区的瓦片,其余的瓦片不显示,这种场景是很普遍的,那么代码调整如下:
  var tilegrid = new ol.tilegrid.TileGrid({
    origin: ol.extent.getBottomLeft(projectionExtent),  //origin位置不能变!!!!!!
    resolutions: resolutions,
    extent:  extent,//projectionExtent //设置extent为深圳片区的extent;
    tileSize: [256, 256],
  });

  // ..................

  // 调试瓦片
  new ol.layer.Tile({
    source: new ol.source.TileDebug({
      projection: projection,
      tileGrid: tilegrid,
      extent: extent,//projectionExtent //设置extent为深圳片区的extent;
      wrapX: false
    }),
  })
2、WMTS瓦片加载
WMTS规则如下,origin在左上角,X轴从左至右递增,Y轴是从上往下递增(先计算左上角,然后计算右下角)
那么将tileGrid设置origin为ol.extent.getTopLeft(projectionExtent), 但是TileGrid始终都是先计算左下角的瓦片坐标,然后计算右上角的瓦片坐标,因此Y轴是相反的。那么修改Y轴坐标就可以得到正确值:
  var tilegrid = new ol.tilegrid.TileGrid({
    origin: ol.extent.getTopLeft(projectionExtent),  // WMTS Origin在左上角,origin位置不能变;
    resolutions: resolutions,
    extent: extent,
    tileSize: [256, 256],
  });

  // 其余代码略.....
  new ol.layer.Tile({
    source: new ol.source.TileImage({
      projection: projection,
      tileGrid: tilegrid(),
      tileUrlFunction: function (tileCoord, pixelRatio, proj) {
        if (!tileCoord) {
          return "";
        }
        var z = tileCoord[0];
        var x = tileCoord[1];
        var y = -tileCoord[2] - 1; // y轴取反,-1目的是为了从0开始计数;

        return ''; // 自行设置URL ,请注意 WMTS中用TileRow标识Y,用TileCol表示X;
      }
    }),
  })
3、百度地图瓦片加载
百度瓦片片规则如下:Origin在[0,0],X轴从左至右递增,Y轴从下往上递增(从左下角到右上角)。
从百度的瓦片规则看出来,与TileGrid的规则是完全一致,将origin设置为[0,0]即可。参考代码如下:
  var tilegrid = new ol.tilegrid.TileGrid({
    origin: [0, 0],
    resolutions: resolutions,
    extent: extent,//projectionExtent,
    tileSize: [256, 256],
  });

 var tilesource = new ol.source.TileImage({
    projection: projection,
    tileGrid: tilegrid,
    tileUrlFunction: function (xyz, obj1, obj2) {
      if (!xyz) {
        return "";
      }
      var z = xyz[0]+ 11; // 从第11级开始加载;深圳地区;
      var x = xyz[1];
      var y = xyz[2];
      if (x < 0) {
        x = "M" + (-x);
      }
      if (y < 0) {
        y = "M" + (-y);
      }
      return "http://online3.map.bdimg.com/tile/?qt=tile&x=" + x + "&y=" + y + "&z=" + z + "&styles=pl&udt=20141119&scaler=1";
    }
  });
4、腾讯地图瓦片加载
腾讯地图完全遵守TMS规则,地图投影坐标系采用Web Mercator投影,最小缩放级别为第4级。参考代码如下:
  // QQ地图完全遵守TMS规则;
  var tileGrid = new ol.tilegrid.TileGrid({
    resolutions: resolutions3857,
    tileSize: [256, 256],
    extent: projection3857Extent,
    origin: ol.extent.getBottomLeft(projection3857Extent), // Origin左下角
  });

  var tilesource = new ol.source.TileImage({
    tileUrlFunction: function (xyz, obj1, obj2) {
      if (!xyz) {
        return "";
      }
      var z = xyz[0];
      var x = xyz[1];
      var y = xyz[2];
      return "http://rt1.map.gtimg.com/realtimerender?z=" + z + "&x=" + x + "&y=" + y + "&type=vector&style=0&v=1.1.2"
    },
    projection: projection3857,
    tileGrid : tileGrid
  });
矢量地图加载
网络的矢量地图有GeoJSON,TopoJSON,GML,KML等,使用ol.source.vector即可加载:
   new ol.layer.Vector({
                source: new ol.source.Vector({
                    url: '../data/geojson/line-samples.geojson',     // 地图来源
                    format: new ol.format.GeoJSON()    // 解析矢量地图的格式化类
                })
source与layer配套使用,有什么样的source,就用什么样的layer加载。
View
View,视图的意思,视图是每个webgis实例的基本组成部分。在前面的代码中,已经或多或少的接触到view这个对象,也大致可以看到view的一些参数,如:center、zoom、Resolution、projection、Rotation等等。从地图开发的角度来说,不管我们使用何种开发方式,地图视图的一些基本属性似乎是必备的:分辨率、比例尺、中心点、地图投影、旋转参数等等。在官网中我们可以看到一个新的视图参数:
| Name | Type | Description | ||||||||||||||||||||||||||||||||||||||||||||||||||||||||||||
|---|---|---|---|---|---|---|---|---|---|---|---|---|---|---|---|---|---|---|---|---|---|---|---|---|---|---|---|---|---|---|---|---|---|---|---|---|---|---|---|---|---|---|---|---|---|---|---|---|---|---|---|---|---|---|---|---|---|---|---|---|---|---|
options |
View options.
|
|||||||||||||||||||||||||||||||||||||||||||||||||||||||||||||
center(视图中心对象):表示地图视图的中心位置,用二维坐标点表示,用于初始化地图视图的中心位置
constrainRotation(旋转约束值):布尔值,false意味着没有约束。true意味着没有约束。4表示四个旋转状态值:0度,90度,180度和270度。
enableRotation(启用旋转):布尔值,false,不能旋转,true,可旋转。
extent(范围):视图显示范围,[左下角经度,左下角纬度,右上角经度,右上角纬度]。
maxResolution(最大分辨率),minResolution(最小分辨率)
maxZoom(最大缩放级别),minZoom(最小缩放级别)
projection(地图投影):默认地图投影为网络墨卡托投影
resolution(视图初始分辨率)
resolutions(分辨率矩阵)
rotation(初始化旋转参数):弧度为单位,0时,北正向
zoom(初始化缩放级别)
zoomFactor(缩放系数):maxResolution(最大分辨率),minResolution(最小分辨率)maxZoom(最大缩放级别),minZoom(最小缩放级别)都设置了,此项无效。
我们在文章开始的时候,就已经说过,layers、view 、target都是map对象的填充参数,此三者并列。视图对象的存在主要在于显示地图,虽然layer也有控制地图范围的功能,但是视图对象侧重于我们的观感,在哪里显示,显示范围多大,分辨率是多少,缩放级别是多少等等。相对应的我们需要临时改变这些参数的时候,视图也提供了相应的方法,方便我们传参,进而可以导航显示地图。
view: new ol.View({
// 设置地图中心点
center: [104.06, 30.67],
projection: 'EPSG:4326',
zoom: 10
}),
此代码含义就是,为地图创建一个新的视图,中心点在[104.06, 30.67],地图投影为'EPSG:4326'(经纬度直投),缩放比例尺10.
在官网api上可以查询相关方法:https://openlayers.org/en/latest/apidoc/module-ol_View-View.html

以配合控件、事件进行导航操作。
|
|