Machine Learning - XIV. Dimensionality Reduction降维 (Week 8)
http://blog.csdn.net/pipisorry/article/details/44705051
机器学习Machine Learning - Andrew NG courses学习笔记
降维Dimensionality Reduction
{a second type of unsupervised learning problem called dimensionality reduction.as data compression not only allows us to compress the data also allow us to speed up our learning algorithms}
Dimensionality Reduction降维的目的
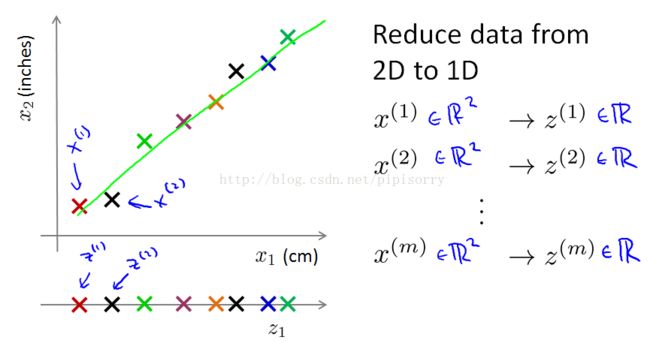
1. 数据压缩Data Compression
将二维数据投影到一维(绿线),用一个数据点就可以近似表示原始数据了。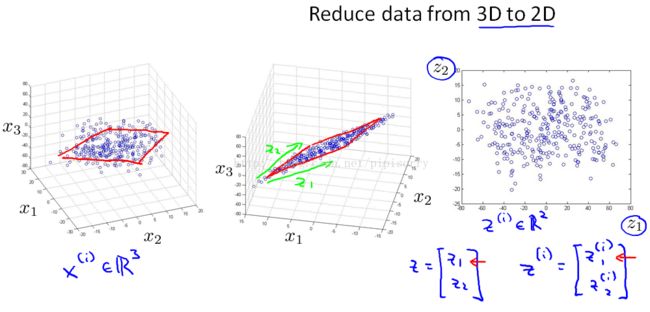
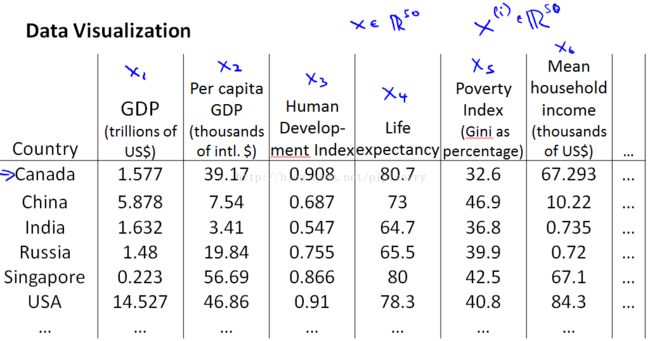
2. 可视化Visualization
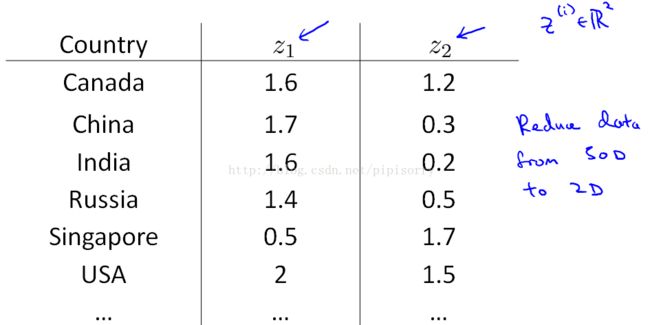
Note:if we can have just a pair of numbers, z1 and z2 that somehow, summarizes my 50 numbers, maybe we can plot these countries in R2 and use that to try to understand the space in [xx] of features of different countries [xx] the better and is reduce the data from 50D,to 2D.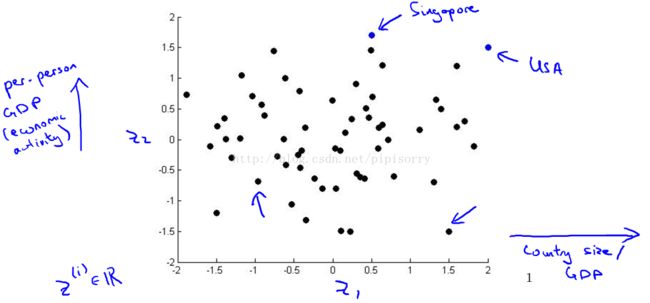
Note:So, you might find,for example, That the horizontial axis Z1 corresponds roughly to the overall country size, or the overall economic activity of a country.Whereas the vertical axis correspond to the per person GDP.and,you might find that, given these 50 features,these are really the 2 main dimensions of the deviation.
[主成分分析(PCA)的交互可视化]
主成分分析Principal Component Analysis
PCA公式定义
Note:
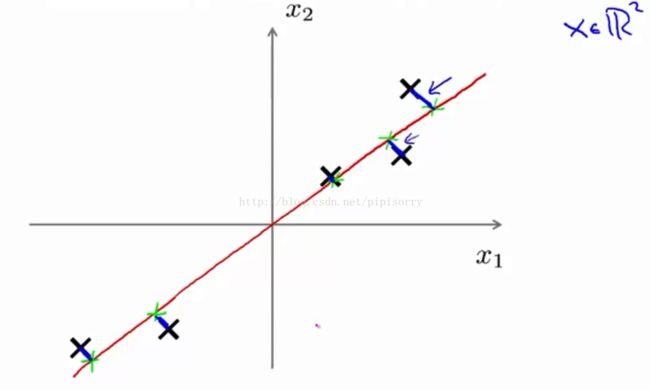
1. PCA tries to find a lower-dimensional surface really a line in this case, onto which to project the data, so that the sum of squares of these little blue line segments(the projection error) is minimized.
2. As an a side, before applying PCA it's standard practice to first perform mean normalization and feature scaling so that the features, X1 and X2,should have zero mean and should have comparable ranges of values.
3. PCA would choose something like the red line rather than like the magenta line down here.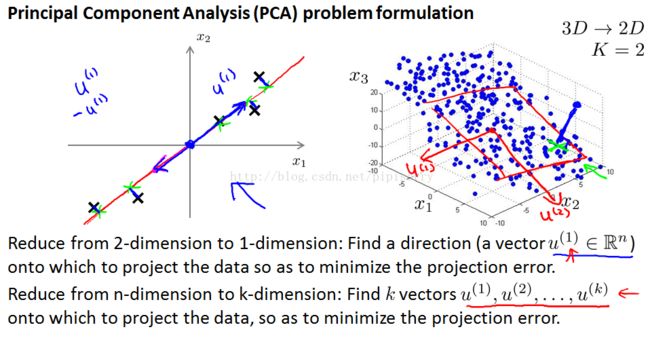
Note:
1. whether it gives me positive U1 or -U1,it doesn't matter, because each of these vectors defines the same red line onto which I'm projecting my data.
2. For those of you that are familiar with linear algebra, for those of you that are really experts in linear algebra, the formal definition of this is that we're going to find a set of vectors, U1 U2 maybe up to Uk, and project the data onto the linear subspace spanned by this set of k vectors.But if you are not familiar with linear algebra, just think of it as finding k directions instead of just one direction, onto which to project the data.
PCA和线性规划的区别

Note:
1. linear regression tries to minimize the vertical distance between a point and the value predicted by the hypothesis, whereas in PCA, it tries to minimize the magnitude of these blue lines,these are really the shortestorthogonal(垂直的) distances.
2. more generally when you're doing linear regression there is this distinguished variable ythat we're trying to predict,linear regression is taking all the values of X and try to use that to predict Y(最小化到对应实际y值的距离和). Whereas in PCA, there is no distinguished or there is no special variable Ythat we're trying to predict(而是都投影到一个平面), and instead we have a list of features x1, x2, and so on up to xN, and all of these features are treated equally.
PCA算法
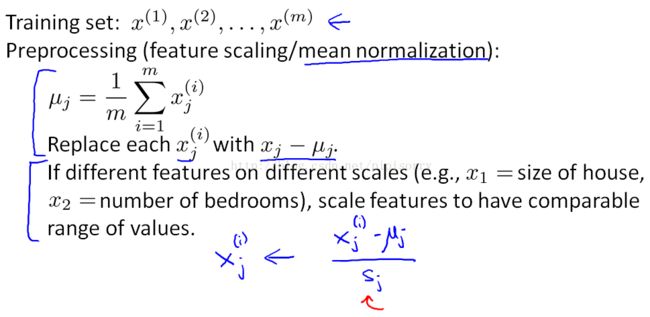
数据预处理
sj is some measure of the beta values of feature j,it could be the max minus min value, or more commonly,it is the standard deviation of feature j.如果features取值范围非常不同,feature scaling是有必要的。
主成分分析PCA算法
{PCA算法就是要建立新子空间u,并求出原来的高维表示x 在新坐标上对应的值低维表示z}
Note:
1. PCA need to come up with a way to compute two things.One is to compute these vectors,u1 and u2.the other is how do we compute Z.
2. It turns out that a mathematical derivation, also the mathematical proof, for what is the right value U1, U2, Z1,Z2, and so on.That mathematical proof is very complicated.
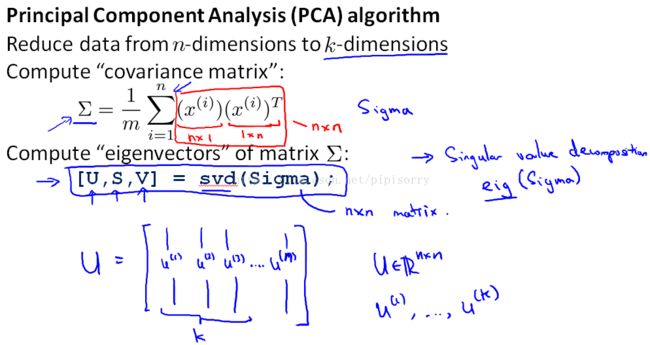
Note:
1. covariance matrix协方差矩阵:Sigma Matrix ∑ is a summation symbol.
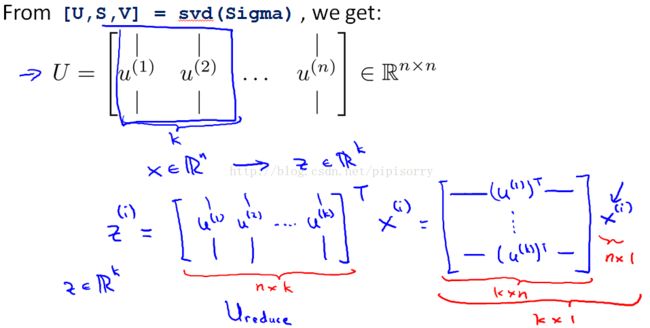
2. 计算矩阵∑的特征向量。The SVD function and the I function it will give the same vectors(because the covariance matrix always satisfies a mathematical Property called symmetric positive definite对称正定), although SVD is a little more numerically stable.So I tend to use SVD.
3. u matrix 是一个N阶酉矩阵。
4. if we want to reduce the data from n dimensions down to k dimensions, then what we need to do is take the first k vectors.
5. these x's can be Examples in our training、cross validation set、test set.
PCA算法总结
Note:
1. 方框中的sigma计算的向量形式。
2. similar to k Means, if you're apply PCA, the way you'd apply this is with vectors X ∈ RN.So, this is not done withX-0 = 1.
3. I didn't give a mathematical proof that the U1 and U2 and so on and the Z and so on you get out of this procedure is really the choices that would minimize these squared projection error.I didn't prove that why PCA tries to do is try to find a surface or line onto which to project the data so as to minimize to square projection error.
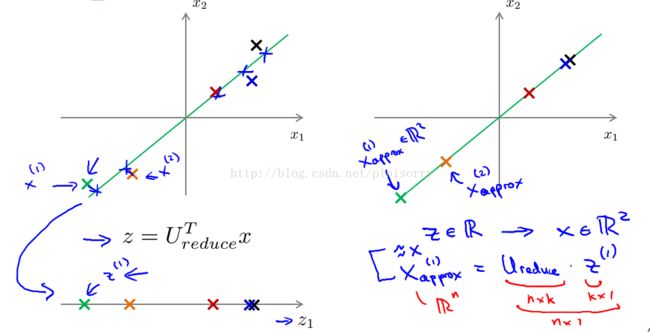
Reconstruction from Compressed Representation从压缩表示中重构
{So, given z(i), which maybe a hundred dimensional, how do you go back to your original representation x(i), which was maybe a thousand dimensional}
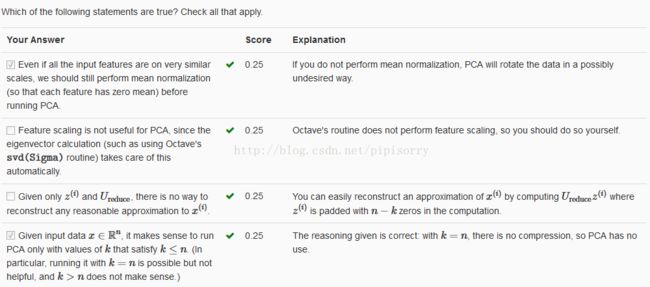
Note: 可以近似还原的原因:酉矩阵U满足U*UT = I, 也就是Z = UT*X => U*Z = U*UT*X = X
Choosing the Number of Principal Components选择主成分的数目
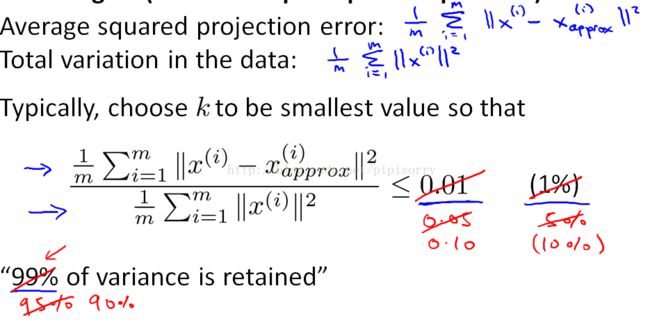
variance retained保留的方差
Note:
1. the total variation : How far on average are the training examples from the origin.
2. Maybe 95 to 99 is really the most common range of values that people use.
3. For many data sets you'd be surprised, in order to retain 99% of the variance, you can oftenreduce the dimension of the data significantly and still retain most of the variance.Because for most real life data says many features are just highly correlated, and so it turns out to be possible to compress the data a lot and still retain 99% of the variance.
4. 上式可以认为是x坐标还原后的偏移不超过原来坐标位置的1%
k选择的实现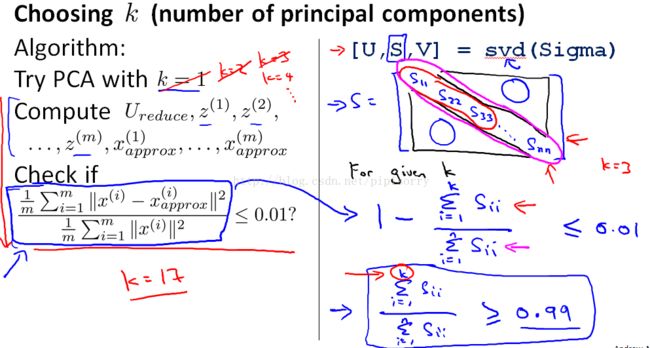

Note:
1. It is one way to choose the smallest value of k, so that and 99% of the variance is retained.But this procedure seems horribly inefficient.Fortunately when you implement PCA,it actually gives us a quantity that makes it much easier to compute these things(like右边).
2. the right is really a measure of your square of construction error, that ratio being 0.01, just gives people a good intuitive sense of whether your implementation of PCA is finding a good approximation of your original data set.
3. 图像压缩的SVD分解表示:reconMat = U [:,:numSV ] * SigRecon * VT [: numSV,:];
这里的numSV相当于上面的k,SigRecon是只取前k个值的s, 也可以用于近似还原原图(不用计算协方差)。
[Peter Harrington - Machine Learning in Action - 1 4 . 6 基于SVD的图像压缩][TopicModel - LSA(隐性语义分析)模型和其实现的早期方法SVD]
应用PCA的建议
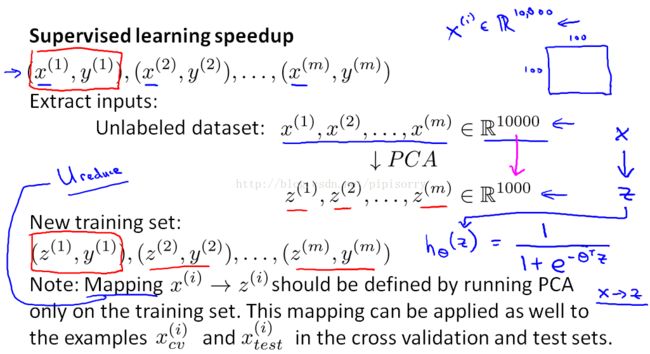
PCA可以用于加速学习
Note:
1. check our labeled training set and extract just the X's and temporarily put aside the Y's.
2. if you have a new example, maybe a new test example X. take your test example x,map it through the same mapping that was found by PCA to get you your corresponding z.then gets fed to this hypothesis, and this hypothesis then makes a prediction on your input x.
3. U reduce is like a parameter that is learned by PCA and we should be fitting our parameters only to our training sets.
4. And then having found U reduced for feature scaling where the mean normalization and scaling the scale that you divide the features by to get them on to comparable scales.
Note:for visualization applications, we'll usually choose k equals 2 or k equals 3, because we can plot only 2D and 3D data sets.
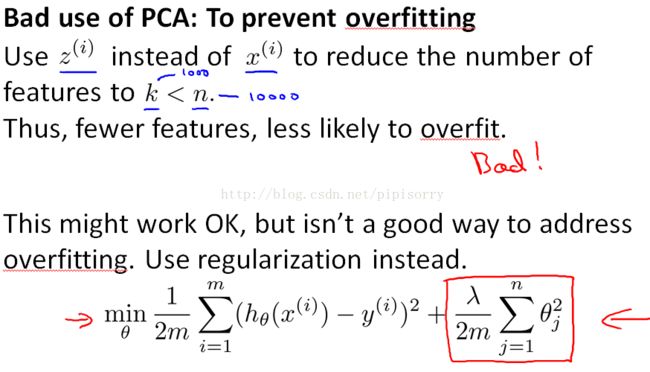
PCA在防止overfitting上的不好应用
Note:
1. fewer features to fix high variance(overfitting))[Machine Learning - X. Advice for Applying Machine Learning (Week 6) ]
2. the reason of bad use is,PCA does not use the labels y.just looking at inputs xi to find a lower-dimensional approximation to your data.it throws away some information.It throws away or reduces the dimension of your data without knowing what the values of y is.it turns out that just using regularization will often give you at least as good a method for preventing over-fitting and often just work better, because with regularization, this minimization problem actually knows what the values of y are, and so is less likely to throw away some valuable information, whereas PCA doesn't make use of the labels and is more likely to throw away valuable information.
2. it is a good use of PCA to speed up your learning algorithm, but using PCA to prevent over-fitting isnot.
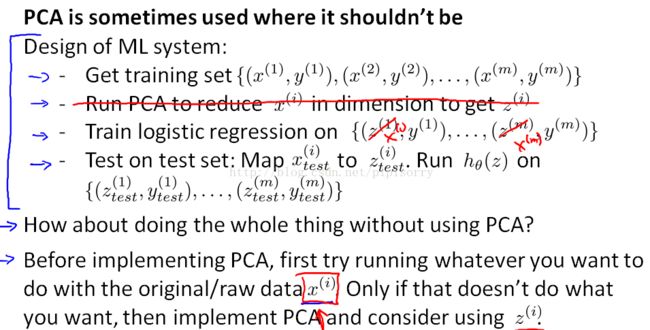
应用PCA的建议
recommend, instead of putting PCA into the algorithm, just try doing whatever it is you're doing with the xi first. And only if you have a reason to believe that doesn't work, so that only if your learning algorithm ends up running too slowly, or only if the memory requirement or the disk space requirement is too large,so you want to compress your representation.
Review复习
from:http://blog.csdn.net/pipisorry/article/details/44705051
