Fisher(LDA)判别的推导+python代码实现二分类
Fisher判别的推导
- 一、Fisher算法的主要思想
- 二、Fisher数学算法步骤
- ①计算各类样本均值向量 m i m_i mi, m i m_i mi是各个类的均值, N i N_i Ni是 w i w_i wi类的样本个数。
- ②计算样本类内离散度矩阵 S i S_i Si和总类内离散度矩阵 S w S_w Sw
- ③计算样本类间离散度矩阵 S b S_b Sb
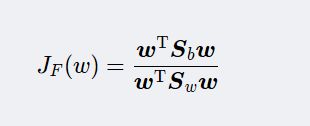
- ④求投影方向向量 W W W (维度和样本的维度相同)。我们希望投影后,在一维 Y Y Y空间里各类样本尽可能分开,就是我们希望的两类样本均值之差 ( m 1 ‾ − m 2 ‾ ) (\overline{m_1}-\overline{m_2}) (m1−m2)越大越好,同时希望各类样本内部尽量密集,即是:希望类内离散度越小越好。因此,我们可以定义Fisher准则函数为:
- 2使得 J F ( w ) J_F(w) JF(w)取得最大值 w w w为:
- ⑤将训练集内所有样本进行投影。
- ⑥. 计算在投影空间上的分割阈值 y 0 y_0 y0,在一维Y空间,各类样本均值 m i ‾ \overline{m_i} mi为:
- ⑦对于给定的测试样本 x x x,计算出它在 w w w上的投影点 y y y
- ⑧根据决策规则分类!
- 三、python代码实现
- 1.数据生成
- 2、fisher算法实现
- 3、判断类别
- 4.绘图
- 5.运行结果:
一、Fisher算法的主要思想
- 线性判别分析(Linear Discriminant Analysis
简称LDA)是一种经典的线性学习方法,在二分类问题上因为最早由【Fisher,1936年】提出,所以也称为“Fisher 判别分析!”
Fisher(费歇)判别思想是投影,使多维问题简化为一维问题来处理。选择一个适当的投影轴,使所有的样本点都投影到这个轴上得到一个投影值。对这个投影轴的方向的要求是:使每一类内的投影值所形成的类内离差尽可能小,而不同类间的投影值所形成的类间离差尽可能大。

二、Fisher数学算法步骤
- 为了找到最佳投影方向,需要计算出 各类样本均值、样本类内离散度矩阵 Si\boldsymbol S_{i}S i和样本总类内离散度矩阵 Sw\boldsymbolS_{w}Sw、样本类间离散度矩阵 Sb\boldsymbol S_{b}Sb ,根据Fisher准则,找到最佳投影向量,将训练集内的所有样本进行投影,投影到一维Y空间,由于Y空间是一维的,则需要求出Y空间的划分边界点,找到边界点后,就可以对待测样本进行一维Y空间投影,判断它的投影点与分界点的关系,将其归类。具体方法如下(以两类问题为例子):
①计算各类样本均值向量 m i m_i mi, m i m_i mi是各个类的均值, N i N_i Ni是 w i w_i wi类的样本个数。
②计算样本类内离散度矩阵 S i S_i Si和总类内离散度矩阵 S w S_w Sw
③计算样本类间离散度矩阵 S b S_b Sb
④求投影方向向量 W W W (维度和样本的维度相同)。我们希望投影后,在一维 Y Y Y空间里各类样本尽可能分开,就是我们希望的两类样本均值之差 ( m 1 ‾ − m 2 ‾ ) (\overline{m_1}-\overline{m_2}) (m1−m2)越大越好,同时希望各类样本内部尽量密集,即是:希望类内离散度越小越好。因此,我们可以定义Fisher准则函数为:
2使得 J F ( w ) J_F(w) JF(w)取得最大值 w w w为:
⑤将训练集内所有样本进行投影。
⑥. 计算在投影空间上的分割阈值 y 0 y_0 y0,在一维Y空间,各类样本均值 m i ‾ \overline{m_i} mi为:

样本类内离散度 S i ‾ 2 \overline{S_i}^2 Si2和总类内离散度 S w ‾ \overline{S_w} Sw

而此时类间离散度就成为两类均值差的平方。

⑦对于给定的测试样本 x x x,计算出它在 w w w上的投影点 y y y
⑧根据决策规则分类!
三、python代码实现
1.数据生成
from sklearn.datasets import make_multilabel_classification
import numpy as np

x, y = make_multilabel_classification(n_samples=20, n_features=2,
                                      n_labels=1, n_classes=1,
                                      random_state=2)  # 设置随机数种子,保证每次产生相同的数据。

# 根据类别分个类
index1 = np.array([index for (index, value) in enumerate(y) if value == 0])  # 获取类别1的indexs
index2 = np.array([index for (index, value) in enumerate(y) if value == 1])  # 获取类别2的indexs

c_1 = x[index1]   # 类别1的所有数据(x1, x2) in X_1
c_2 = x[index2]   # 类别2的所有数据(x1, x2) in X_2
2、fisher算法实现
# 2、Fisher算法实现
def cal_cov_and_avg(samples):
    """
    给定一个类别的数据,计算协方差矩阵和平均向量
    :param samples:
    :return:
    """
    u1 = np.mean(samples, axis=0)
    cov_m = np.zeros((samples.shape[1], samples.shape[1]))
    for s in samples:
        t = s - u1
        cov_m += t*t.reshape(2, 1)
    return cov_m, u1
def fisher(c_1, c_2):
    """
    fisher算法实现(参考上面的推导公式进行理解)
    :param c_1:
    :param c_2:
    :return:
    """
    cov_1, u1 = cal_cov_and_avg(c_1)
    cov_2, u2 = cal_cov_and_avg(c_2)
    s_w = cov_1 + cov_2          # 总类内离散度矩阵。
    u, s, v = np.linalg.svd(s_w) # 下面的参考公式(4-10)
    s_w_inv = np.dot(np.dot(v.T, np.linalg.inv(np.diag(s))), u.T)
    return np.dot(s_w_inv, u1 - u2)
3、判断类别
def judge(sample, w, c_1, c_2):
    """
    返回值:ture 属于1;false 属于2
    :param sample:
    :param w:
    :param c_1:
    :param c_2:
    :return:
    """
    u1 = np.mean(c_1, axis=0)
    u2 = np.mean(c_2, axis=0)
    center_1 = np.dot(w.T, u1) # 参考公式(2-8)
    center_2 = np.dot(w.T, u2)
    pos = np.dot(w.T, sample)  # 新样本进来判断
    return abs(pos - center_1) < abs(pos - center_2)

w = fisher(c_1, c_2)             # 调用函数,得到参数w
out = judge(c_2[1], w, c_1, c_2) # 判断所属的类别。
print(out)
4.绘图
# 4、绘图功能
plt.scatter(c_1[:, 0], c_1[:, 1], c='red')
plt.scatter(c_2[:, 0], c_2[:, 1], c='blue')
line_x = np.arange(min(np.min(c_1[:, 0]), np.min(c_2[:, 0])),
                   max(np.max(c_1[:, 0]), np.max(c_2[:, 0])),
                   step=1)
line_y = -(w[0]*line_x) / w[1]
plt.plot(line_x, line_y, linewidth=3.0,  label = 'fisher boundary line ')
plt.legend(loc='upper right')
plt.xlabel('feature 1')
plt.ylabel('feature 2')
plt.show()
5.运行结果:
参考链接:https://blog.csdn.net/abc13526222160/article/details/90611743


