【百度PaddlePaddle “人流密度检测 ”— 比赛】实战记录
说明
任务描述:
要求参赛者给出一个算法或模型,对于给定的图片,统计图片中的总人数。给定图片数据,选手据此训练模型,为每张测试数据预测出最准确的人数;数据说明:
本竞赛所用训练和测试图片均来自一般监控场景,但包括多种视角(如低空、高空、鱼眼等),图中行人的相对尺寸也会有较大差异。部分训练数据参考了公开数据集(如ShanghaiTech [1], UCF-CC-50 [2], WorldExpo’10 [3],Mall [4] 等)。
本竞赛的数据标注均在对应json文件中,每张训练图片的标注为以下两种方式之一:
(1)部分数据对图中行人提供了方框标注(boundingbox),格式为[x, y, w, h][x,y,w,h];
(2)部分图对图中行人提供了头部的打点标注,坐标格式为[x, y][x,y]。
此外部分图片还提供了忽略区(ignore_region)标注,格式为[x_0, y_0, x_1, y_1, …, x_n, y_n]组成的多边形(注意一张图片可能有多个多边形忽略区),图片在忽略区内的部分不参与训练/测试;
这是比赛说明:《百度“人流密度估计”竞赛.pdf》
这是比赛数据集(含2k张训练照片和1k张测试照片):人流密度预测数据集
![]()
Code
import zipfile
import paddle
import paddle.fluid as fluid
import matplotlib.pyplot as plt
import matplotlib.image as mping
from PIL import Image
import json
import numpy as np
import cv2
import sys
import time
import h5py
# import scipy.io as io
from matplotlib import pyplot as plt
from scipy.ndimage.filters import gaussian_filter
import scipy
from matplotlib import cm as CM
from paddle.utils.plot import Ploter
import os
1. 处理图片标签
解压文件,然后根据数据集的标签生成一个标签字典,用于后续查询比对校验:
# 解压文件
if(not os.path.isdir("train")):
        z = zipfile.ZipFile("data/data1917/train_new.zip", 'r')
        z.extractall("")
        z.close()

start = time.time()
#把图片对应的标签装入字典
f = open('/home/aistudio/data/data1917/train.json',encoding='utf-8')
content = json.load(f)

print(content.keys())
print('info:',content['info'])
print('stage:',content['stage'])
print('split:',content['split'])
print(content['annotations'][0].keys())
print(content['annotations'][0]['type'])
print(content['annotations'][0][ 'id'])
print(content['annotations'][1677]['ignore_region'])
print(content['annotations'][9]['name'])
print(content['annotations'][9]['num'])
将字典中的文件名称加上路径信息,方便后续查找:
#把stage1都去掉:
for j in range(len(content['annotations'])):
    # print(content['annotations'][1]['name'])
    content['annotations'][j]['name'] = content['annotations'][j]['name'].lstrip('stage1').lstrip('/').lstrip('rain').lstrip('/')
print(content['annotations'][1]['name'])
![]()
2. 解压数据集压缩包
#读取解压文件里的信息
zfile = zipfile.ZipFile("data/data1917/train_new.zip")
l = []
for fname in zfile.namelist()[1:]:
    # print(fname)
    l.append(fname)
# 随便打印一个
print(l[3])
name = l[3]
# 解压文件
if(not os.path.isdir("train")):
        z = zipfile.ZipFile("data/data1917/train_new.zip", 'r')
        z.extractall("")
        z.close()
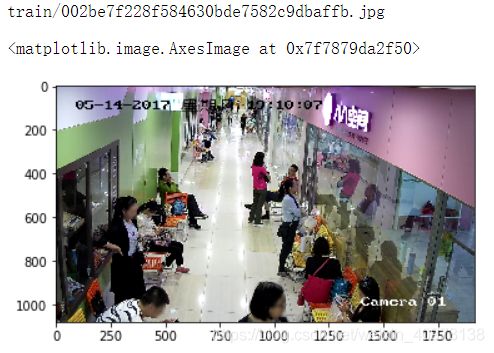
# 显示一张照片
im = Image.open(name)
plt.imshow(im)
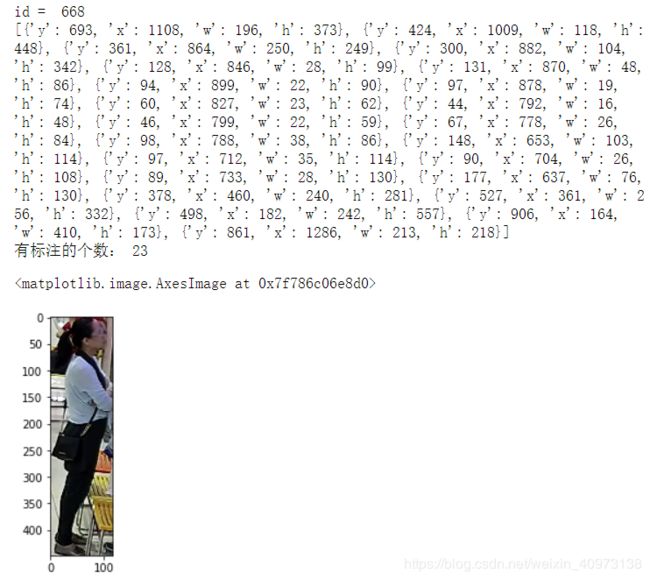
3. 看看标签里标注的框框是啥样
#查看标注的信息
for j in range(len(content['annotations'])):
    if content['annotations'][j]['name'] == name:
        print('id = ',content['annotations'][j]['id'])   #图片id
        ann = content['annotations'][j]['annotation']
print(ann)       #图片标注格式是x,y,w,h,有些只有x,y
print('有标注的个数:',len(ann))
#可视化第三个标注的信息
lab = 1
box = (ann[lab]['x'],ann[lab]['y'],ann[lab]['x']+ann[lab]['w'],ann[lab]['y']+ann[lab]['h'])
new_img = im.crop(box=box)
plt.imshow(new_img)
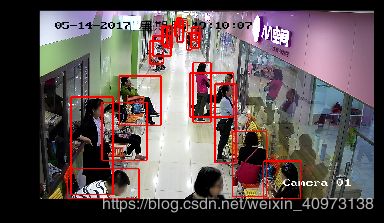
4. 让我们来可视化所有框框
#可视化图片所有标注信息
width = im.size[0]    #获取宽度
height = im.size[1]   #获取长度
print(width,height)
for a in range(len(ann)):        #遍历所有标注
    for x in range(width):
        for y in range(height):
            # r,g,b = im.getpixel((x,y))
            if(x > (ann[a]['x']-5) and x < (ann[a]['x']+5) and y > ann[a]['y'] and y < (ann[a]['y']+ann[a]['h'])):
                im.putpixel((x,y),(255,0,0))        #画一条长(x,y)到(x,y+h)的红线,红线宽为正负5个像素点
            if(x > (ann[a]['x']+ann[a]['w']-5) and x < (ann[a]['x']+ann[a]['w']+5) and y > ann[a]['y'] and y < (ann[a]['y']+ann[a]['h'])):
                im.putpixel((x,y),(255,0,0))       #画一条长(x+w,y)到(x+w,y+h)的红线,红线宽为正负5个像素点
            if(y > (ann[a]['y']-5) and y < (ann[a]['y']+5) and x > ann[a]['x'] and x < (ann[a]['x']+ann[a]['w'])):
                im.putpixel((x,y),(255,0,0))        #画一条长(x,y)到(x+w,y)的红线,红线宽为正负5个像素点
            if(y > (ann[a]['y']+ann[a]['h']-5) and y < (ann[a]['y']+ann[a]['h']+5) and x > ann[a]['x'] and x < (ann[a]['x']+ann[a]['w'])):
                im.putpixel((x,y),(255,0,0))        #画一条长(x,y+h)到(x+w,y+h)的红线,红线宽为正负5个像素点
plt.imshow(im)
l_set = []
s_2560_1920 = []   #方框   鱼眼电梯   63张
s_928_576 = []     #点   自动售货机   248张
s_1024_768 = []    #点   街拍        302
s_640_480 = []     #点   家拍        92
s_2048_2048 =[]    #方框   鱼眼电梯   41
s_1080_1618 =[]    #滤掉             1
s_1920_1080 = []   #方框   超市       1240
s_1440_1080 =[]    #滤掉               1
s_1920_1200 =[]    #方框   街拍        12
for inde in range(2000):
    imm = Image.open(content['annotations'][inde]['name'])
    l_set.append(imm.size)
    if imm.size == (2560, 1920):s_2560_1920.append(content['annotations'][inde]['name'])
    elif imm.size == (928, 576):s_928_576.append(content['annotations'][inde]['name'])
    elif imm.size == (1024, 768):s_1024_768.append(content['annotations'][inde]['name'])
    elif imm.size == (640, 480):s_640_480.append(content['annotations'][inde]['name'])
    elif imm.size == (2048, 2048):s_2048_2048.append(content['annotations'][inde]['name'])
    elif imm.size == (1080, 1618):s_1080_1618.append(content['annotations'][inde]['name'])
    elif imm.size == (1920, 1080):s_1920_1080.append(content['annotations'][inde]['name'])
    elif imm.size == (1440, 1080):s_1440_1080.append(content['annotations'][inde]['name'])
    elif imm.size == (1920, 1200):s_1920_1200.append(content['annotations'][inde]['name'])
print(len(l_set))
sett = set(l_set)
print(sett)
print(len(s_2560_1920),len(s_928_576),len(s_1024_768),len(s_640_480),len(s_2048_2048),len(s_1080_1618),len(s_1920_1080),len(s_1440_1080),len(s_1920_1200))
print(s_1440_1080)
print(s_1080_1618)
print(s_1024_768)
point_l = []
# 遍历2k张照片
for f in range(2000):
    if 'w' not in content['annotations'][f]['annotation'][0]:
        point_l.append(content['annotations'][f]['name'])
# for p_name in point_l:
#     print(p_name)
print(len(point_l))
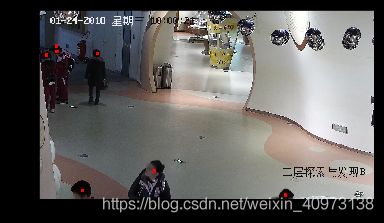
5. 若某些图片是用圆点标注
#如果标注是一个坐标不是区域
# name1 = 'train/b179764112252559b76a59db9fa18021.jpg'
name1 = point_l[1]
im1 = Image.open(name1)
for j in range(len(content['annotations'])):
    if content['annotations'][j]['name'] == name1:
        print('id = ',content['annotations'][j]['id'])
        ann1 = content['annotations'][j]['annotation']
# print(ann1)
print('有标注的个数:',len(ann1))
for a in range(len(ann1)):
    for x in range(im1.size[0]):
        for y in range(im1.size[1]):
            if(x > (ann1[a]['x']-10) and x < (ann1[a]['x']+10) and y > ann1[a]['y']-10 and y < (ann1[a]['y']+10)):  #取坐标范围正负10的像素
                im1.putpixel((x,y),(255,0,0))           #对所取范围的像素变成红色
plt.imshow(im1)
gt = []
for a in range(len(ann1)):
    gt.append([ann1[a]['x'],ann1[a]['y']])
print(gt)
gt = np.array(gt)
print(gt.shape)
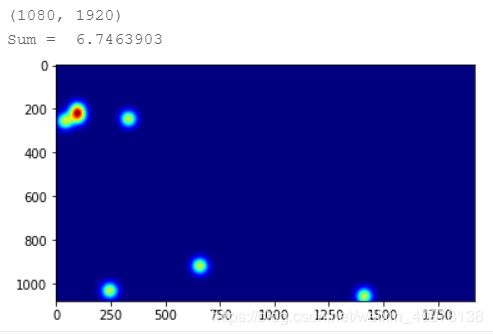
[[43, 257], [98, 206], [333, 247], [102, 236], [247, 1032], [660, 919], [1414, 1057]]
(7, 2)
gt_count = np.count_nonzero(gt)
print(gt_count)
print(np.nonzero(gt))
14
(array([0, 0, 1, 1, 2, 2, 3, 3, 4, 4, 5, 5, 6, 6]), array([0, 1, 0, 1, 0, 1, 0, 1, 0, 1, 0, 1, 0, 1]))
pts = np.array(list(zip(np.nonzero(gt)[1].ravel(), np.nonzero(gt)[0].ravel())))
print(pts)
6. 高斯滤波
def gaussian_filter_density(gt):
    #Generates a density map using Gaussian filter transformation

    density = np.zeros(gt.shape, dtype=np.float32)

    gt_count = np.count_nonzero(gt)

    if gt_count == 0:
        return density

    # FInd out the K nearest neighbours using a KDTree

    pts = np.array(list(zip(np.nonzero(gt)[1].ravel(), np.nonzero(gt)[0].ravel())))

    # if gt_count > 0 and gt_count < 20:

    # leafsize = 2048

    # # build kdtree
    # tree = scipy.spatial.KDTree(pts.copy(), leafsize=leafsize)

    # query kdtree
    # distances, locations = tree.query(pts, k=4)
    for i, pt in enumerate(pts):
        pt2d = np.zeros(gt.shape, dtype=np.float32)
        pt2d[pt[1],pt[0]] = 1.
        if gt_count > 1:
            # sigma = (distances[i][1]+distances[i][2]+distances[i][3])*0.1
            sigma = 25
        else:
            sigma = np.average(np.array(gt.shape))/2./2. #case: 1 point

        #Convolve with the gaussian filter

        density += scipy.ndimage.filters.gaussian_filter(pt2d, sigma, mode='constant')

    return density
7. 查看人群分布热力图
print(gt.shape)

img= plt.imread(name1)
k = np.zeros((img.shape[0],img.shape[1]))

for i in range(0,len(gt)):
    if int(gt[i][1])<img.shape[0] and int(gt[i][0])<img.shape[1]:
        k[int(gt[i][1]),int(gt[i][0])]=1

    # generate density map
k = gaussian_filter_density(k)
print(k.shape)
groundtruth = np.asarray(k)
# groundtruth = groundtruth.resize((80,60))
plt.imshow(groundtruth,cmap=CM.jet)
print("Sum = " ,np.sum(groundtruth))
# print(groundtruth[0][59:100])
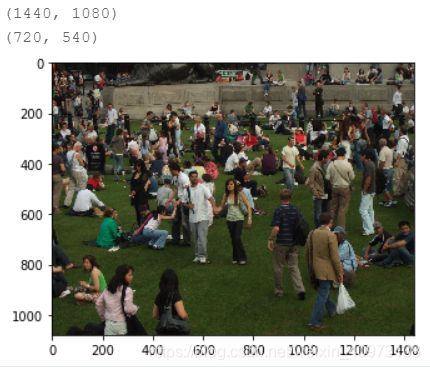
name = 'train/8538edb45aaf7df78336aa5b49001be6.jpg'
imm = Image.open(name)
print(imm.size)

plt.imshow(imm)
im_size = (int(imm.size[0]/2),int(imm.size[1]/2))
aaa = imm.resize(im_size)
print(aaa.size)
8. 图片操作
#图片操作
def picture_opt(img,ann):
    size_x,size_y = img.size
    train_img_size = (640,480)
    img = img.resize(train_img_size,Image.ANTIALIAS)
    img = np.array(img)
    img = img / 255.0

    gt = []
    for b_l in range(len(ann)):
        if 'w' in ann[b_l].keys():
            x = (ann[b_l]['x']+(ann[b_l]['x']+ann[b_l]['w']))/2
            y = ann[b_l]['y']+20
            x = (x*640/size_x)/8
            y = (y*480/size_y)/8
            gt.append((x,y))
        else:
            x = ann[b_l]['x']
            y = ann[b_l]['y']
            x = (x*640/size_x)/8
            y = (y*480/size_y)/8
            gt.append((x,y))

    return img,gt
9. 密集图处理
#密度图处理
def ground(img,gt):
    imgs = img
    x = imgs.shape[0]/8
    y = imgs.shape[1]/8
    k = np.zeros((int(x),int(y)))

    for i in range(0,len(gt)):
        if int(gt[i][1]) < int(x) and int(gt[i][0]) < int(y):
            k[int(gt[i][1]),int(gt[i][0])]=1

        # generate density map
    k = gaussian_filter_density(k)
    return k
10. 方框变点
#方框变点
qt = []
img = Image.open(content['annotations'][2]['name'])
ann = content['annotations'][2]['annotation']

size_x,size_y = img.size
train_img_size = (640,480)
img = img.resize(train_img_size)

im,qt = picture_opt(img,ann)
print(im.shape)
print(qt)
for a in range(len(qt)):
    for x in range(img.size[0]):
        for y in range(img.size[1]):
            if(x > (qt[a][0]-10) and x < (qt[a][0]+10) and y > qt[a][1]-10 and y < (qt[a][1]+10)):  #取坐标范围正负10的像素
                img.putpixel((x,y),(255,0,0))           #对所取范围的像素变成红色
plt.imshow(img)
k = ground(im,qt)
def train_set():
    def inner():
        for ig_index in range(2000):                  #遍历所有图片
            if len(content['annotations'][ig_index]['annotation']) == 2:continue
            if len(content['annotations'][ig_index]['annotation']) == 3:continue
            if content['annotations'][ig_index]['name'] == 'train/8538edb45aaf7df78336aa5b49001be6.jpg':continue
            if content['annotations'][ig_index]['name'] == 'train/377df0a7a9abc44e840e938521df3b54.jpg':continue
            if content['annotations'][ig_index]['ignore_region']:                      #把忽略区域都用像素为0填上
                ig_list = []                                                           #存放忽略区1的数据
                ig_list1 = []                                                          #存放忽略区2的数据
                # print(content['annotations'][ig_index]['ignore_region'])
                if len(content['annotations'][ig_index]['ignore_region'])==1:           #因为每张图的忽略区域最多2个,这里是为1的情况
                    # print('ig1',ig_index)
                    ign_rge = content['annotations'][ig_index]['ignore_region'][0]       #取第一个忽略区的数据
                    for ig_len in range(len(ign_rge)):                                   #遍历忽略区坐标个数,组成多少变型
                        ig_list.append([ign_rge[ig_len]['x'],ign_rge[ig_len]['y']])       #取出每个坐标的x,y然后组成一个小列表放到ig_list
                    ig_cv_img = cv2.imread(content['annotations'][ig_index]['name'])      #用cv2读取一张图片
                    pts = np.array(ig_list,np.int32)                                      #把ig_list转成numpy.ndarray数据格式,为了填充需要
                    cv2.fillPoly(ig_cv_img,[pts],(0,0,0),cv2.LINE_AA)                           #使用cv2.fillPoly方法对有忽略区的图片用像素为0填充

                    ig_img = Image.fromarray(cv2.cvtColor(ig_cv_img,cv2.COLOR_BGR2RGB))   #cv2转PIL

                    ann = content['annotations'][ig_index]['annotation']          #把所有标注的信息读取出来

                    ig_im,gt = picture_opt(ig_img,ann)
                    k = ground(ig_im,gt)

                    groundtruth = np.asarray(k)
                    groundtruth = groundtruth.T.astype('float32')
                    ig_im = ig_im.transpose().astype('float32')
                    yield ig_im,groundtruth

                if len(content['annotations'][ig_index]['ignore_region'])==2:           #有2个忽略区域
                    # print('ig2',ig_index)
                    ign_rge = content['annotations'][ig_index]['ignore_region'][0]
                    ign_rge1 = content['annotations'][ig_index]['ignore_region'][1]
                    for ig_len in range(len(ign_rge)):
                        ig_list.append([ign_rge[ig_len]['x'],ign_rge[ig_len]['y']])
                    for ig_len1 in range(len(ign_rge1)):
                        ig_list1.append([ign_rge1[ig_len1]['x'],ign_rge1[ig_len1]['y']])
                    ig_cv_img2 = cv2.imread(content['annotations'][ig_index]['name'])
                    pts = np.array(ig_list,np.int32)
                    pts1 = np.array(ig_list1,np.int32)
                    cv2.fillPoly(ig_cv_img2,[pts],(0,0,0),cv2.LINE_AA)
                    cv2.fillPoly(ig_cv_img2,[pts1],(0,0,0),cv2.LINE_AA)

                    ig_img2 = Image.fromarray(cv2.cvtColor(ig_cv_img2,cv2.COLOR_BGR2RGB))   #cv2转PIL

                    ann = content['annotations'][ig_index]['annotation']          #把所有标注的信息读取出来

                    ig_im,gt = picture_opt(ig_img2,ann)
                    k = ground(ig_im,gt)
                    k = np.zeros((int(ig_im.shape[0]/8),int(ig_im.shape[1]/8)))

                    groundtruth = np.asarray(k)
                    groundtruth = groundtruth.T.astype('float32')
                    ig_im = ig_im.transpose().astype('float32')
                    yield ig_im,groundtruth

            else:
                # print('else',ig_index,content['annotations'][ig_index]['name'])
                img = Image.open(content['annotations'][ig_index]['name'])
                ann = content['annotations'][ig_index]['annotation']          #把所有标注的信息读取出来

                im,gt = picture_opt(img,ann)
                k = ground(im,gt)

                groundtruth = np.asarray(k)
                groundtruth = groundtruth.T.astype('float32')
                im = im.transpose().astype('float32')
                yield im,groundtruth
    return inner
iter = train_set()()
data2 = next(iter)
data1 = next(iter)
data = next(iter) #生成的第一个数据
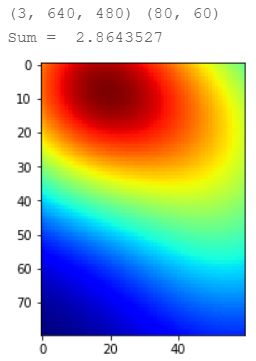
print(data[0].shape,data[1].shape) #数据格式
da = data[0].transpose()

plt.imshow(da)

dat = data[1] + 0.5
plt.imshow(data[1],cmap=CM.jet)
print("Sum = " ,np.sum(data[1]))
11. 定义reader
BATCH_SIZE= 20    #每次取10张
# 设置训练reader
train_reader = paddle.batch(
    paddle.reader.shuffle(
        train_set(), buf_size=50),
    batch_size=BATCH_SIZE)
12. 构造网络
def crowd_deconv_without_bn(img):
    x = img

    x = fluid.layers.conv2d(input=x, num_filters=64, filter_size=3, padding=1, act='relu')
    x = fluid.layers.batch_norm(input=x, act='relu')
    x = fluid.layers.conv2d(input=x, num_filters=64, filter_size=3, padding=1, act='relu')
    print('3-64-2',x.shape)
    x = fluid.layers.pool2d(input=x, pool_size=2, pool_stride=2)
    x = fluid.layers.dropout(x=x, dropout_prob=0.25)
    print('pool',x.shape)

    x = fluid.layers.conv2d(input=x, num_filters=128, filter_size=3, padding=1, act=None)
    x = fluid.layers.batch_norm(input=x, act='relu')
    x = fluid.layers.conv2d(input=x, num_filters=128, filter_size=3, padding=1, act='relu')
    print('3-128-2',x.shape)
    x = fluid.layers.pool2d(input=x, pool_size=2, pool_stride=2)
    x = fluid.layers.dropout(x=x, dropout_prob=0.25)

    x = fluid.layers.conv2d(input=x, num_filters=256, filter_size=3, padding=1, act='relu')
    x = fluid.layers.batch_norm(input=x, act='relu')
    x = fluid.layers.conv2d(input=x, num_filters=256, filter_size=3, padding=1, act=None)
    x = fluid.layers.batch_norm(input=x, act='relu')
    x = fluid.layers.conv2d(input=x, num_filters=256, filter_size=3, padding=1, act='relu')
    print('3-256-3',x.shape)
    x = fluid.layers.pool2d(input=x, pool_size=2, pool_stride=2)
    x = fluid.layers.dropout(x=x, dropout_prob=0.5)

    # x = fluid.layers.conv2d(input=x, num_filters=512, filter_size=3, padding=1, act='relu')
    # x = fluid.layers.conv2d(input=x, num_filters=512, filter_size=3, padding=1, act='relu')
    # x = fluid.layers.conv2d(input=x, num_filters=512, filter_size=3, padding=1,act='relu' )

    # x = fluid.layers.pool2d(input=x, pool_size=3, pool_stride=1, pool_padding=1)
    # x = fluid.layers.pool2d(input=x, pool_size=2, pool_stride=2)
    # x = fluid.layers.dropout(x=x, dropout_prob=0.5)

    x = fluid.layers.conv2d(input=x, num_filters=512, filter_size=3, padding=1, act='relu')
    x = fluid.layers.dropout(x=x, dropout_prob=0.5)
    x = fluid.layers.conv2d(input=x, num_filters=512, filter_size=3, padding=1, act='relu')
    x = fluid.layers.dropout(x=x, dropout_prob=0.5)
    x = fluid.layers.conv2d(input=x, num_filters=512, filter_size=3, padding=1)
    x = fluid.layers.batch_norm(input=x, act=None)
    print('3-512-3',x.shape)
    # x = fluid.layers.pool2d(input=x, pool_size=3, pool_stride=2, pool_padding=1)
    # x = fluid.layers.dropout(x=x, dropout_prob=0.5)
    print('clowd_net output shape:',x.shape)

    return x
def dilations_cnn(VGG_16_net):
    x = VGG_16_net
    print(x.shape)
    x = fluid.layers.conv2d(input=x, num_filters=512, filter_size=3, padding=2, dilation=2, act='relu')
    x = fluid.layers.dropout(x=x, dropout_prob=0.5)
    x = fluid.layers.conv2d(input=x, num_filters=512, filter_size=3, padding=2, dilation=2, act='relu')
    x = fluid.layers.dropout(x=x, dropout_prob=0.5)
    x = fluid.layers.conv2d(input=x, num_filters=512, filter_size=3, padding=2, dilation=2, act='relu')
    x = fluid.layers.dropout(x=x, dropout_prob=0.5)
    x = fluid.layers.conv2d(input=x, num_filters=256, filter_size=3, padding=2, dilation=2, act='relu')
    x = fluid.layers.dropout(x=x, dropout_prob=0.5)
    x = fluid.layers.conv2d(input=x, num_filters=128, filter_size=3, padding=2, dilation=2, act='relu')
    x = fluid.layers.dropout(x=x, dropout_prob=0.5)
    x = fluid.layers.conv2d(input=x, num_filters=64, filter_size=3, padding=2, dilation=2, act='relu')

    x = fluid.layers.conv2d(input=x, num_filters=1, filter_size=1, act=None)
    print(x.shape)
    return x
img_size = [3,640,480]
images = fluid.layers.data(name='images',shape=img_size,dtype='float32')
label = fluid.layers.data(name='label',shape=[1,80,60],dtype='float32')
VGG = crowd_deconv_without_bn(images)
predict = dilations_cnn(VGG)
squar = fluid.layers.square_error_cost(input=predict, label=label)
cost = fluid.layers.sqrt(squar, name=None)
avg_cost = fluid.layers.mean(cost)
13. 创建优化器
# 创建优化器optimizer,下面列举了2种常用的优化器,不同类型优化器选一即可
# 创建Momentum优化器,并设置学习率(learning_rate)、动量(momentum)
# optimizer = fluid.optimizer.Momentum(
#     learning_rate=0.001,
#     momentum=0.8)
optimizer = fluid.optimizer.AdamOptimizer(learning_rate=1e-6)
# optimizer = fluid.optimizer.SGD(learning_rate=1e-5)
optimizer.minimize(avg_cost)
print('优化')
14. 训练 + 保存模型
startup_program = fluid.default_startup_program()
main_program = fluid.default_main_program()
# test_program = fluid.default_main_program().clone(for_test=True)
#optimized = fluid.transpiler.memory_optimize(input_program=fluid.default_main_program(), print_log=False)
# 设置训练场所
# use_cuda = False
use_cuda = True
place = fluid.CUDAPlace(0) if use_cuda else fluid.CPUPlace()
# 创建执行器,palce在程序初始化时设定
exe = fluid.Executor(place)
# 初始化执行器
exe.run(startup_program)

feeder = fluid.DataFeeder(feed_list=[images, label],place=place)
#训练保存
model_save_dir = 'renliuyuce_model6'
train_prompt = "Train cost"
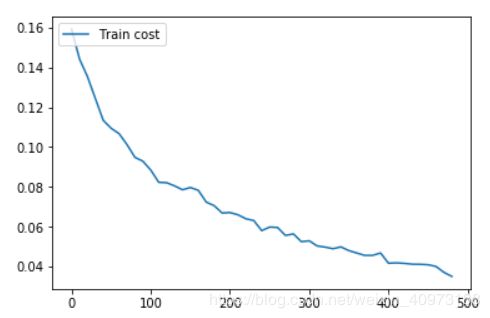
cost_ploter = Ploter(train_prompt)
def event_handler_plot(ploter_title, step, cost):
    cost_ploter.append(ploter_title, step, cost)
    cost_ploter.plot()
EPOCH_NUM = 5

# 开始训练
lists = []
step = 0
for epochs in range(EPOCH_NUM):
    # 开始训练
    for batch_id, train_data in enumerate(train_reader()):              #遍历train_reader的迭代器,并为数据加上索引batch_id
        train_cost,sult,lab,vgg = exe.run(program=main_program,      #运行主程序
                             feed=feeder.feed(train_data),              #喂入一个batch的数据
                             fetch_list=[avg_cost,predict,label,VGG])          #fetch均方误差和准确率
        if step % 10 == 0:
            event_handler_plot(train_prompt,step,train_cost[0])
        # print(batch_id)
        if batch_id % 10 == 0:                                   #每100次batch打印一次训练、进行一次测试
            p = [np.sum(pre) for pre in sult]
            l = [np.sum(pre) for pre in lab]
            print(p,l,np.sum(sult),np.sum(lab))
            print('Pass:%d, Batch:%d, Cost:%0.5f' % (epochs, batch_id, train_cost[0]))
        step += 1

    # 保存模型
    if model_save_dir is not None:
        fluid.io.save_inference_model(model_save_dir, ['images'], [predict], exe)

print('训练模型保存完成!')
end = time.time()
print(time.strftime('V100训练用时:%M分%S秒',time.localtime(end-start)))
15. 解压测试文件
# 解压文件
if(not os.path.isdir("test")):
        z = zipfile.ZipFile("data/data1917/test_new.zip", 'r')
        z.extractall("")
        z.close()
#测试图片
import numpy as np
from PIL import Image
import paddle.fluid as fluid
import matplotlib.pyplot as plt
import zipfile

test_zfile = zipfile.ZipFile("/home/aistudio/data/data1917/test_new.zip")
l_test = []
for test_fname in test_zfile.namelist()[1:]:
    l_test.append(test_fname)

test_img = Image.open(l_test[2])

plt.imshow(test_img)
test_img = test_img.resize((640,480))
test_im = np.array(test_img)
test_im = test_im / 255.0
test_im = test_im.transpose().reshape(1,3,640,480).astype('float32')

use = True
place1 = fluid.CUDAPlace(0) if use else fluid.CPUPlace()
# 定义一个executor
infer_exe = fluid.Executor(place1)

inference_scope = fluid.core.Scope()   #要想运行一个网络,需要指明它运行所在的域,确切的说: exe.Run(&scope) 。

model_save_dir = 'renliuyuce_model6'

with fluid.scope_guard(inference_scope):
    #获取训练好的模型
    #从指定目录中加载 推理model(inference model)
    [inference_program,                           # 预测用的program
     feed_target_names,                           # 是一个str列表,它包含需要在推理 Program 中提供数据的变量的名称。
     fetch_targets] = fluid.io.load_inference_model(model_save_dir, #fetch_targets:是一个 Variable 列表,从中我们可以得到推断结果。
                                                    infer_exe)      #infer_exe: 运行 inference model的 executor

    results = infer_exe.run(inference_program,                 #运行预测程序
                            feed={feed_target_names[0]: test_im},  #喂入要预测的img
                            fetch_list=fetch_targets)          #得到推测结果
    print(np.sum(results[0]))
16. 生成结果文件
#测试输出保存CSV

import numpy as np
from PIL import Image
import paddle.fluid as fluid
import matplotlib.pyplot as plt
import zipfile

test_zfile = zipfile.ZipFile("/home/aistudio/data/data1917/test_new.zip")
l_test = []
for test_fname in test_zfile.namelist()[1:]:
    # print(fname)
    l_test.append(test_fname)

use = True
place1 = fluid.CUDAPlace(0) if use else fluid.CPUPlace()
infer_exe = fluid.Executor(place1)

inference_scope = fluid.core.Scope()

model_save_dir = 'renliuyuce_model6'

data_dict = {}
with fluid.scope_guard(inference_scope):
    [inference_program,
     feed_target_names,
     fetch_targets] = fluid.io.load_inference_model(model_save_dir,infer_exe)

    for index in range(1000):
        test_img = Image.open(l_test[index])
        test_img = test_img.resize((640,480))
        test_im = np.array(test_img)
        test_im = test_im / 255.0
        test_im = test_im.transpose().reshape(1,3,640,480).astype('float32')
        l_test[index] = l_test[index].lstrip('test').lstrip('/')

        results = infer_exe.run(inference_program,                 #运行预测程序
                            feed={feed_target_names[0]: test_im},  #喂入要预测的img
                            fetch_list=fetch_targets)          #得到推测结果

        # print(people)
        people = np.sum(results)
        if index % 2 == 0:
            print(index,l_test[index],int(people))
        data_dict[l_test[index]]=int(people)
# 保存CSV
import csv
with open('results3.csv', 'w') as csvfile:
    fieldnames = ['id', 'predicted']
    writer = csv.DictWriter(csvfile, fieldnames=fieldnames)
    writer.writeheader()
    for k,v in data_dict.items():
        writer.writerow({'id': k, 'predicted':v})
![]()
最后
这一整份模型代码还有很多需要改进的地方,希望能够抛砖引玉,大家基于这个训练出更好的模型!
