Coursera课程自然语言处理(NLP)笔记整理(四) (第三周课程内容)
文章目录
- 1. word by word design
- 1.1. co-occurrence matrix
- 2. word by Documnet Design
- 3. 欧氏距离(Euclidean Distance)
- 4. 余弦相似性
- 5. 向量空间与words
- 6. 嵌入词的比对 Manipulating word embeddings
- 6.1. 引入必要的库和词库
- 6.2. 嵌入词的操作
- 6.3. 单词距离
- 6.3.1. 预测首都
- 6.3.2. 将句子表达为向量
- 7. PCA 主成分分析
- 7.1. 特征值和特征向量
- 7.2. 获得一组不相干特征
- 7.3. PCA的另一种解释
- 7.3.1. 依然是引入必要的库
- 7.3.2. pcaTr变换模型
- 7.3.2.1. 旋转矩阵
- 7.3.2.2. 相关正则随机变量
- 8. 附:最简单的Numpy与线性代数
- 8.1. numpy array 与 list的区别
- 8.2. 运算
- 8.2.1. 加法
- 8.2.2. 乘法
- 8.3. 矩阵
- 8.3.1. 矩阵的运算
- 8.3.2. 矩阵的转置
- 8.3.3. 矩阵的范数
- 8.3.4. 点乘
- 8.3.5. 按行或列求和
- 8.3.6. 按行或列求平均
- 8.3.7. 按行中心化矩阵
who, what, where, how, and etc
这节的基础线性代数知识太简单了,可以掠过。
1. word by word design
1.1. co-occurrence matrix
两个单词间的co-occurrence是指它们在你的语料库中在一定单词距离k内一起出现的次数
例:
比如有两句话
I like simple data
I prefer simple raw data
且k=2
| simple | raw | like | I | |
|---|---|---|---|---|
| data | 2 | 1 | 1 | 0 |
其中的2代表simple和data同时出现两次,后面两个1分别代表raw、like和data同时出现1次,0代表在k=2内I不和data同时出现
2. word by Documnet Design
例:
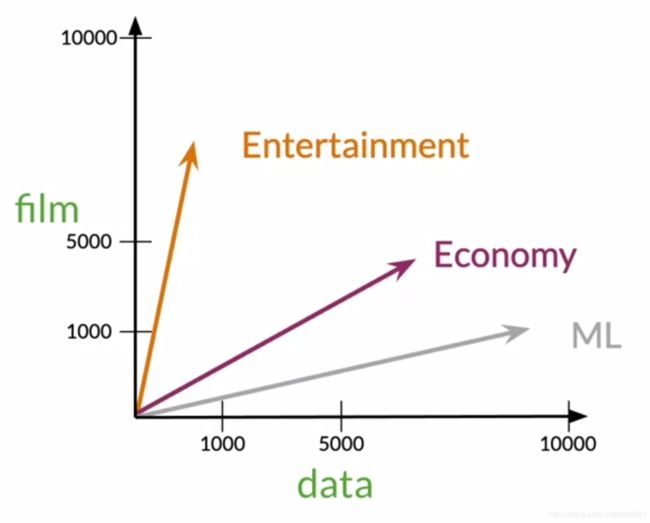
有Entertainment、Economy、Machine Learning三个文档
| Entertainment | Economy | Machine Learning | |
|---|---|---|---|
| data | 500 | 6620 | 9320 |
| film | 7000 | 4000 | 1000 |
< src="/pics/NLP/Vector1.png">
从图像上来讲,Economy和ML更加相近(相近:angle,distance)
3. 欧氏距离(Euclidean Distance)
在这里插入图片描述
基本数学知识,不再赘述
python 中的
v = np.array([1,6,8])
w = np.array([0,4,6])
d = np.linalg.norm(v-w)
4. 余弦相似性
图中d2 < d1,仅从距离判断,agriculture和history比agriculture和food更加接近。
另一种相似度的判断法是判断他们的余弦,角度越小则越相似。
在本例中,余弦更加适用于判断相似性。
v ⃗ ⋅ w ⃗ = ∣ ∣ v ⃗ ∣ ∣ ⋅ ∣ ∣ w ⃗ ∣ ∣ cos ( β ) , cos ( β ) = v ⃗ ⋅ w ⃗ ∣ ∣ v ⃗ ∣ ∣ ⋅ ∣ ∣ w ⃗ ∣ ∣ \vec v\cdot\vec w =||\vec v|| \cdot ||\vec w|| \cos(\beta),\cos(\beta) = \frac{\vec v\cdot \vec w}{||\vec v|| \cdot ||\vec w||} v⋅w=∣∣v∣∣⋅∣∣w∣∣cos(β),cos(β)=∣∣v∣∣⋅∣∣w∣∣v⋅w
由于坐标都是正数,因此一定都在第一象限内,夹角一定小于90°。最相似时两向量方向相同。
5. 向量空间与words
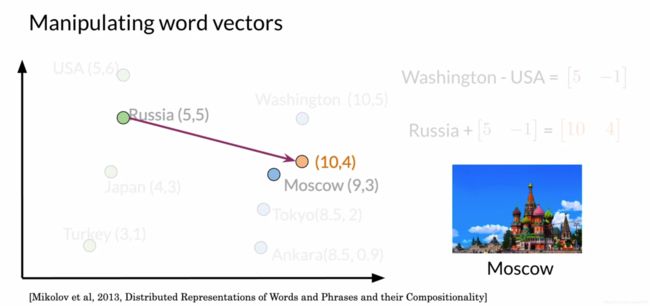
如图所示,首先有USA到首都Washington的向量[5,-1]
借此向量来预测Russia的首都,以Russia为起点做向量,终点为[10,4],最近的点是Moscow
6. 嵌入词的比对 Manipulating word embeddings
6.1. 引入必要的库和词库
import pandas as pd # Library for Dataframes
import numpy as np # Library for math functions
import pickle # Python object serialization library. Not secure

word_embeddings = pickle.load( open( "word_embeddings_subset.p", "rb" ) )
len(word_embeddings) # there should be 243 words that will be used in this assignment

countryVector = word_embeddings['country'] # Get the vector representation for the word 'country'
print(type(countryVector)) # Print the type of the vector. Note it is a numpy array
print(countryVector) # Print the values of the vector.
向量长度为300(谷歌新闻的Vocabulary size约为3 million)
#Get the vector for a given word:
def vec(w):
    return word_embeddings[w]
6.2. 嵌入词的操作
word有很多属性,我们暂且先用两个属性来堆砌进行可视化。
import matplotlib.pyplot as plt # Import matplotlib

words = ['oil', 'gas', 'happy', 'sad', 'city', 'town', 'village', 'country', 'continent', 'petroleum', 'joyful']

bag2d = np.array([vec(word) for word in words]) # Convert each word to its vector representation

fig, ax = plt.subplots(figsize = (10, 10)) # Create custom size image

col1 = 3 # Select the column for the x axis
col2 = 2 # Select the column for the y axis

# Print an arrow for each word
for word in bag2d:
    ax.arrow(0, 0, word[col1], word[col2], head_width=0.005, head_length=0.005, fc='r', ec='r', width = 1e-5)


ax.scatter(bag2d[:, col1], bag2d[:, col2]); # Plot a dot for each word

# Add the word label over each dot in the scatter plot
for i in range(0, len(words)):
    ax.annotate(words[i], (bag2d[i, col1], bag2d[i, col2]))


plt.show()
可得
< src ="/pics/NLP/Vector5.png">
6.3. 单词距离
words = ['sad', 'happy', 'town', 'village']

bag2d = np.array([vec(word) for word in words]) # Convert each word to its vector representation

fig, ax = plt.subplots(figsize = (10, 10)) # Create custom size image

col1 = 3 # Select the column for the x axe
col2 = 2 # Select the column for the y axe

# Print an arrow for each word
for word in bag2d:
    ax.arrow(0, 0, word[col1], word[col2], head_width=0.0005, head_length=0.0005, fc='r', ec='r', width = 1e-5)

# print the vector difference between village and town
village = vec('village')
town = vec('town')
diff = town - village
ax.arrow(village[col1], village[col2], diff[col1], diff[col2], fc='b', ec='b', width = 1e-5)

# print the vector difference between village and town
sad = vec('sad')
happy = vec('happy')
diff = happy - sad
ax.arrow(sad[col1], sad[col2], diff[col1], diff[col2], fc='b', ec='b', width = 1e-5)


ax.scatter(bag2d[:, col1], bag2d[:, col2]); # Plot a dot for each word

# Add the word label over each dot in the scatter plot
for i in range(0, len(words)):
    ax.annotate(words[i], (bag2d[i, col1], bag2d[i, col2]))


plt.show()
<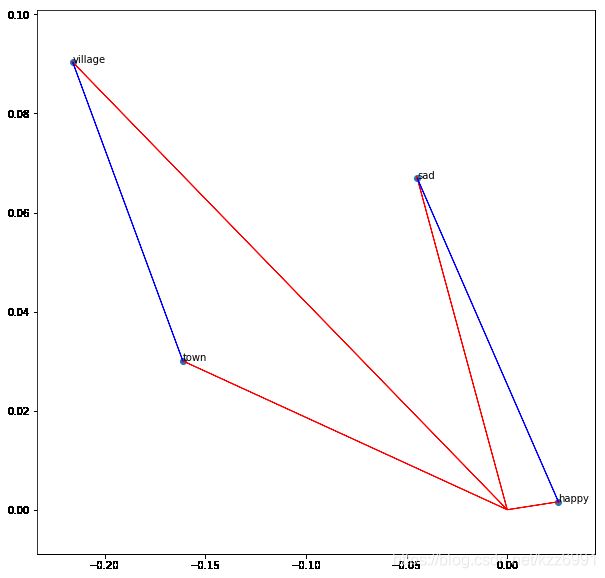 src="/pics/NLP/Vector6.png">
可以计算对应向量的范数
print(np.linalg.norm(vec('town'))) # Print the norm of the word town
print(np.linalg.norm(vec('sad'))) # Print the norm of the word sad
6.3.1. 预测首都
与前文所述方法相同
通过向量可以从Madrid向可能以Madrid为首都的国家方向移动
capital = vec('France') - vec('Paris')
country = vec('Madrid') + capital

print(country[0:5]) # Print the first 5 values of the vector
不过向量结果和spain并不相同
diff = country - vec('Spain')
print(diff[0:10])
实际上我们应当查找附近的单词,建立一个findword的方法
# Create a dataframe out of the dictionary embedding. This facilitate the algebraic operations
keys = word_embeddings.keys()
data = []
for key in keys:
    data.append(word_embeddings[key])

embedding = pd.DataFrame(data=data, index=keys)
# Define a function to find the closest word to a vector:
def find_closest_word(v, k = 1):
    # Calculate the vector difference from each word to the input vector
    diff = embedding.values - v
    # Get the norm of each difference vector.
    # It means the squared euclidean distance from each word to the input vector
    delta = np.sum(diff * diff, axis=1)
    # Find the index of the minimun distance in the array
    i = np.argmin(delta)
    # Return the row name for this item
    return embedding.iloc[i].name

# Print some rows of the embedding as a Dataframe
embedding.head(10)
可以找到目标国家Spain
find_closest_word(country)

'Spain'
其他国家同理
6.3.2. 将句子表达为向量
一整个句子可以表示为单词向量的求和,如
doc = "Spain petroleum city king"
vdoc = [vec(x) for x in doc.split(" ")]
doc2vec = np.sum(vdoc, axis = 0)
doc2vec
7. PCA 主成分分析
高维向量很难直观的观察,可以通过PCA将其降维成如二维向量,以便观测相似性。
7.1. 特征值和特征向量
Eignvector(特征向量) Uncorrelated features for your data 数据的不相关特征
Eignvalue(特征值) the amount of information retained by each feature 每个特性保留的信息量
7.2. 获得一组不相干特征
- 归一化数据
x i = x i − μ x i σ x i x_i=\frac{x_i-\mu_{x_i}}{\sigma_{x_i}} xi=σxixi−μxi
-
获得协方差矩阵
-
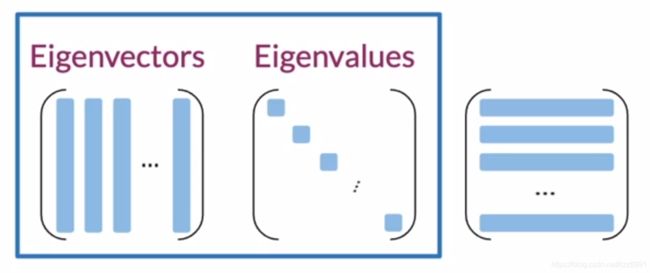
SVD(singular value decomposition 奇异值分解)
< src = “/pics/NLP/Vector7.png”>
获得三个矩阵
第一个矩阵的列为特征向量,第二个矩阵的对角线元素为特征值,
第三个矩阵好可怜
- 将数据投影到新的特征组合
设特征向量矩阵为U,特征值矩阵为S
- 将嵌入词矩阵与U进行点乘
X ′ = X U [ : , 0 : n ] X'=XU[:,0:n] X′=XU[:,0:n]
n是目标维数。此处可以取2.
- 获得新向量空间中的变量权重百分比
Σ i = 0 1 S i i Σ j = 0 d S j j \frac{\Sigma_{i=0}^1S_{ii}}{\Sigma_{j=0}^dS_{jj}} Σj=0dSjjΣi=01Sii
7.3. PCA的另一种解释
7.3.1. 依然是引入必要的库
import numpy as np                         # Linear algebra library
import matplotlib.pyplot as plt            # library for visualization
from sklearn.decomposition import PCA      # PCA library
import pandas as pd                        # Data frame library
import math                                # Library for math functions
import random                              # Library for pseudo random numbers
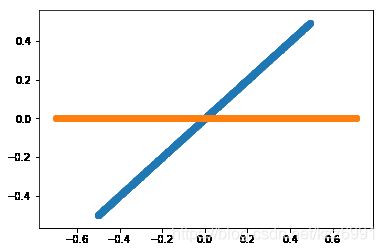
首先考虑一对随机变量x,y,若y=nx,则y和x是完全相关的。
n = 1  # The amount of the correlation
x = np.random.uniform(1,2,1000) # Generate 1000 samples from a uniform random variable
y = x.copy() * n # Make y = n * x

# PCA works better if the data is centered
x = x - np.mean(x) # Center x. Remove its mean
y = y - np.mean(y) # Center y. Remove its mean

data = pd.DataFrame({'x': x, 'y': y}) # Create a data frame with x and y
plt.scatter(data.x, data.y) # Plot the original correlated data in blue

pca = PCA(n_components=2) # Instantiate a PCA. Choose to get 2 output variables

# Create the transformation model for this data. Internally, it gets the rotation
# matrix and the explained variance
pcaTr = pca.fit(data)

rotatedData = pcaTr.transform(data) # Transform the data base on the rotation matrix of pcaTr
# # Create a data frame with the new variables. We call these new variables PC1 and PC2
dataPCA = pd.DataFrame(data = rotatedData, columns = ['PC1', 'PC2'])

# Plot the transformed data in orange
plt.scatter(dataPCA.PC1, dataPCA.PC2)
plt.show()
< src = “/pics/NLP/Vector8.png”>
PCA结果是一条横线
7.3.2. pcaTr变换模型
7.3.2.1. 旋转矩阵
PCA模型由旋转矩阵及相关explained的方程组成。
- pcaTr.components_ 有旋转矩阵
- pcaTr.explained_variance_ 有每个主成分的 explained variance
print('Eigenvectors or principal component: First row must be in the direction of [1, n]')
print(pcaTr.components_)

print()
print('Eigenvalues or explained variance')
print(pcaTr.explained_variance_)

Eigenvectors or principal component: First row must be in the direction of [1, n]
[[-0.70710678 -0.70710678]
 [-0.70710678  0.70710678]]

Eigenvalues or explained variance
[1.59534053e-01 1.29660514e-32]
7.3.2.2. 相关正则随机变量
使用由两个具有不同方差的随机变量组成的数据集。
获得方法
创建两个独立的正太随机变量,然后用旋转矩阵将它们组合起来,新的结果变量将是原随机变量的线性组合,从而相互关联。
import matplotlib.lines as mlines
import matplotlib.transforms as mtransforms

random.seed(100)

std1 = 1     # The desired standard deviation of our first random variable
std2 = 0.333 # The desired standard deviation of our second random variable

x = np.random.normal(0, std1, 1000) # Get 1000 samples from x ~ N(0, std1)
y = np.random.normal(0, std2, 1000)  # Get 1000 samples from y ~ N(0, std2)
#y = y + np.random.normal(0,1,1000)*noiseLevel * np.sin(0.78)

# PCA works better if the data is centered
x = x - np.mean(x) # Center x
y = y - np.mean(y) # Center y

#Define a pair of dependent variables with a desired amount of covariance
n = 1 # Magnitude of covariance.
angle = np.arctan(1 / n) # Convert the covariance to and angle
print('angle: ',  angle * 180 / math.pi)

# Create a rotation matrix using the given angle
rotationMatrix = np.array([[np.cos(angle), np.sin(angle)],
                 [-np.sin(angle), np.cos(angle)]])


print('rotationMatrix')
print(rotationMatrix)

xy = np.concatenate(([x] , [y]), axis=0).T # Create a matrix with columns x and y

# Transform the data using the rotation matrix. It correlates the two variables
data = np.dot(xy, rotationMatrix) # Return a nD array

# Print the rotated data
plt.scatter(data[:,0], data[:,1])
plt.show()

angle:  45.0
rotationMatrix
[[ 0.70710678  0.70710678]
 [-0.70710678  0.70710678]]
将原始数据也画出来
plt.scatter(data[:,0], data[:,1]) # Print the original data in blue

# Apply PCA. In theory, the Eigenvector matrix must be the
# inverse of the original rotationMatrix.
pca = PCA(n_components=2)  # Instantiate a PCA. Choose to get 2 output variables

# Create the transformation model for this data. Internally it gets the rotation
# matrix and the explained variance
pcaTr = pca.fit(data)

# Create an array with the transformed data
dataPCA = pcaTr.transform(data)

print('Eigenvectors or principal component: First row must be in the direction of [1, n]')
print(pcaTr.components_)

print()
print('Eigenvalues or explained variance')
print(pcaTr.explained_variance_)

# Print the rotated data
plt.scatter(dataPCA[:,0], dataPCA[:,1])

# Plot the first component axe. Use the explained variance to scale the vector
plt.plot([0, rotationMatrix[0][0] * std1 * 3], [0, rotationMatrix[0][1] * std1 * 3], 'k-', color='red')
# Plot the second component axe. Use the explained variance to scale the vector
plt.plot([0, rotationMatrix[1][0] * std2 * 3], [0, rotationMatrix[1][1] * std2 * 3], 'k-', color='green')

plt.show()
Eigenvectors or principal component: First row must be in the direction of [1, n]
[[-0.70825968 -0.705952  ]
 [ 0.705952   -0.70825968]]

Eigenvalues or explained variance
[1.02258823 0.11290988]
< src="/pics/NLP/Vector9.png">
其意义为:用PCA变换找出用于创建相关变量(蓝色)的旋转矩阵,使用PCA模型变换我们的数据,将这些变量作为我们的原始不相干变量。
8. 附:最简单的Numpy与线性代数
8.1. numpy array 与 list的区别
- 数据类型
import numpy as np  # The swiss knife of the data scientist.
alist = [1, 2, 3, 4, 5]   # Define a python list. It looks like an np array
narray = np.array([1, 2, 3, 4]) # Define a numpy array
print(alist)
print(narray)

print(type(alist))
print(type(narray))
结果为
[1, 2, 3, 4, 5]
[1 2 3 4]
<class 'list'>
<class 'numpy.ndarray'>
8.2. 运算
8.2.1. 加法
print(narray + narray)
print(alist + alist)

[2 4 6 8]
[1, 2, 3, 4, 5, 1, 2, 3, 4, 5]
8.2.2. 乘法
print(narray * 3)
print(alist * 3)

[ 3  6  9 12]
[1, 2, 3, 4, 5, 1, 2, 3, 4, 5, 1, 2, 3, 4, 5]
8.3. 矩阵
npmatrix1 = np.array([narray, narray, narray]) # Matrix initialized with NumPy arrays
npmatrix2 = np.array([alist, alist, alist]) # Matrix initialized with lists
npmatrix3 = np.array([narray, [1, 1, 1, 1], narray]) # Matrix initialized with both types

print(npmatrix1)
print(npmatrix2)
print(npmatrix3)
矩阵每行应有相同数量的元素,不然可能出现非预期结果
badmatrix = np.array([[1, 2], [3, 4], [5, 6, 7]]) # Define a matrix. Note the third row contains 3 elements
print(badmatrix) # Print the malformed matrix
print(badmatrix * 2) # It is supposed to scale the whole matrix
[list([1, 2]) list([3, 4]) list([5, 6, 7])]
[list([1, 2, 1, 2]) list([3, 4, 3, 4]) list([5, 6, 7, 5, 6, 7])]
8.3.1. 矩阵的运算
okmatrix = np.array([[1, 2], [3, 4]])
# Scale by 2 and translate 1 unit the matrix
result = okmatrix * 2 + 1 # For each element in the matrix, multiply by 2 and add 1
print(result)
[[3 5]
 [7 9]]
# Add two sum compatible matrices
result1 = okmatrix + okmatrix
print(result1)

# Subtract two sum compatible matrices. This is called the difference vector
result2 = okmatrix - okmatrix
print(result2)
[[2 4]
 [6 8]]
[[0 0]
 [0 0]]
乘法默认是元素相乘
result = okmatrix * okmatrix # Multiply each element by itself
print(result)
[[ 1  4]
 [ 9 16]]
8.3.2. 矩阵的转置
matrix3x2 = np.array([[1, 2], [3, 4], [5, 6]]) # Define a 3x2 matrix
print('Original matrix 3 x 2')
print(matrix3x2)
print('Transposed matrix 2 x 3')
print(matrix3x2.T)
Original matrix 3 x 2
[[1 2]
 [3 4]
 [5 6]]
Transposed matrix 2 x 3
[[1 3 5]
 [2 4 6]]
但是这对1D array无效
nparray = np.array([1, 2, 3, 4]) # Define an array
print('Original array')
print(nparray)
print('Transposed array')
print(nparray.T)
Original array
[1 2 3 4]
Transposed array
[1 2 3 4]
除非操作改为
nparray = np.array([[1, 2, 3, 4]]) # Define a 1 x 4 matrix. Note the 2 level of square brackets
print('Original array')
print(nparray)
print('Transposed array')
print(nparray.T)

Original array
[[1 2 3 4]]
Transposed array
[[1]
 [2]
 [3]
 [4]]
8.3.3. 矩阵的范数
2范数的定义为
n o r m ( a ⃗ ) = ∣ ∣ a ⃗ ∣ ∣ = Σ i = 1 n a I 2 norm(\vec a)=||\vec a||=\sqrt{\Sigma_{i=1}^na_I^2} norm(a)=∣∣a∣∣=Σi=1naI2
如果无axis参数则计算矩阵的范数
nparray1 = np.array([1, 2, 3, 4]) # Define an array
norm1 = np.linalg.norm(nparray1)

nparray2 = np.array([[1, 2], [3, 4]]) # Define a 2 x 2 matrix. Note the 2 level of square brackets
norm2 = np.linalg.norm(nparray2)

print(norm1)
print(norm2)
如果有参数axis
axis=0 为行
axis=1 为列
nparray2 = np.array([[1, 1], [2, 2], [3, 3]]) # Define a 3 x 2 matrix.

normByCols = np.linalg.norm(nparray2, axis=0) # Get the norm for each column. Returns 2 elements
normByRows = np.linalg.norm(nparray2, axis=1) # get the norm for each row. Returns 3 elements

print(normByCols)
print(normByRows)

[3.74165739 3.74165739]
[1.41421356 2.82842712 4.24264069]
8.3.4. 点乘
定义为
a ⃗ ⋅ b ⃗ = Σ i = 1 n a i b i \vec a\cdot\vec b = \Sigma_{i=1}^n a_ib_i a⋅b=Σi=1naibi
nparray1 = np.array([0, 1, 2, 3]) # Define an array
nparray2 = np.array([4, 5, 6, 7]) # Define an array

flavor1 = np.dot(nparray1, nparray2) # Recommended way
print(flavor1)

flavor2 = np.sum(nparray1 * nparray2) # Ok way
print(flavor2)

flavor3 = nparray1 @ nparray2         # Geeks way
print(flavor3)

# As you never should do:             # Noobs way
flavor4 = 0
for a, b in zip(nparray1, nparray2):
    flavor4 += a * b

print(flavor4)
8.3.5. 按行或列求和
axis=0 为行
axis=1 为列
nparray2 = np.array([[1, -1], [2, -2], [3, -3]]) # Define a 3 x 2 matrix.

sumByCols = np.sum(nparray2, axis=0) # Get the sum for each column. Returns 2 elements
sumByRows = np.sum(nparray2, axis=1) # get the sum for each row. Returns 3 elements

print('Sum by columns: ')
print(sumByCols)
print('Sum by rows:')
print(sumByRows)
8.3.6. 按行或列求平均
axis=0 为行
axis=1 为列
nparray2 = np.array([[1, -1], [2, -2], [3, -3]]) # Define a 3 x 2 matrix. Chosen to be a matrix with 0 mean

mean = np.mean(nparray2) # Get the mean for the whole matrix
meanByCols = np.mean(nparray2, axis=0) # Get the mean for each column. Returns 2 elements
meanByRows = np.mean(nparray2, axis=1) # get the mean for each row. Returns 3 elements

print('Matrix mean: ')
print(mean)
print('Mean by columns: ')
print(meanByCols)
print('Mean by rows:')
print(meanByRows)
8.3.7. 按行中心化矩阵
nparray2 = np.array([[1, 1], [2, 2], [3, 3]]) # Define a 3 x 2 matrix.

nparrayCentered = nparray2 - np.mean(nparray2, axis=0) # Remove the mean for each column

print('Original matrix')
print(nparray2)
print('Centered by columns matrix')
print(nparrayCentered)

print('New mean by column')
print(nparrayCentered.mean(axis=0))

Original matrix
[[1 1]
 [2 2]
 [3 3]]
Centered by columns matrix
[[-1. -1.]
 [ 0.  0.]
 [ 1.  1.]]
New mean by column
[0. 0.]
