Time series Analysis with R
原文例子是来自:
<<时间序列分析及应用>>
<>
<>
<>
1. examples
1.1 洛杉矶年降水
install.packages("TSA")
library(TSA)
win.graph(width = 4.875, height = 2.5, pointsize = 8) #产生一个win界面
data(larain)
larain
plot(larain, ylab = 'Inches', xlab = 'Year', type = 'o')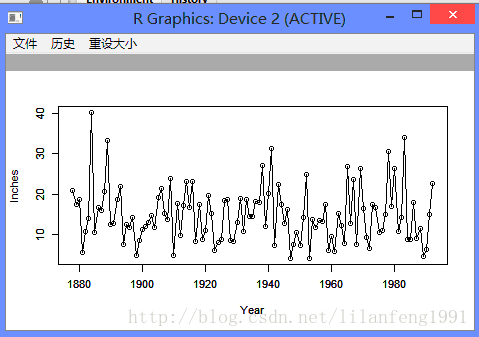
win.graph(width = 3, height = 3, pointsize = 8)
plot(y = larain, x = zlag(larain), ylab = 'Inches', xlab = 'Previous Year Inches')
1.2 化工过程
win.graph(width = 4.875, height = 2.5, pointsize = 8)
data(color)
plot(color, ylab = 'Color Property', xlab = 'Batch', type = 'o')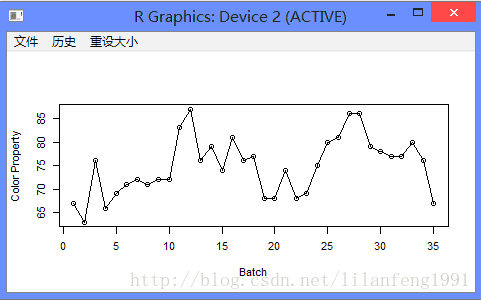
win.graph(width = 3, height = 3, pointsize = 8)
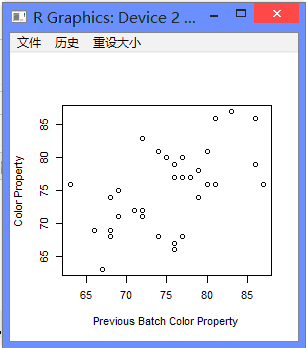
plot(y = color, x = zlag(color), ylab = 'Color Property', xlab = 'Previous Batch Color Property') #zlag函数将对象后移n位
1.3 加拿大野兔年度丰度
win.graph(width = 4.875, height = 2.5, pointsize = 8)
data(hare)
plot(hare, ylab = 'Abundance', xlab = 'Year', type = 'o')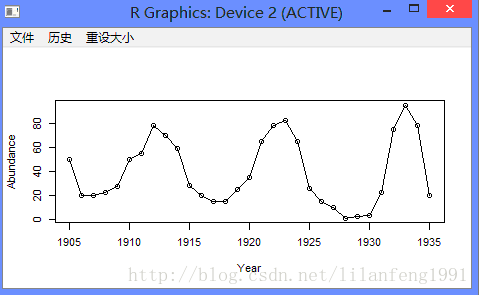
1.4 建模策略
主要步骤:
(1)模型识别
(2)模型拟合
(3)模型诊断
2. 基本概念
2.1 时间序列与随机过程
时间序列
随机过程
2.2 均值、方差和协方差
自协方差函数
自相关函数
随机游动
滑动平均
平稳性
白噪声
随机余弦波
3. 趋势
3.1 确定性趋势与随机趋势
随机趋势:对完全一样的过程进行多次模拟,可能展现出完全不同的”趋势“,即为随机趋势。
确定趋势:在一事实上的时间周期内,可以预测某一过程的发生情况的趋势,即为确定趋势。
3.2 常数均值的估计
3.3 回归方法
时间的线性趋势
时间的二次趋势
周期性或季节性趋势
余弦趋势
#季节趋势
data(tempdub)
head(tempdub)
month. = season(tempdub)
head(month.)
model2 = lm(tempdub ~ month. - 1) # -1删除intercept term
summary(model2)

model3 = lm(tempdub ~ month.)
summary(model3)
#余弦趋势
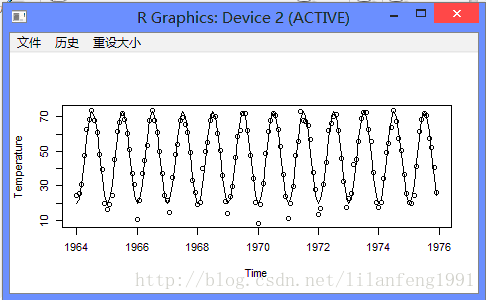
har. = harmonic(tempdub, 1)
model4 = lm(tempdub ~ har.)
summary(model4)

win.graph(width = 4.875, height = 2.5, pointsize = 8)
plot(ts(fitted(model4), freq = 12, start = c(1964, 1)), ylab = 'Temperature', type = 'l', ylim = range(c(fitted(model4), tempdub)))
points(tempdub)
3.4 回归估计的可靠性和有效性
最小二乘估计量
最佳线性无偏估计量(BLUE)
广义最小二乘估计量(GLS)
3.5 回归结果的解释
残差的标准差
决定系数R^2 : 观测序列与估计的趋势之间的样本相关系数的平方,也表示序列的变化被估计的趋势所解释的部分。
3.6 残差分析
无法观测的随机项{Xt}可以通过残差来估计或预测
plot(y = rstudent(model3), x = as.vector(time(tempdub)),
     xlab = 'Time', ylab = 'Standardized Residuals', type = 'o')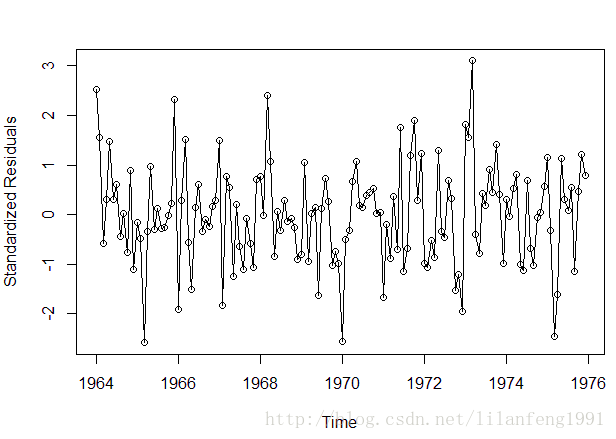
plot(y = rstudent(model3), x = as.vector(fitted(model3)), xlab = 'Fitted Trend Values',
     ylab = 'Standarized Residuals', type = 'n')
points(y = rstudent(model3), x = as.vector(fitted(model3)), pch = as.vector(season(tempdub)))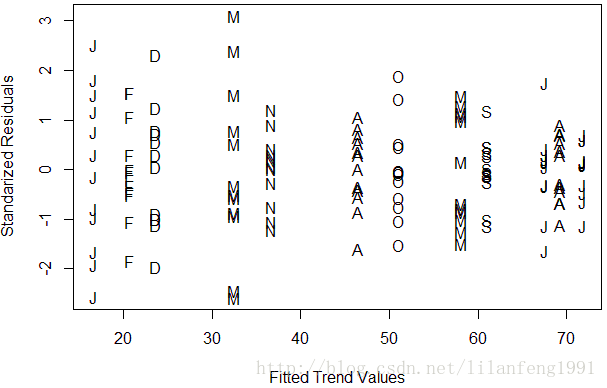
hist(rstudent(model3), xlab = 'Standarized Residual')

win.graph(width = 2.5, height = 2.5, pointsize = 8)
qqnorm(rstudent(model3))
QQ图:显示了数据的贫僧数和根据正态分布计算的理论分位数;对于正态分布数据,QQ图看起来近似于一条直线。
Shapiro-Wilk检验,本质是计算残差与其相应的正态分位数之间的相关系数,相关系数越小,就越有理由否定正态性。
样本自相关函数
#季节均值模型残差的样本自相关系数
win.graph(width = 4.875, height = 3, pointsize = 8)
acf(rstudent(model3))

4. 平稳时间序列模型
4.1 一般线性过程
一般线性过程{Yt}可表示成现在和过去白噪声变量的加权线性组合:
![]()
4.2 滑动平均过程
当有限个系数不为零的时候,得到所谓的滑动平均过程
q阶滑动平均过程(MA(q)): 过程大于1阶滞后时,不存在自相关
![]()
一阶滑动平均过程:不存在自相关
二阶滑动平均过程:
一般MA(q)过程:
4.3 自回归过程
自回归过程是用自身做回归变量
p阶自回归过程{Yt}满足方程:
![]()
一阶自回归过程:
![]()
AR(1)模型的二阶滞后也具有强正自相关
AR(1)过程的平稳性:
![]() 通常称为AR(1)过程的平稳条件
通常称为AR(1)过程的平稳条件
二阶自回归过程:
AR(2)过程的平稳性:
AR(2)过程的自相关函数:
Yule-Walker方程
一般自回归过程:
4.4 自回归滑动平均混合模型
{Yt}称为自回归滑动平均混合过程,阶数分别为p和q
![]()
4.5 可逆性
特征多项式
eg:
win.graph(width = 4, height = 3, pointsize = 8)
data(ma2.s)
plot(ma2.s, ylab = expression(Y[t-1]), type = 'o')  # Y[t-1]表示下标为t-1的Y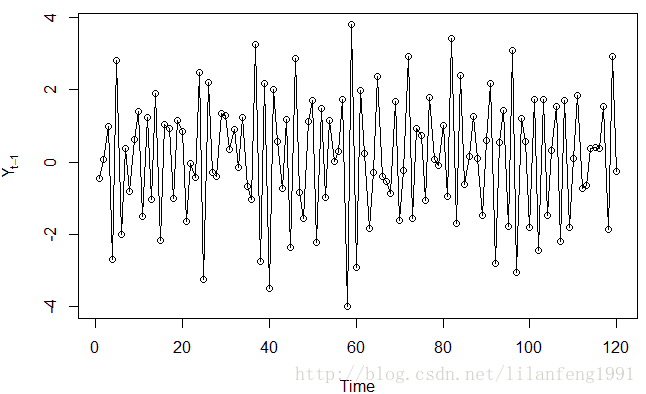
5. 非平稳时间序列模型
具有时变均值的任何时间序列都是非平稳的,形如:
![]()
5.1 通过差分平稳化
一阶差分
二阶差分
plot(diff(log(oil.price)), main = '石油价格序列取对数后的差分时序图', ylab = 'Change in Log(Price)', type = 'l')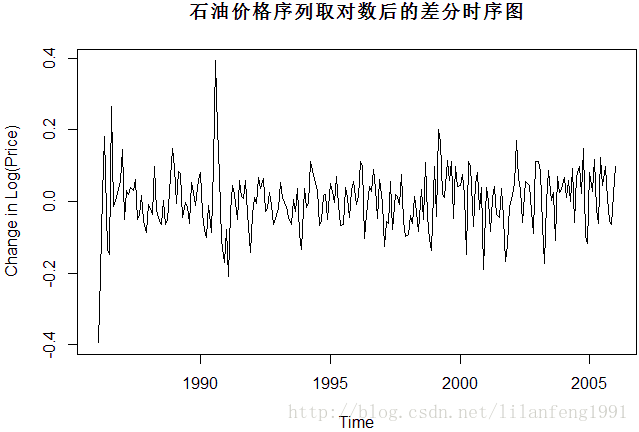
5.2 ARIMA模型
若一个时间序列{Yt}的d次差分![]() 是一个平衡的ARMA过程,则称{Yt}为自回归滑动平均求和模型
是一个平衡的ARMA过程,则称{Yt}为自回归滑动平均求和模型
若Wt服从ARMA(p,q)模型,我们称{Yt}是ARIMA(p,d,q)过程
IMA(1,1)模型:IMA(2,2)模型: ![]() 即
即 ![]()
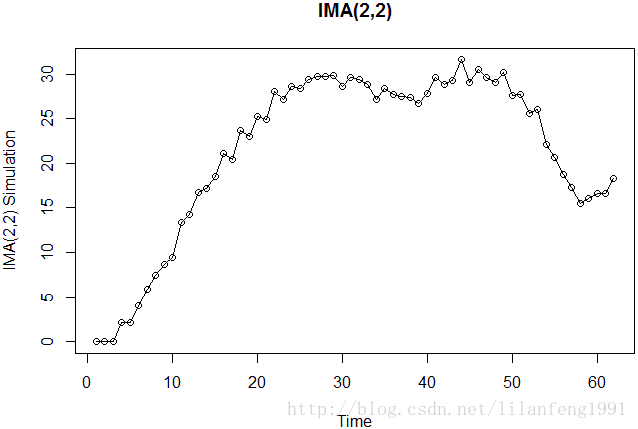
data(ima22.s)
plot(ima22.s, main = 'IMA(2,2)',ylab = 'IMA(2,2) Simulation', type = 'o')
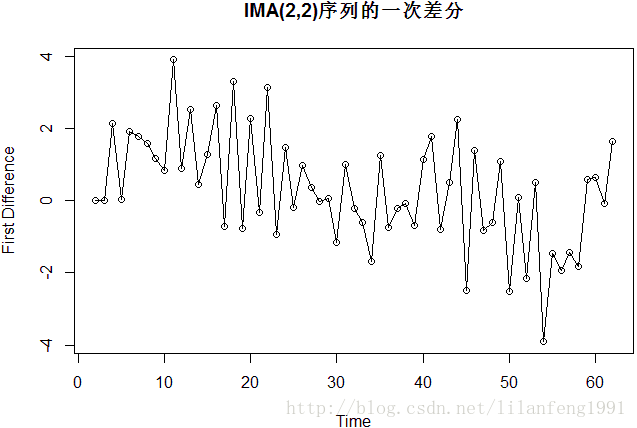
plot(diff(ima22.s), main = 'IMA(2,2)序列的一次差分', ylab = 'First Difference', type = 'o')
plot(diff(ima22.s, main = 'IMA(2,2)序列的二次差分', difference = 2), ylab = 'Differenced Twice', type ='o')
ARI(1,1)模型:![]()
5.4 其他变换
百分比变动和对数
幂变换:只有取正值的数据才能使用幂变换
Box-Cox变换
6.模型识别
6.1 样本自相关函数的性质
6.2 偏自相关函数和扩展的自相关函数
偏自相关函数被定义为预测误差之间的相关系数
样本偏自相关函数(PACF)
样本ACF和PACF为识别纯AR(p)或MA(q)模型提供了有效的工具,但对混合 ARMA模型来说,其理论ACF和PACF有着无限多的非零值,使得根据样本ACF和PACF来识别模型非常困难。
ACF指自动关系性,ACF即Auto-CorrelationFunction的简称. 比方说,股票价格今天的价格跟昨天的价格有关系,明天的价格会跟今天的或者昨天的价格有关系。它们之间的关系性便用ACF来衡量。
PACF被称作不完全自动关系性。自动关系性ACF中存在着线性关系性和非线性关系性。不完全自动关系性就是把线性关系性从自动关系性中消除。如果在线性关系性被去除以后,两个时间点之间的关系性也就是不完全关系性。当PACF近似于0,这表明两个时间点之间的关系性是完全由线性关系性所造成的。如果不完全关系性在两个时间点之间不近似于0,这表明线性模型是不能够表达这两个时间点之间的关系。
6.3 非平稳性
过度差分
Dickey-Fuller单位根检验
ARMA模型ACF和PACF的一般特征
| AR(p) | MA(q) | ARMA(p,q) , p >0, q>0 | |
| ACF | 拖尾 | 滞后q阶后截尾 | 拖尾 |
| PACF | 滞后p阶后截尾 | 拖尾 | 拖尾 |
7. 参数估计
7.1 矩估计
通过令样本矩等于相应的理论矩,并求解所得方程以求得任意未知参数的估计。
滑动平均模型
混合模型
噪声方差估计
7.2 最小二乘估计
自回归模型
滑动平均模型
混合模型
7.3 极大似然与无条件最小二乘
极大似然估计
对数似然函数
无条件最小二乘
7.4 估计的性质
8. 模型诊断
8.1 残差分析
8.2 过度拟合和参数冗余
9. 预测
10. 季节模型
10.1 季节ARIMA模型
16.R语言时间序列中文教程实例
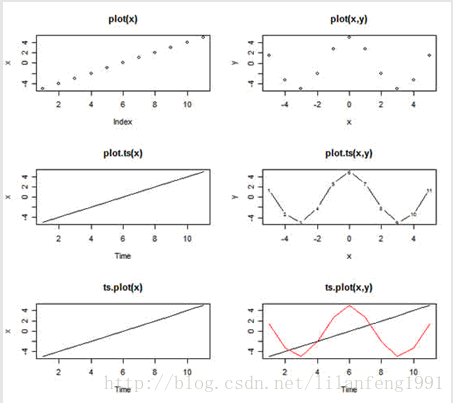
(1)plot、plot.ts、ts.plot
x = -5:5                  # sequence of integers from -5 to 5
y = 5*cos(x)              # guess
par(mfrow=c(3,2))         # multifigure setup: 3 rows, 2 cols
#---  plot:
plot(x, main="plot(x)")   # 如果数据是时间序列对象,使用plot()命令就足够了
plot(x, y, main="plot(x,y)")
#---  plot.ts:   #如果数据是平常序列,使用plot.ts()也可以做时间绘图
plot.ts(x, main="plot.ts(x)")
plot.ts(x, y, main="plot.ts(x,y)")
#---  ts.plot:
ts.plot(x, main="ts.plot(x)")
ts.plot(ts(x), ts(y), col=1:2, main="ts.plot(x,y)")  # note- x and y are ts objects
(2)正态性检验、lag.plot、stl结构拆分
dljj = diff(log(jj)) #log及差分处理#正态性检验
shapiro.test(dljj) # test for normality 测试结果的正态分布的性质
par(mfrow=c(2,1)) # set up the graphics 设置为两图的输出
hist(dljj, prob=TRUE, 12) # histogram柱形分布图
lines(density(dljj)) # smooth it - ?density for details柱形分布图的曲线
qqnorm(dljj) # normal Q-Q plot QQ图
qqline(dljj) # add a line 在 QQ图上加直线
延迟图表,也就是lag.plot
lag.plot(dljj, 9, do.lines=FALSE) #do.lines是否画线
#ACF与PACF
par(mfrow=c(2,1)) # The power of accurate observation is commonly called cynicism
# by those whohave not got it. - George Bernard Shaw
acf(dljj, 20) # ACF to lag 20 - no graph shown... keep reading
pacf(dljj, 20) # PACF to lag 20 - no graph shown... keep reading
# !!NOTE!! acf2 onthe line below is NOT available in R... details follow the graph below
acf2(dljj) # this is what you'll see below
#stl结构拆分
Log(jj)=趋势+季节+误差
log(jj) =trend + season + error
结构拆析的R命令中stl(), 下面语句中stl命令中输入的是lag变型后的jj数据。
#生成模型
  Q = factor(rep(1:4,21))     # make (Q)uarter factors [that's repeat 1,2,3,4, 21 times]
trend = time(jj)-1970   # not necessary to "center" time, but the results look nicer
reg = lm(log(jj)~0+trend+Q, na.action=NULL)  # run the regression without an intercept
#-- the na.action statement is to retain time series attributes
summary(reg)
     Call:
lm(formula = log(jj) ~ 0 + trend + Q, na.action = NULL)

Residuals:
     Min       1Q   Median       3Q      Max
-0.29318 -0.09062 -0.01180  0.08460  0.27644

Coefficients:
      Estimate Std. Error t value Pr(>|t|)
trend 0.167172   0.002259   74.00   <2e-16 ***
Q1    1.052793   0.027359   38.48   <2e-16 ***
Q2    1.080916   0.027365   39.50   <2e-16 ***
Q3    1.151024   0.027383   42.03   <2e-16 ***
Q4    0.882266   0.027412   32.19   <2e-16 ***
---
Signif. codes:  0 '***' 0.001 '**' 0.01 '*' 0.05 '.' 0.1 ' ' 1

Residual standard error: 0.1254 on 79 degrees of freedom
Multiple R-squared: 0.9935,     Adjusted R-squared: 0.9931
F-statistic:  2407 on 5 and 79 DF,  p-value: < 2.2e-16
##上面语句第一行用来生成所需要的Q函数。第二行用来生成线性回归模型中的时间输入,然后存储于叫做trend的数列中。第三行语句是用lm()命令来建立线性模型。在R语言中,~用来分隔进行预测的变量和被预测的变量。
#接下来要进行的工作是,将预测的数据和实观察的数据进行比较
plot(log(jj),type="o") # the data in black with little dots
lines(fitted(reg),col=2) # the fitted values in bloody red - or use lines(reg$fitted, col=2)
#用误差的绘图来确定误差的变化是否比较小范围之内 par(mfrow=c(2,1))
plot(resid(reg)) # residuals - reg$resid is same as resid(reg)
acf(resid(reg),20) # acf of the resids
ts.intersect combine 数据ts.intersect()命令把mort 数据、part数据以及part经过延迟四周的数据捆绑在了一起 ded =ts.intersect(mort,part,part4=lag(part,-4), dframe=TRUE) # tie them together in a data frame
fit =lm(mort~part+part4, data=ded, na.action=NULL) # now the regression will work
summary(fit) #接下来使用summary命令输出所有估计完成的参数。
(3)ARIMA(自回归移动平均集成模型)
ARIMA模型。AR指自动回归,MA指移动平均,I指集成。
arima.sim
x1 <- arima.sim(list(order = c(1, 0, 0), ar = 0.9), n = 100)
x2 <- arima.sim(list(order = c(1, 0, 0), ar = -0.9), n = 100)
par(mfrow = c(1, 2))
plot(x1)
plot(x2)acf与pacfpar(mfcol=c(2,2))
acf(x1, 20)
acf(x2, 20)
pacf(x1, 20)
pacf(x2, 20)分析:
对数列x1来讲,ACF从lag1到lag12都高于蓝色虚线,也就是说两个时间点的距离在1到12之间它们的自动关系都是正面的。所有线性关系在x1数列中被清除了结果是Partial ACF的x1图表。在PACFx1图表上可以看到只有lag0值为1,其他的lag上的关系值都低于蓝色虚线,近似于0,也就是说在x1数列中存在的自动关系基本上是线性关系。使用线性模型可以符合x1数列的要求。
对数列x2来讲,两个时间点之间的ACF关系有负面的也有正面的,但经过去除线性关系以后所有不完全自动关系都接近于0,也就是说x2数列中的自动关系也基本上是线性的。使用线性模型符合x2数列要求。

移动平均MA模型x = arima.sim(list(order=c(0,0,1), ma=.8), n=100)
par(mfcol=c(3,1))
plot(x, main=(expression(MA(1)~~~theta==.8)))
acf(x,20)
pacf(x,20)
分析:MA1代表了数列输出的结果。最上面显示的是数列的数目,横向坐标从1到100代表有100个数据。中间的图显示的是x数列的自动关系性,在lag0上有很强的自动关系性,因为Lag0表示没时间延迟,当前数据与它有完全的关系性。所以lag0上的关系性什么都不代表。而Lag1上存在着正面的关系性,即当前数据与前一个数据的关系性是正面的。其他延迟上的自动关系性都近似于0,可以不被考虑。

# an AR2 x = arima.sim(list(order=c(2,0,0), ar=c(1,-.9)), n=100)
par(mfcol=c(3,1))
plot(x, main=('expression(AR(2)~~~phi[1]==1~~~phi[2]==-.9)'))
acf(x, 20)
pacf(x, 20)

# an ARIMA(1,1,1) x = arima.sim(list(order=c(1,1,1), ar=.9, ma=-.5), n=200)
par(mfcol=c(3,1))
plot(x, main=('expression(ARIMA(1,1,1)~~~phi==.9~~~theta==-.5)'))
acf(x, 30) # the process is not stationary, so there is no population [P]ACF ...
pacf(x, 30) # but look at the sample values to see how they differ from the examples above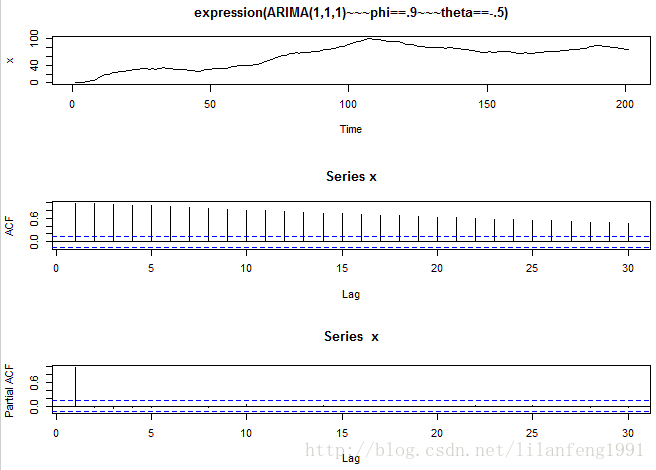
自动回归移动平均集成模型的估计分析,即ARIMA模型x = arima.sim(list(order=c(1,0,1), ar=.9, ma=-.5), n=100) # simulate some data
(x.fit = arima(x, order = c(1, 0, 1))) # fit the model and print the results
Call:
arima(x = x, order = c(1, 0, 1))
Coefficients:
ar1 ma1 intercept
0.8217 -0.5076 -0.2914
s.e. 0.1008 0.1530 0.2709
sigma^2 estimated as 1.019: log likelihood = -142.99, aic = 291.98
我们随机生成一些ARIMA模型的数据,并且假装我们不知道模型的参数,然后做估计练习。
生成ARIMA数据的命令为arima.sim(). 自动回归的参数为0.9,移动平均的参数为-0.5,估计中要假设这两个参数的设置为未知,并进行估计。计算估计值的命令为arima()。其中,x指随机生成的数据。
在下面的输出中,我们可以看到AR参数的估计值为0.8465, ma的参数估计值为-0.5021,这两个估计值与前面生成数据时设置的参数非常相似。也就是说,估计得比较精确。
对估计的模型进行检测和评估,需要执行的命令为tsdiag()
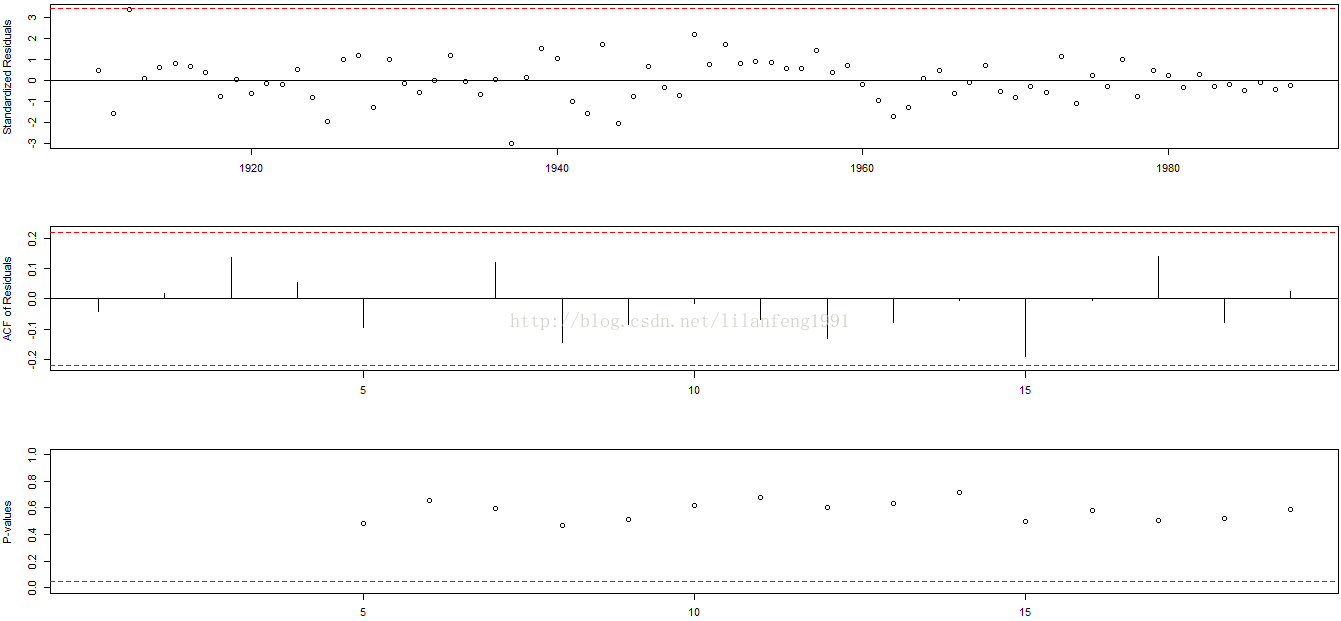
tsdiag(x.fit, gof.lag=20) # you know the routine- ?tsdiag for details
x = arima.sim(list(order=c(1,0,1), ar=.9, ma=-.5), n=100) # simulate some data
(x.fit = arima(x, order = c(1, 0, 1)))   # fit the model and print the results
tsdiag(x.fit, gof.lag=20) # you know the routine- ?tsdiag for details
分析:第一个图表代表估计模型误差的绘图。英文叫做Standardized Residuals, 上面有很多竖线在横向坐标的上下分布。如果这个估计的模型比较可信,竖线的长度是比较相似的。如果竖线的长度互相有很大出入或者根本就不同,估计模型的可信度就非常差。下面误差绘图中竖线的长度比较相似,都处在稳定范围之内,即估计的模型没产生不符合要求的误差分布。(运行的结果与书上的不大一样)可根据散点的范围波动来判断
再介绍输出的第二张绘图,标题是ACF of Residuals。ACF指数据点相互之间的关系,当然在生成这个数据时,数据点之间互相独立,并不存在任何关系。所以在这张图上,只有位于0刻度上的竖线最高,其ACF值为1。这个0代表数据点与自己相比较, 即数据点永远和它自己有关系,这种关系数值为1。其他横向数轴上的刻度代表一个数据点于其他数据点之间的关系,这些刻度上竖线的长度几乎等于0,即这个数据点与其他数据点没明显关系。这张ACF图代表估计的模型没造成误差之间的任何关系。这是符合数据生成时每个数据都是独立的这个前提的。由此可见,这ACF图符合检测要求。
下面来介绍第三张图,也就是Ljung-Box 指标。这个指标可对每一个时间序列的延迟进行显著性的评估。这张图的横坐标代表时间序列的延迟,纵坐标代表P-value,即显著性。如果P-value十分小,就说明在其相对应的延迟点上是显著的。我们就需要抛弃所假设的模型,并且结论在所假设的模型不可信。需要注意的是,他们使用假设的模型对一个时间序列进行估计,如果P-value是显著的话,我们使用的模型就不可信,需要尝试其他新模型。具体判定技巧是,P-value点的高度越高,我们的模型越可信。

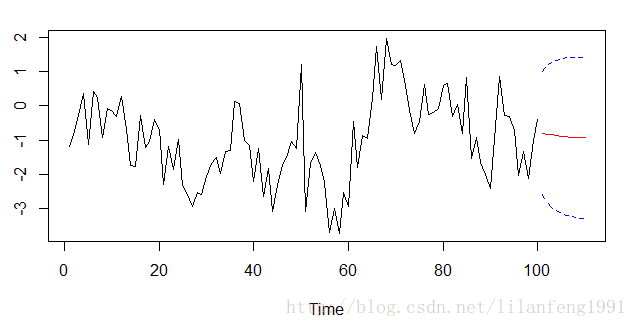
预测(predict)x = arima.sim(list(order=c(1,0,1), ar=.9, ma=-.5), n=100) # simulate some data
(x.fit = arima(x, order = c(1, 0, 1))) # fit the model and print the results
x.fore = predict(x.fit, n.ahead=10)
# plot the forecasts
U = x.fore$pred + 2*x.fore$se
L = x.fore$pred - 2*x.fore$se
minx=min(x,L)
maxx=max(x,U)
ts.plot(x,x.fore$pred,col=1:2, ylim=c(minx,maxx))
lines(U, col="blue", lty="dashed")
lines(L, col="blue", lty="dashed")
分析:预测所使用的语句是predict(). 在()中输入x.fit 和n.ahead =10 ,其中x.fit 代表前面估计出来的模型与参数,n.ahead =10 代表向前预测10个数据点。这条语句给我们生成的预测程序项目,被命名为x.fore.
在下面两条语句中,计算了两列的新数据,分别被称为U和L. U指最高界限,L指最低界限。 最高限和最低限告诉我们未来数据有很高可能性事发生在两个界限之间,超出或低于这两个界限的几率并不高。
下一步使用Min 和 Max条语句,把数据中的最大值和最小值挑选出来,为接下来的统计绘图设置图标界限。再使用TS.PLOT()语句. 把原有的数据和向前预测10个数据点的数据绘在一张图上。最后使用lines()语句,把计算的最高界限和最低界限加到绘好的图上。这两条界限的颜色为蓝色,形式也被设置为虚线的形式。
除去原有的数据外,又加上了三条曲线。最上面和最下面的曲线是虚线,是计算出的最高界限和最低界限。中间的曲线为实线,是对未来的10个数据点进行的预测。在计算最高、最低限时,我们使用了一个2的系数,也就是说,这两个界限之间的几率为95%。 在未来的10个数据点有95%的几率是出现在上限和下限之间的。而出现在两个界限之外的几率小于或等于5%。
(4)漂移参数的估计方法
u =read.table("http://www.stat.pitt.edu/stoffer/tsa2/data/globtemp2.dat")    # read the data
gtemp = ts(u[,2], start=1880, freq=1)      # yearly temp in col 2
plot(gtemp)

arima(gtemp, order=c(1,1,1))

drift = 1:length(gtemp) #生成了一个名为drift的空数列,其长度与全球温度数列的长度相同
arima(gtemp, order=c(1,1,1), xreg=drift)
Coefficients:
  ar1      ma1   drift
0.2695  -0.8180  0.0061
s.e.  0.1122   0.0624  0.0030

gtemp
生成了一个名为drift的空数列,其长度与全球温度数列的长度相同。而在第二个语句中,我们只要把drift数列作为xreg输入就可以了。从输出中,我们可以看到AR参数值为0.2695,MA参数值为-0.8180,是drift值为0.0061,即漂移产生的值. 上面提到过漂移值为+0.6,我们的估计值比提供的数值小100倍。其原因是因为我们使用的全球温度数据是经过被100整除的,所以估计的漂移值也相应地小了100倍。如果将gtemp数列输出后看一下,我们就可以明白所有温度都是被100整除过的。
(5)运用R语言研究非独立误差与线性回归
library(nlme) #load the package
trend = time(mort) #assumes mort and part are there from previous examples
fit.lm = lm(mort~trend + part)  # ols
acf(resid(fit.lm))       # check acf and pacf of the resids
pacf(resid(fit.lm))      # or use acf2(resid(fit.lm)) if you have acf2  pacf绘图是第五行命令运行的结果。在上图中,横向坐标代表的延迟,被叫做lag. 在lag1和lag2上出现了高于蓝色虚线的pacf,其他lag上超出蓝色虚线的距离并不明显可以忽略。这两个高于蓝色虚线的pacf说明这个误差数列符合AR2模型。
fit.gls = gls(mort~trend + part, correlation=corARMA(p=2), method="ML") # resids appear to be AR(2) ... now use gls() from nlme:使用gls()命令来对数据建立带有AR2误差的线性回归模型,生成结果记为fit.gls
summary(fit.gls)

(fit2.gls = arima(mort, order=c(2,0,0), xreg=cbind(trend, part)))  ##xreg=cbind(trend,part)代表用时间和空气污染物作为进行预测的变量
Coefficients:
  ar1     ar2  intercept    trend    part
0.3980  0.4135  3132.7085  -1.5449  0.1503
s.e.  0.0405  0.0404   854.6662   0.4328  0.0211
sigma^2 estimated as 28.99:  log likelihood = -1576.56,  aic = 3165.13

Box.test(resid(fit2.gls), 12, type="Ljung")   # and so on ...
#Box.test计算n独立的null假设 (6)运用R语言研究估计波动的频率
x = arima.sim(list(order=c(2,0,0), ar=c(1,-.9)), n=2^8) # some data
(u = polyroot(c(1,-1,.9)))  # x is AR(2) w/complex roots
?polyroot
Arg(u[1])/(2*pi)  # dominant frequency around .16:
par(mfcol=c(3,1))
plot.ts(x)
spec.pgram(x, spans=c(3,3), log="no")  # nonparametric spectral estimate; also see spectrum()
#对已生成的随机波动数据的频率进行估计。注意,在这里不能够使用自动回归模型作为已知条件来进行频率的计算,而是要对频率进行估计。
spec.ar(x, log="no")            # parametric spectral estimate
17. A Little Book of R for Time Series Examples
(1)数据集
##########################################
#A Little Book of R for Time Series
##########################################
?scan

##########################################
#读取时间序列数据
##########################################

####################################################
#http://robjhyndman.com/tsdldata/misc/kings.dat
#包含着从威廉一世开始的英国国王的去世年龄数据
####################################################

####################################################
#读取时间序列数据
####################################################
kings <- scan("http://robjhyndman.com/tsdldata/misc/kings.dat", skip = 3)
kings

####################################################
#将读入的数据存入到一个时间序列对象中
####################################################
kingstimeseries <- ts(kings)
kingstimeseries

####################################################
#ts可以用于指定frequency, start起始值,end结束值
####################################################


##########################################################
#一个样本数据集是从1946年1月到1959年12月的纽约每月
#出生人口数量(由牛顿最初收集)数据集可以从此链接下
#载(http://robjhyndman.com/tsdldata/data/nybirths.dat)
##########################################################
births <- scan("http://robjhyndman.com/tsdldata/data/nybirths.dat")
births
birthstimeseries <- ts(births, frequency = 12, start = c(1946, 1))
birthstimeseries


##########################################################
#http://robjhyndman.com/tsdldata/data/fancy.dat
#包含着一家位于昆士兰海滨度假圣地的纪念品商店
#从1987年1月到1987年12月的每月销售数据
##########################################################
souvenir <- scan("http://robjhyndman.com/tsdldata/data/fancy.dat")
souvenirtimeseries <- ts(souvenir, frequency = 12, start = c(1987, 1))
souvenirtimeseries


##########################################################
#plotting Time Series绘制时间序列图
##########################################################
##########################################################
#可使用R中的plot.ts()函数来画时间序列图
##########################################################
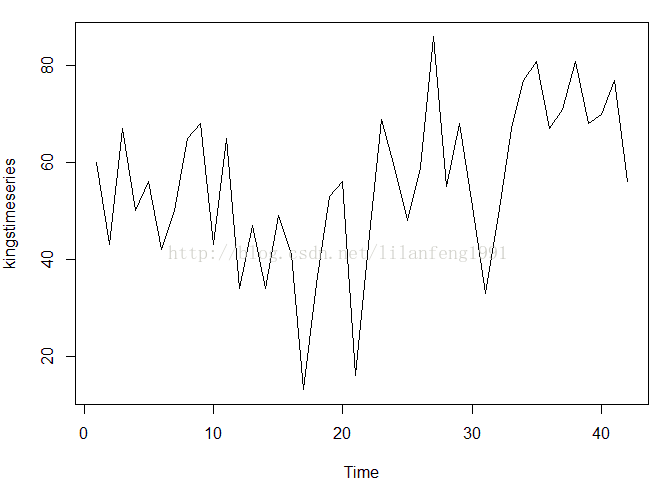
plot.ts(kingstimeseries)
##########################################################
#变化不大,可用相加模型来描述
##########################################################
##########################################################
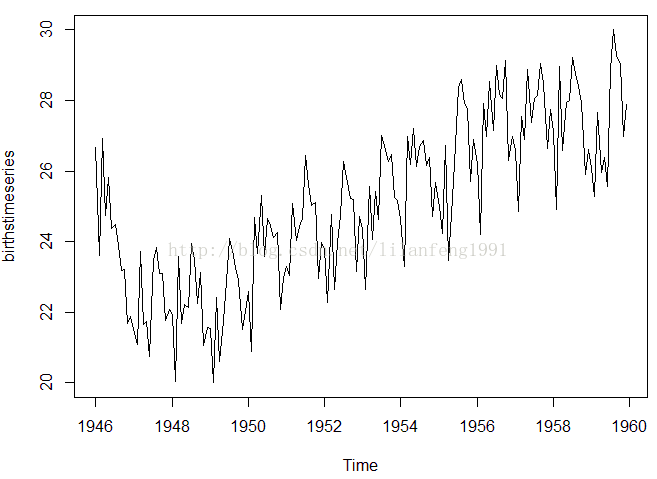
#画出一个纽约每月出生人口数量的时间序列图
##########################################################
plot.ts(birthstimeseries)
##########################################################
#这个时间序列在一定月份存在的季节性变动:在每年的夏天都
#有一个出生峰值,在冬季的时候进入波谷。同样,这样的时间
#序列也可能是一个相加模型,随着时间推移,季节性波动时大
#致稳定的而不是依赖于时间序列水平,且对着时间的变化,随
#机波动看起来也是大致稳定的。
##########################################################
##########################################################
#画出澳大利亚昆士兰州海滨度假圣地的纪念品商店从1987年1月
#到1987年12月的每月销售数据。
##########################################################
plot.ts(souvenirtimeseries)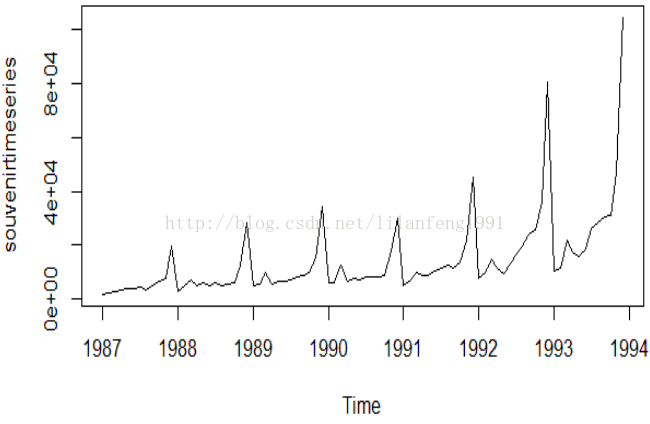
##########################################################
#在这个案例中,看上去似乎相加模型不适合描述这个时间序列,
#因为这个季节性波动和随机变动的大小是随着时间序列逐步上
#升的水平。因此,我们需要将时间序列进行转换,以便得到一
#个可以用相加模型描述的时间序列。例如,我们对原始数据取
#自然对数进行转换计算:
##########################################################
logsouvenirtimeseries <- log(souvenirtimeseries)
plot.ts(logsouvenirtimeseries)
##########################################################
#可以看到季节性波动和随机变动的大小在对数变换后的时间序列
#上,随着时间推移,季节性波动和随机波动的大小是大致恒定的,
#并且不依赖于时间序列水平。因此,这个对数变换后的时间序列
#也许可以用相加模型进行描述。
##########################################################
(2)分解时间序列
##########################################################
#分解时间序列
##########################################################
##########################################################
#分解一个时间序列意味着把它拆分成构成元件,一般序列包含
#一个趋势部分、一个不规则部分,如果是一个季节性时间序列,
#则还有一个季节性部分。
##########################################################
##########################################################
#分解非季节性数据
##########################################################
##########################################################
#一个非季节性时间序列包含一个趋势部分和一个不规则部分。
#分解时间序列即为试图把时间序列拆分成这些成分,也就是说,
#需要估计趋势的和不规则的这两个部分
#为了估计出一个非季节性时间序列的趋势部分,
#使之能够用相加模型进行描述,最常用的方法便是平滑法,
#比如计算时间序列的简单移动平均。
#在R的“TTR”包中的SMA()函数可以用
#简单的移动平均来平滑时间序列数据。
##########################################################
library(TTR)
?SMA
##########################################################
#SMA用于计算序列中的不同的MA
##########################################################
##########################################################
#使用SMA()函数去平滑时间序列数据
#通过参数"n"指定来简单移动平均的
##########################################################
##########################################################
#kingstimeseries的plot呈现出非季节性
#且由于其随机变动在整个时间段内是大致不变的
#这个序列也可被描述为一个相加模型
#故可尝试使用简单移动平均平滑来估计趋势部分
#采用跨度不3的简单移动平均平滑时间序列数据
##########################################################
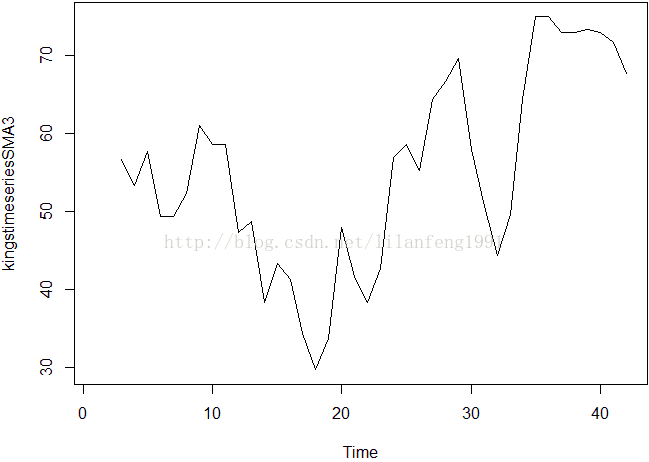
kingstimeseriesSMA3 <- SMA(kingstimeseries, n = 3)
plot.ts(kingstimeseriesSMA3)
##########################################################
#当我们使用跨度为3的简单移动平均平滑后,
#时间序列依然呈现出大量的随便波动。
#因此,为了更加准确地估计这个趋势部分,
#我们也许应该尝试下更大的跨度进行平滑。
#正确的跨度往往是在反复试错中获得的。
##########################################################
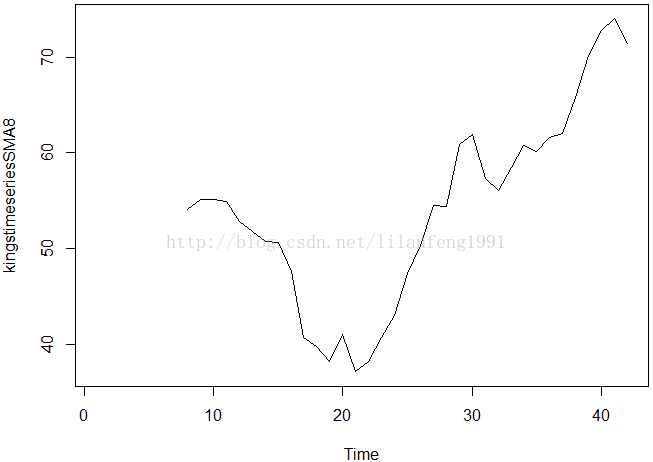
kingstimeseriesSMA8 <- SMA(kingstimeseries, n = 8)
plot.ts(kingstimeseriesSMA8)
##########################################################
#这个跨度为8的简单移动平均平滑数据的趋势部分看起来更加清晰了
#我们可以发现这个时间序列前20为国王去世年龄从最初的55周岁下
#降到38周岁,然后一直上升到第40届国王的73周岁。
##########################################################
##########################################################
#分解季节性数据
##########################################################
##########################################################
#一个季节性时间序列包含:
#一个趋势部分,一个季节性部分和一个不规则部分。
#分解时间序列就意味着要把时间序列分解称为这三个部分:
#也就是估计出这三个部分。
##########################################################
##########################################################
#对于可以使用相加模型进行描述的时间序列中的趋势部分和
#季节性部分,我们可以使用R中“decompose()”函数来估计。
#这个函数可以估计出时间序列中趋势的、季节性的和不规则
#的部分,而此时间序列须是可以用相加模型描述的。
##########################################################
##########################################################
#对于可以使用相加模型进行描述的时间序列中的趋势部分和
#季节性部分,我们可以使用R中“decompose()”函数来估计。
#这个函数可以估计出时间序列中趋势的、季节性的和不规则
#的部分,而此时间序列须是可以用相加模型描述的。
##########################################################
##########################################################
#“decompose()”这个函数返回的结果是一个列表对象,
#里面包含了估计出的季节性部分,趋势部分和不规则部分,
#他们分别对应的列表对象元素名为“seasonal”、“trend”、和“random”。
##########################################################
##########################################################
#为了估计时间序列的趋势的、季节性和不规则部分,输入代码:
##########################################################
birthstimeseriescomponents <- decompose(birthstimeseries)
birthstimeseriescomponents
##########################################################
#估计出的季节性、趋势的和不规则部分现在被存储在变量
#birthstimeseriescomponents$seasonal,
#birthstimeseriescomponents$trend 和
#birthstimeseriescomponents$random 中##########################################################
##########################################################
#可以使用“plot()”函数画出时间序列中估计的趋势的、
#季节性的和不规则的部分
##########################################################
plot(birthstimeseriescomponents)
##########################################################
#季节性因素调整
##########################################################
##########################################################
#如果这个季节性时间序列可以用相加模型来描述,
#你可以通过估计季节性部分修正时间序列,
#也可以从原始序列中去除掉估计得季节性部分。
#我们可以通过“decompose()”函数使用估计出的季节性部分进行计算。
##########################################################
##########################################################
#例如,对纽约每月出生人口数量进行季节性修正,
#我们可以用“decompose()”估计季节性部分,
#也可以把这个部分从原始时间序列中去除。
##########################################################
birthstimeseriescomponents <- decompose(birthstimeseries)
birthstimeseriesseasonallyadjusted <- birthstimeseries - birthstimeseriescomponents$seasonal
##########################################################
#可以使用“plot()”画出季节性修正时间序列,代码如下
##########################################################
plot(birthstimeseriesseasonallyadjusted)
##########################################################
#这个季节性修正后的时间序列现在仅包含趋势部分和不规则变动部分。
##########################################################(3)使用指数平滑法进行预测
##########################################################
#使用指数平滑法进行预测
##########################################################


##########################################################
#指数平滑法可以用于时间序列数据的短期预测。
##########################################################


##########################################################
#简单指数平滑法
##########################################################


##########################################################
#如果你有一个可用相加模型描述的,
#并且处于恒定水平和没有季节性变动的时间序列
#指数平滑法可以用于时间序列数据的短期预测。
##########################################################
##########################################################
#eg
# http://robjhyndman.com/tsdldata/hurst/precip1.dat
#这个文件包含了伦敦从1813年到1912年全部的每年每英尺降雨量
#(初始数据来自Hipel and McLeod, 1994)
##########################################################
rain <- scan("http://robjhyndman.com/tsdldata/hurst/precip1.dat", skip = 1)
rainseries <- ts(rain, start = c(1813))
plot.ts(rainseries)
##########################################################
#从这个图可以看出整个曲线处于大致不变的水平
#(意思便是大约保持的25英尺左右)。
#其随机变动在整个时间序列的范围内也可以认为是大致不变的,
#所以这个序列也可以大致被描述成为一个相加模型。
#因此,我们可以使用简单指数平滑法对其进行预测。
####################################################################################################################
#为了能够在R中使用简单指数平滑法进行预测,
#我们可以使用R中的“HoltWinters()”函数对预测模型进行修正。
#为了能够在指数平滑法中使用HotlWinters(),
#我们需要在HoltWinters()函数中设定参数beta=FALSE和gamma=FALSE
##########################################################
##########################################################
#HoltWinters()函数返回的是一个变量列表,包含了一些元素名。
##########################################################
rainseriesforecasts <- HoltWinters(rainseries, beta = FALSE, gamma = FALSE)
rainseriesforecasts
##########################################################
#Holt-Winters exponential smoothing without trend and without seasonal component.
#
#Call:
# HoltWinters(x = rainseries, beta = FALSE, gamma = FALSE)
#Smoothing parameters:
# alpha: 0.02412151
#beta : FALSE
#gamma: FALSE
#Coefficients:
# [,1]
#a 24.67819
##########################################################
##########################################################
#HoltWinters()的输出告诉我们alpha参数的估计值约为0.024。这个数字
#非常接近0,告诉我们预测是基于最近的和较远的一些观测值
#(尽管更多的权重在现在的观测值上)。
##########################################################
##########################################################
#我们将HoltWinters()函数的输出结果存储在
#“rainseriesforecasts”这个列表变量里。
#这个HoltWinters()产生的预测呗存储在一个元素名为“fitted”的列表变量里,
#我们可以通过以下代码获得这些值:
##########################################################
rainseriesforecasts$fitted
##########################################################
#可以再画出原始时间序列和预测的,代码如下:
##########################################################
plot(rainseriesforecasts)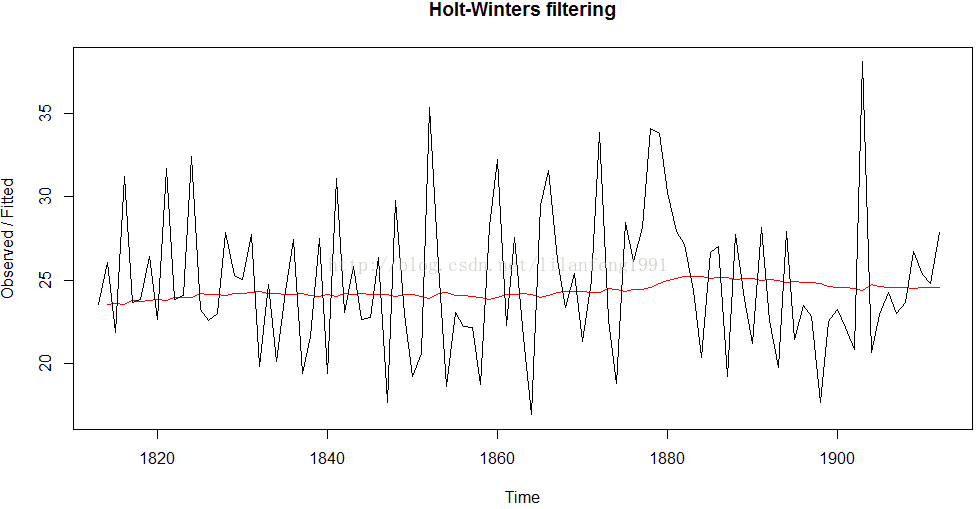
##########################################################
#这个图用黑色画出了原始时间序列图,用红色画出了预测的线条。
#在这里,预测的时间序列比原始时间序列数据平滑非常多。
##########################################################
##########################################################
#作为预测准确度的一个度量,
#我们可以计算样本内预测误差的误差平方之和,
#即原始时间序列覆盖的时期内的预测误差。
#这个误差平方法将存储在一个元素名为
#“rainseriesforecasts”(我们称之为“SSE”)的列表变量里
##########################################################
rainseriesforecasts$SSE
##########################################################
#rainseriesforecasts$SSE
#[1] 1828.855
##########################################################
##########################################################
#用时间序列的第一个值作为这个水平的初始值在简单指数平滑法
#中常见的操作。例如,在伦敦降雨量这个时间序列里,第一个值
#为1813年的23.56(英尺)。你可以在HoltWinters()函数中使
#用“l.start”参数指定其味初始值。例如,我们将预测的初始值
#水平设定为23.56,代码如下:
##########################################################
HoltWinters(rainseries, beta = FALSE, gamma = FALSE, l.start = 23.56)
##########################################################
#可以使用R中的“forecast”包中的“forecast.HoltWinters()”
#函数进行更远时间点上的预测。使用Forecast.HoltWinters()函数,
#我们首先得安装R的“forecast”包
##########################################################
install.packages("forecast")
library(forecast)
##########################################################
#当我们使用forecast.HoltWinters()函数时,
#如它的第一个参数(input),
#你可以在已使用HoltWinters()函数调整后的预测模型中忽略它。
#例如,在下雨的时间序列中,
#使用HoltWinters()做成的预测模型存储在“rainseriesforecasts”变量中。
#你可以使用forecast.HoltWinters()中的参数”h”来制定你想要做多少时间点的预测
##########################################################
##########################################################
#eg:
#要使用forecast.HoltWinters()做1814-1820年(之后8年)的下雨量预测,我们输入:
##########################################################
rainseriesforecasts2 <- forecast.HoltWinters(rainseriesforecasts, h = 8)
rainseriesforecasts2
##########################################################
#
#Point Forecast    Lo 80    Hi 80    Lo 95    Hi 95
#1913       24.67819 19.17493 30.18145 16.26169 33.09470
#1914       24.67819 19.17333 30.18305 16.25924 33.09715
#1915       24.67819 19.17173 30.18465 16.25679 33.09960
##1916       24.67819 19.17013 30.18625 16.25434 33.10204
#1917       24.67819 19.16853 30.18785 16.25190 33.10449
#1918       24.67819 19.16694 30.18945 16.24945 33.10694
#1919       24.67819 19.16534 30.19105 16.24701 33.10938
#1920       24.67819 19.16374 30.19265 16.24456 33.11182
##########################################################
##########################################################
#orecast.HoltWinters()函数给出了一年的预测,
#一个80%的预测区间和一个95%的预测区间的两个预测。
##########################################################
plot.forecast(rainseriesforecasts2)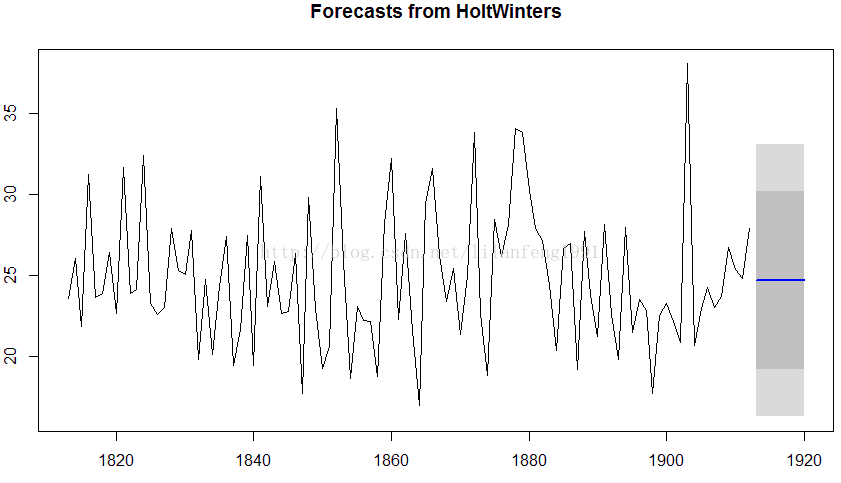
##########################################################
#这的蓝色线条是预测的1913-1920的降雨量,
#深灰色阴影区域为80%的预测区间,
#淡灰色阴影区域为95%的预测区间。
##########################################################
##########################################################
#使用forecast.HoltWinters()返回的样本内预测误差将被存储
#在一个元素名为“residuals”的列表变量中。
#如果预测模型不可再被优化,连续预测中的预测误差是不相关的。
#换句话说,如果连续预测中的误差是相关的,
#很有可能是简单指数平滑预测可以被另一种预测技术优化。
##########################################################
##########################################################
#为了验证是否如此,我们获取样本误差中1-20阶的相关图。
#我们可以通过R里的“acf()”函数计算预测误差的相关图。
#为了指定我们想要看到的最大阶数,可以使用acf()中的“lag.max”参数。
##########################################################
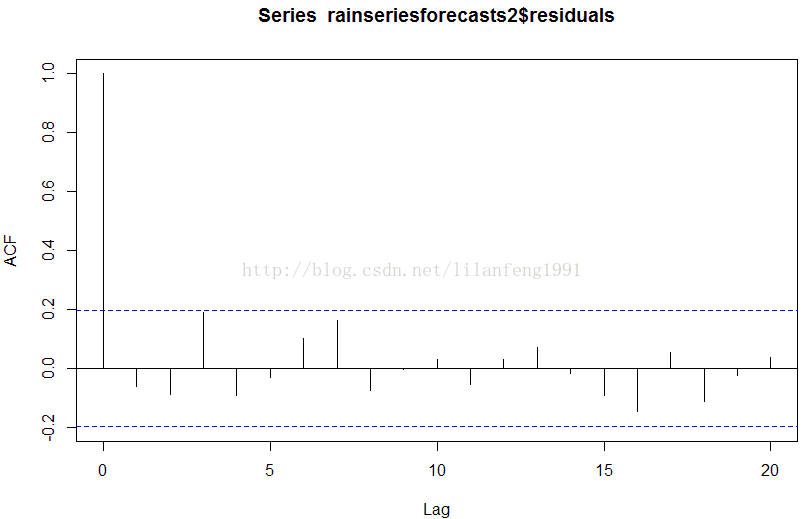
acf(rainseriesforecasts2$residuals, lag.max = 20)
##########################################################
#可以从样本相关图中看出自相关系数在3阶的时候触及了置信界限。
#为了验证在滞后1-20阶(lags 1-20)时候的非0相关是否显著,
#我们可以使用Ljung-Box检验。这可以通过R中的“Box.test()”函数实现。
#最大阶数我们可以通过Box.test()函数中的“lag”参数来指定。
##########################################################Box.test(rainseriesforecasts2$residuals, lag = 20, type = 'Ljung-Box')
##########################################################
#
#Box-Ljung test
#data: rainseriesforecasts2$residuals
#X-squared = 17.4008, df = 20, p-value = 0.6268
##########################################################
##########################################################
#这里Ljung-Box检验统计量为17.4,并且P值是0.6,所以这是不足
#以证明样本内预测误差在1-20阶是非零自相关的。
#为了确定预测模型不可继续优化,
##我们需要一个好的方法来检验预测误差是正态分布,
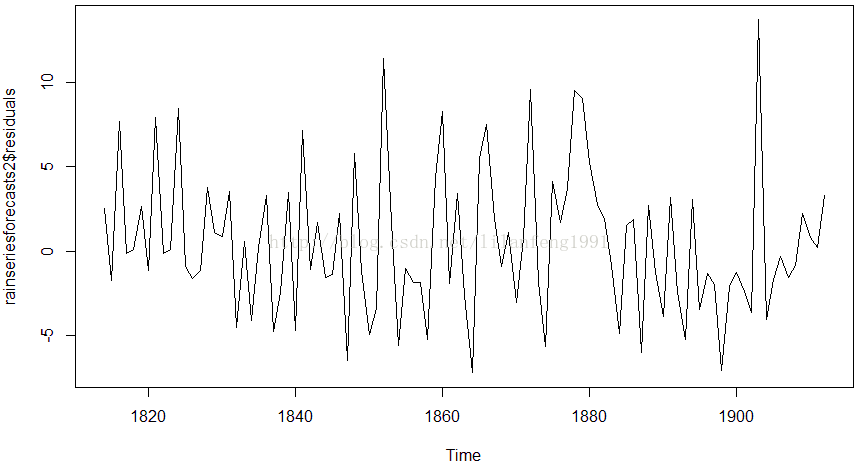
#并且均值为零,方差不变。为了检验预测误差是方差不变的,
#我们可以画一个样本内预测误差图:
##########################################################
plot.ts(rainseriesforecasts2$residuals)
##########################################################
##为了检验预测误差是均值为零的正太分布,
#我们可以画出预测误差的直方图,
#并覆盖上均值为零、标准方差的正态分布的曲线图到预测误差上
##########################################################

plotForecastErrors <- function(forecasterrors){
  # make a red histogram of the forecast errors:
  mybinsize <- IQR(forecasterrors)/4
  mysd <- sd(forecasterrors)
  mymin <- min(forecasterrors) + mysd*5
  mymax <- max(forecasterrors) + mysd*3
  mybins <- seq(mymin, mymax, mybinsize)
  hist(forecasterrors, col="red", freq=FALSE, breaks=mybins) # freq=FALSE ensures the area under the histogram = 1
  # generate normally distributed data with mean 0 and standard deviation mysd
  mynorm <- rnorm(10000, mean=0, sd=mysd)
  myhist <- hist(mynorm, plot=FALSE, breaks=mybins)
  # plot the normal curve as a blue line on top of the histogram of forecast errors:
  points(myhist$mids, myhist$density, type="l", col="blue", lwd=2)

}

plotForecastErrors(rainseriesforecasts2$residuals)

##########################################################
#图展现出预测误差大致集中分布在零附近,
#或多或少的接近正太分布,
#尽管图形看起来是一个偏向右侧的正态分布。
#然后,右偏是相对较小的
#,我们可以可以认为预测误差是服从均值为零的正态分布。
##########################################################
(4)霍尔特指数平滑法
##########################################################
#霍尔特指数平滑法
##########################################################


##########################################################
#霍尔特指数平滑法
#时间序列可以被描述为一个增长或降低趋势的、没有季节性的相加模型
#可以使用霍尔特指数平滑法对其进行短期预测。
##########################################################
##########################################################
#Holt指数平滑法估计当前时间点的水平和斜率。其平滑化是
#由两个参数控制的,alpha,用于估计当前时间点的水平,
#beta,用于估计当前时间点趋势部分的斜率。
#正如简单指数平滑法一样,alpha和beta参数都介于0到1之间,
#并且当参数越接近0,大多数近期的观测则将占据预测更小的权重。
##########################################################
##########################################################
#数据来源:
#可能可以用相加模型描述的有趋势的、无季节性的时间序列案例就是这
#1866年到1911年每年女人们裙子的直径。这个数据可以从该文件获得
# http://robjhyndman.com/tsdldata/roberts/skirts.dat
#初始数据来自Hipel and McLeod, 1994
##########################################################
skirts <- scan("http://robjhyndman.com/tsdldata/roberts/skirts.dat", skip = 5)
skirtsseries <- ts(skirts, start = c(1866))
plot.ts(skirtsseries)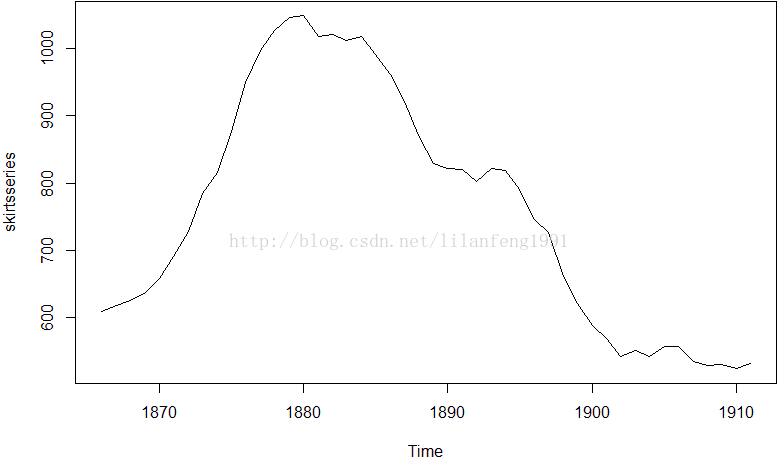
##########################################################
#可以从此图看出裙子直径长度从1866年的600增加到1880的1050,
#并且在此之后有下降到1911年的520。

#为了进行预测,我们使用R中的HoltWinters()函数对预测模型进行调整。
#为了使用HoltWinters()进行Holt指数平滑法,
#我们需要设定其参数gamma=FALSE(gamma参数常常用于Holt-Winters指数平滑法)
##########################################################
skirtsseriesforexasts <- HoltWinters(skirtsseries, gamma = FALSE)

##########################################################
#Holt-Winters exponential smoothing with trend and without seasonal component.

#Call:
 # HoltWinters(x = skirtsseries, gamma = FALSE)

#Smoothing parameters:
#  alpha: 0.8383481
#beta : 1
#gamma: FALSE

#Coefficients:
 # [,1]
#a 529.308585
#b   5.690464
##########################################################
skirtsseriesforexasts$SSE
##########################################################
# skirtsseriesforexasts$SSE
#[1] 16954.18
##########################################################
##########################################################
#这里的alpha预测值为0.84,beta预测值为1.00。
#这都是非常高的值,告诉我们无论是水平上,还是趋势的斜率,
#当前值大部分都基于时间序列上最近的观测值。这样的直观感觉很好,
#因为其时间序列上的水平和斜率在整个时间段发生了巨大的变化。
#预测样本内误差的误差平方和是16954。
##########################################################
plot(skirtsseriesforexasts)
##########################################################
#从该图我们可以看到样本内预测非常接近观测值,
#尽管他们对观测值来说有一点点延迟。
#可以通过HoltWinters()函数中的“l.start”和“b.start”参数
#去指定水平和趋势的斜率的初始值。常见的设定水平初始值是
#让其等于时间序列的第一个值(在裙子数据中是608),而斜率的初始值则是其第
#二值减去第一个值(在裙子数据中是9)。例如,为了使用Holt指数平
#滑法找到一个在裙边直径数据中合适的预测模型,我们设定其水平初始值为608,趋势部分的斜率初始值为9
##########################################################
HoltWinters(skirtsseries, gamma = FALSE, l.start = 608, b.start = 9)
##########################################################
#Holt-Winters exponential smoothing with trend and without seasonal component.

#Call:
#  HoltWinters(x = skirtsseries, gamma = FALSE, l.start = 608, b.start = 9)

#Smoothing parameters:
 # alpha: 0.8346775
#beta : 1
#gamma: FALSE

#Coefficients:
#  [,1]
#a 529.278637
#b   5.670129
##########################################################
##########################################################
#可以使用“forecast”包中的forecast.HoltWinters()函数预测未来时间而无需覆盖原始序列
#现在有的1866年到1911年的裙边直径时间序列数据,
#因此我们可以预测1912年到1930年(19个点或者更多),并且画出他们
##########################################################
skirtsseriesfoecasts2 <- forecast.HoltWinters(skirtsseriesforexasts, h = 19)
plot.forecast(skirtsseriesfoecasts2)
##########################################################
#预测的部分使用蓝色的线条标识出来了,
#浅蓝色阴影区域为80%预测区间,灰色阴影区间为95%的预测区间。
##########################################################
##########################################################
#简单指数平滑法一样,我们瞧瞧样本内预测误差是否在延迟1-20阶时是非零自相关的,
#以此来检验模型是否还可以被优化
#可以创建一个相关图,进行Ljung-Box检验,代码如下:
##########################################################
acf(skirtsseriesfoecasts2$residuals, lag.max = 20)
Box.test(skirtsseriesfoecasts2$residuals, lag = 20, type = 'Ljung-Box')
##########################################################
#Box-Ljung test
#data:  skirtsseriesfoecasts2$residuals
#X-squared = 19.7312, df = 20, p-value = 0.4749
##########################################################
##########################################################
#这个相关图呈现出样本内预测误差的样本自相关系数在#
#滞后5阶的时候超过了置信边界。不管怎样,我们可以界
#定在前20滞后期中有1/20的自相关值超出95%的显著边界
#是偶然的,当我们进行Ljung-Box检验时,P值为0.47,
#意味着我们是不足以证明样本内预测误差在滞后1-20阶的
#时候是非零自相关的。
##########################################################
##########################################################
#和简单指数平滑法一样,我们应该检查整个序列中的预测误差是
#否是方差不变、服从零均值正态分布的。我们可以画出一个时间
#段预测误差图,和一个附上正太曲线的预测误差分布的直方图:
##########################################################
plot.ts(skirtsseriesfoecasts2$residuals)
plotForecastErrors(skirtsseriesfoecasts2$residuals)
##########################################################
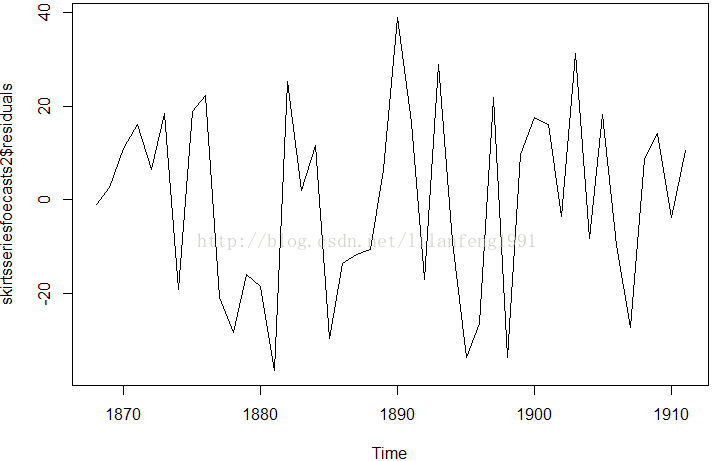
#预测误差的时间曲线图告诉我们预测误差在整个时间段内是大致方差不变的
#这个预测误差的直方图告诉我们预测误差似乎是零均值、方差不变的正态分布。
#Ljung-Box检验告诉我们这是不足以证明预测误差是自相关的,
#而其预测误差的时间曲线图和直方图表示出似乎预测误差是服从零均值、方差不变的正态分布的。
#因此,我们可以总结这Holt指数平滑法为裙边直径提供了一个合适的预测,并且是不可再优化的
#另外,这也意味着基于80%预测区间和95%预测区间的假设是非常合理的。
##########################################################
(5)Holt-Winters指数平滑法
##########################################################
#Holt-Winters指数平滑法
##########################################################

##########################################################
#有一个增长或降低趋势
#并存在季节性
#可被描述成为相加模型的时间序列,
#可以使用霍尔特-温特指数平滑法对其进行短期预测。
##########################################################

##########################################################
#Holt-Winters指数平滑法估计当前时间点的水平,斜率和季节性部分。
#平滑化依靠三个参数来控制:alpha,beta和gamma,
#分别对应当前时间点上的水平,趋势部分的斜率和季节性部分。
#参数alpha,beta和gamma的取值都在0和1之间,
#并且当其取值越接近0意味着对未来的预测值而言最近的观测值占据相对较小的权重。
##########################################################

##########################################################
#用相加模型描述的并附有趋势性和季节性的时间序列案例,
#便是澳大利亚昆士兰州的海滨纪念品商店的月度销售日志
#可以使用HoltWinters()函数对预测模型进行修正
##########################################################
logsouvenirtimeseries <- log(souvenirtimeseries)
souvenirtimeseriesforecasts <- HoltWinters(logsouvenirtimeseries)
souvenirtimeseriesforecasts
##########################################################
#Holt-Winters exponential smoothing with trend and additive seasonal component.

#Call:
 # HoltWinters(x = logsouvenirtimeseries)

#Smoothing parameters:
#  alpha: 0.413418
#beta : 0
#gamma: 0.9561275

#Coefficients:
 # [,1]
#a   10.37661961
#b    0.02996319
#s1  -0.80952063
#s2  -0.60576477
#s3   0.01103238
#s4  -0.24160551
#s5  -0.35933517
#s6  -0.18076683
#s7   0.07788605
#s8   0.10147055
#s9   0.09649353
#s10  0.05197826
#s11  0.41793637
#s12  1.18088423
##########################################################

##########################################################
#这里alpha,beta和gamma的估计值分别是0.41,0.00和0.96。
#alpha(0.41)是相对较低的,意味着在当前时间点估计得
#水平是基于最近观测和历史观测值。beta的估计值是0.00,
#表明估计出来的趋势部分的斜率在整个时间序列上是不变的,
#并且应该是等于其初始值。这是很直观的感觉,水平改变非常多,
#但是趋势部分的斜率b却仍然是大致相同的。与此相反的,
#gamma的值(0.96)则很高,表明当前时间点的季节性部分的估计仅仅基于最近的观测值。
##########################################################

plot(souvenirtimeseriesforecasts)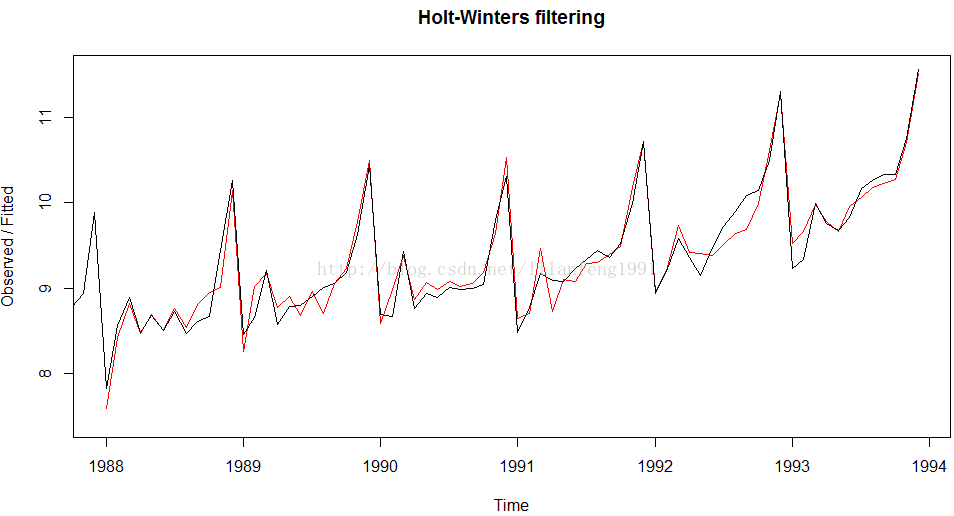
##########################################################
#可以从图中看出Holt-Winters指数平滑法是非常成功得预测了季节峰值,
#其峰值大约发生在每年的11月份。
##########################################################
##########################################################
#为了预测非原始时间序列的未来一段时间,
#我们使用“forecast”包中的“forecast.HoltWinters()”函数
#例如,纪念品销售的原始数据是1987年1月到1993年12月。
#如果我们想预测1994年1月到1998年12月(48月或者更多),并且画出预测,代码如下:
##########################################################
souvenirtimeseriesforecasts2 <- forecast.HoltWinters(souvenirtimeseriesforecasts, h = 48)
plot.forecast(souvenirtimeseriesforecasts2)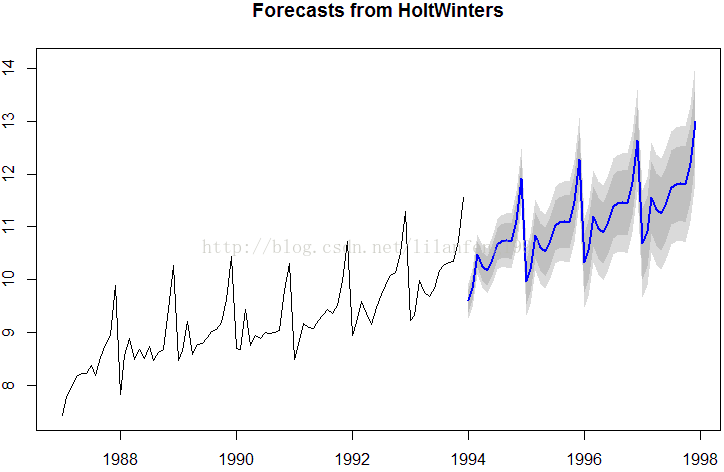
##########################################################
#蓝色线条显示出来的是预测,灰蓝和灰色阴影分别是80%和95%的预测区间。
##########################################################
##########################################################
#可以通过画相关图和进行Ljung-Box检验来检查样本内预测误差
#在延迟1-20阶时否是非零自相关的,并以此确定预测模型是否可以再被优化。
##########################################################
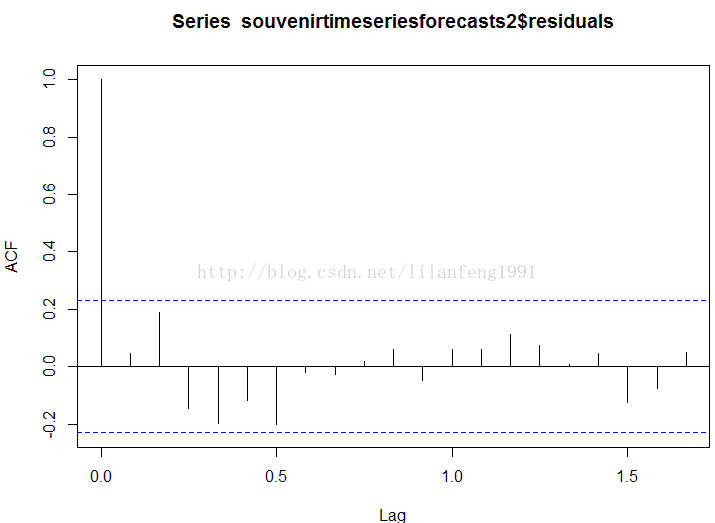
acf(souvenirtimeseriesforecasts2$residuals, lag.max = 20)
Box.test(souvenirtimeseriesforecasts2$residuals, lag = 20, type = 'Ljung-Box')
##########################################################
#  Box-Ljung test

#data:  souvenirtimeseriesforecasts2$residuals
#X-squared = 17.5304, df = 20, p-value = 0.6183
##########################################################
##########################################################
# 这个样本内预测误差的相关图并没有在延迟1-20阶内自相关系数超过置信界限的。
#而且,Ljung-Box检验的P值是0.6,意味着是不足以证明延迟1-20阶是非零自相关的。
#可以在整个时间段内检验预测误差是否是方差不变,并且服从零均值正态分布的。
#方法是画出预测误差的时间曲线图和直方图(并覆盖上正太曲线):
##########################################################
plot.ts(souvenirtimeseriesforecasts2$residuals)
plotForecastErrors(souvenirtimeseriesforecasts2$residuals)
##########################################################
#似乎告诉我们预测误差在整个时间段是方差不变的。
#从预测误差的直方图,似乎其预测误差是服从均值为零的正态分布的。
#这是不足以证明预测误差 在延迟 1-20 阶是自相关的,
#并且预测误差 自相关的,整个时间段呈现出服从零均值、方差 零均值、方差
#不变的正态分布。这 不变的正态分布。这 不变的正态分布。这 不变的正态分布。
#这暗示着 暗示着 Holt Holt-WintersWintersWinters WintersWintersWinters指数平滑法为
#纪念品商店的销售数据提供了一个合适预测模纪念品商店的销售数据提供了一个合适预测模型
#区间的假设 也是 合理 的。
##########################################################
(6)时间序列的差分
##########################################################
#对于平稳性正式的检验
#称作”单位根测试“
#可在fUnitRoots包中得到
##########################################################
##########################################################
#时间序列的差分
##########################################################
##########################################################
#ARIMAARIMAARIMAARIMAARIMA模型为平稳时间序列定义的。
#因此,如果你从一个非开始首先就需要做差分直 模型为平稳时间序列定义的。
#若必须对时间序列做d阶养分才能得到一个平稳序列,可使用ARIMA(p,d,q)模型,共中,d是差分的阶数
#可使用diff()函数作时间序列的差分
##########################################################
##########################################################
#我们可以通过键入下面的代码来得到时间序列(数据存于“skirtsseries“)
#的一阶养分,并画出差分序列的图
##########################################################
skirtsseriesdiff1 <- diff(skirtsseries, differences = 1)
plot.ts(skirtsseriesdiff1)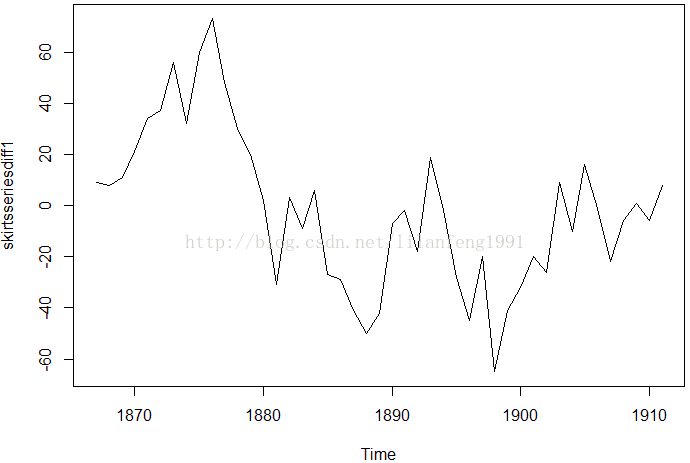
##########################################################
#一阶差分时间序列结果(上图) 一阶差分时间序结果均值看起来并不平稳
#因此,我们需要再次做差分来看一下是否能得到个平稳时间序列
##########################################################
skirtsseriesdiff2 <- diff(skirtsseries, differences = 2)
plot.ts(skirtsseriesdiff2)
##########################################################
#上例中,二次养分后的时间序列在均值和方差上确实看起来像是平稳的,
#随时间推移,时间序列的水平和方差大致保持不变
#因此,看起来需对裙子进行两次差分以得到平稳序列
##########################################################
##########################################################
#选择一个合适的ARIMA模型
##########################################################

##########################################################
#若时间序列是平稳的,或通过n次差分转化为一个平稳时间序列,
#接下来即选择合适的ARIMA模型,即寻找ARIMA(p,d,q)中合适的p值和q值
#通常需要检查平稳时间序列的(自)相关图和偏相关图
#acf()和pacf()
##########################################################


##########################################################
#快捷方式:auto.arima()函数
#auto.arima()函数可用以发现合适的ARIMA模型
# library(forecast)
#auto.arima(kings)
##########################################################


##########################################################
#北半球的火山灰覆盖实例
##########################################################
volcanodust <- scan("http://robjhyndman.com/tsdldata/annual/dvi.dat", skip = 1)
volcanodustseries <- ts(volcanodust, start = c(1500))
plot.ts(volcanodustseries)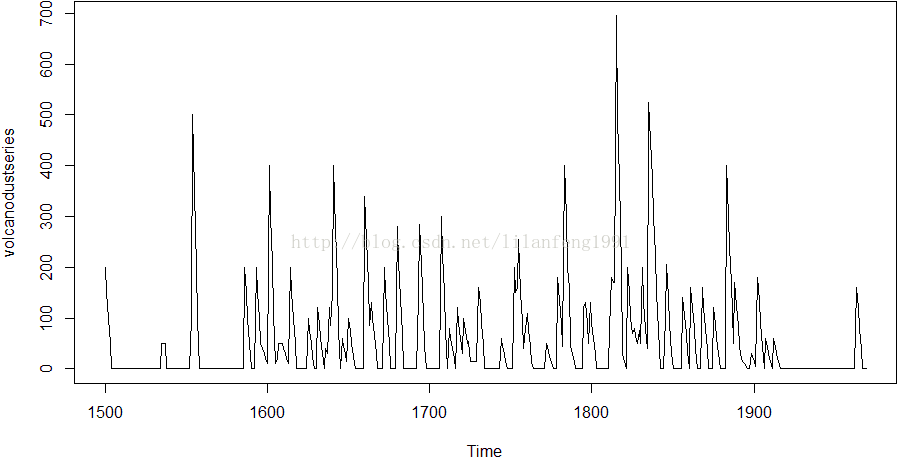
##########################################################
#从图上看出,随着时间增加,时间序列上面的随机波动逐渐趋与一个常数,
#所以添加一个合适的模型可以很好地描述这个时间序列。
#进一步地,此时间序列看起来在平均值和方差上面是平稳的,
#即随着时间变化,他们的水平和方差大致趋于常量。
#因此,我们不需要做差分来适应ARIMA模型,而是用原始数据就可以找到合适的ARIMA模型
##########################################################

##########################################################
#可以画出滞后1-20阶(lags 1-20)的自相关图和偏相关图来
#观察我们需要使用哪个ARIMA模型。
##########################################################
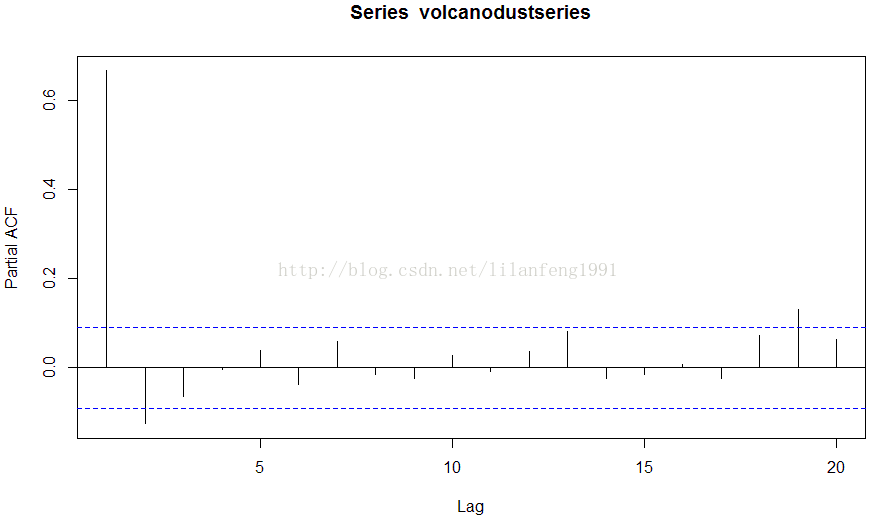
acf(volcanodustseries, lag.max = 20)
acf(volcanodustseries, lag.max =20, plot = FALSE) # get the values of the autocorrelations


pacf(volcanodustseries, lag.max = 20)
pacf(volcanodustseries, lag.max = 20, plot = FALSE)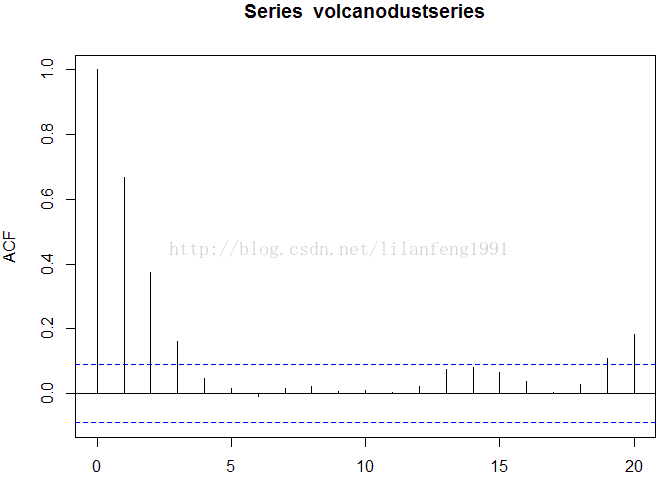
##########################################################
#shortcut: the auto.arima() function 快捷方式:auto.arima()函數
##########################################################
##########################################################
#英国国王去世年龄的例子
##########################################################
kingstimeseriesarima <- arima(kingstimeseries, order = c(0, 1, 1)) # fit an ARIMA(0,1,1)model
kingstimeseriesarima
##########################################################
#Series: kingstimeseries
#ARIMA(0,1,1)

#Coefficients:
#  ma1
#-0.7218
#s.e.   0.1208

#sigma^2 estimated as 230.4:  log likelihood=-170.06
#AIC=344.13   AICc=344.44   BIC=347.56
##########################################################

##########################################################
#如果我们对时间序列使用ARIMA(0,1,1)模型,那就意味着我们对
#一阶时间序列使用了ARMA(0,1) 模型。 ARMA(0,1) 模型可以写
#作X_t - mu = Z_t - (theta * Z_t-1),其中theta是被估计的参数。
#从R 中“arima()”函数的输入(上面),在国王去世年龄的时间序列
#中使用ARIMA(0,1,1) 模型的情况下,theta 的估计值
#(在R输出中以‘ma1’给出) 为-0.7218。
##########################################################
##########################################################
#指定预测区间的置信水平
#使用forecast.Arima() 中“level”参数来确定预测区间的置信水平
#可以使用ARIMA模型来预测时间序列未来的值,使用R中forecast包的“forecast.Arima()” 函数。
##########################################################
library("forecast")
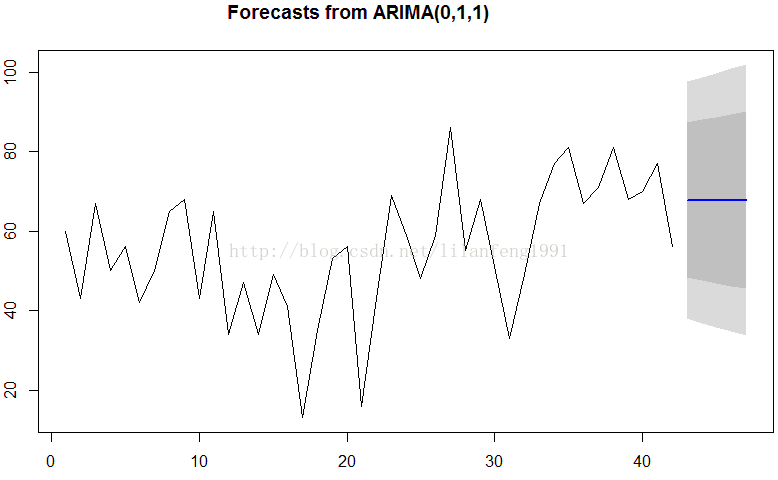
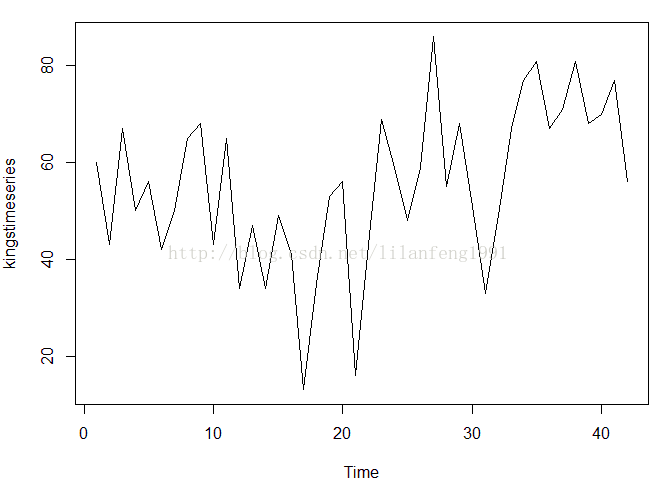
kingstimeseriesforecasts <- forecast.Arima(kingstimeseriesarima, h = 5)
kingstimeseriesforecasts #给出预测
plot.forecast(kingstimeseriesforecasts)
##########################################################
#也要观察连续预测误差是否(自)相关
##########################################################
acf(kingstimeseriesforecasts$residuals, lag.max = 20)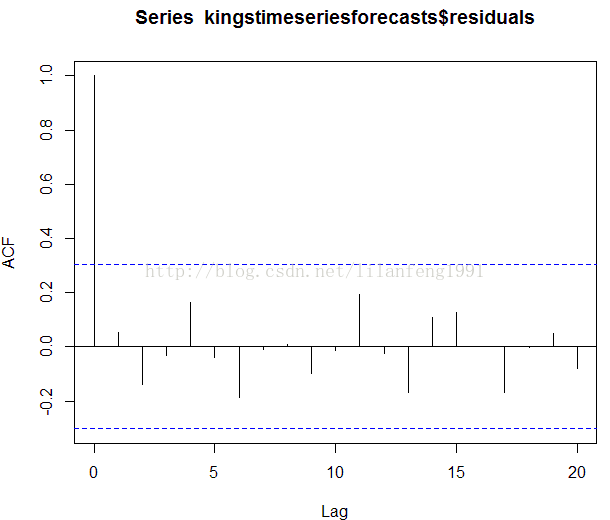
Box.test(kingstimeseriesforecasts$residuals, lag = 20, type = 'Ljung-Box')
##########################################################
#  Box-Ljung test

#data:  kingstimeseriesforecasts$residuals
#X-squared = 13.5844, df = 20, p-value = 0.8509
##########################################################
##########################################################
#既然相关图显示出在滞后1-20阶(lags 1-20)中样本自相关值都
#没有超出显著(置信)边界,而且Ljung-Box检验的p值为0.9,所
#以我们推断在滞后1-20阶(lags 1-20)中没有明显证据说明预测
#误差是非零自相关的。 为了调查预测误差是否是平均值为零且方
#差为常数的正态分布(服从零均值、方差不变的正态分布),我们
#可以做预测误差的时间曲线图和直方图(具有正态分布曲线):
##########################################################
plot.ts(kingstimeseriesforecasts$residuals)
plotForecastErrors(kingstimeseriesforecasts$residuals)
##########################################################
#既然依次连续的预测误差看起来不是相关,而且看起来是平均值
#为0方差为常数的正态分布(服从零均值、方差不变的正态分布),
#那么对于英国国王去世年龄的数据,ARIMA(0,1,1)看起来是可以
#提供非常合适预测的模型。
##########################################################
18. Analysis of Integrated and Cointegrated Time Series with R Examples
(1)单变量平稳时间序列分析(Univariate Analysis of Stationary Time Series)
library(TSA)
#########################################################
#R Code 1.1 Simulation of AR(1)-process with φ = 0.9
#########################################################
set.seed(123456)
y <- arima.sim(n = 100, list(ar = 0.9), innov = rnorm(100))
op <- par(no.readonly = TRUE)
layout(matrix(c(1, 1, 2, 3), 2, 2, byrow = TRUE))
plot.ts(y, ylab = '')
acf(y, main = "Autocorrelations", ylab = '', ci.col = 'black')
pacf(y, main = "Partial Autocorrelations", ylab = '', ylim = c(-1, 1), ci.col = 'black')
par(op)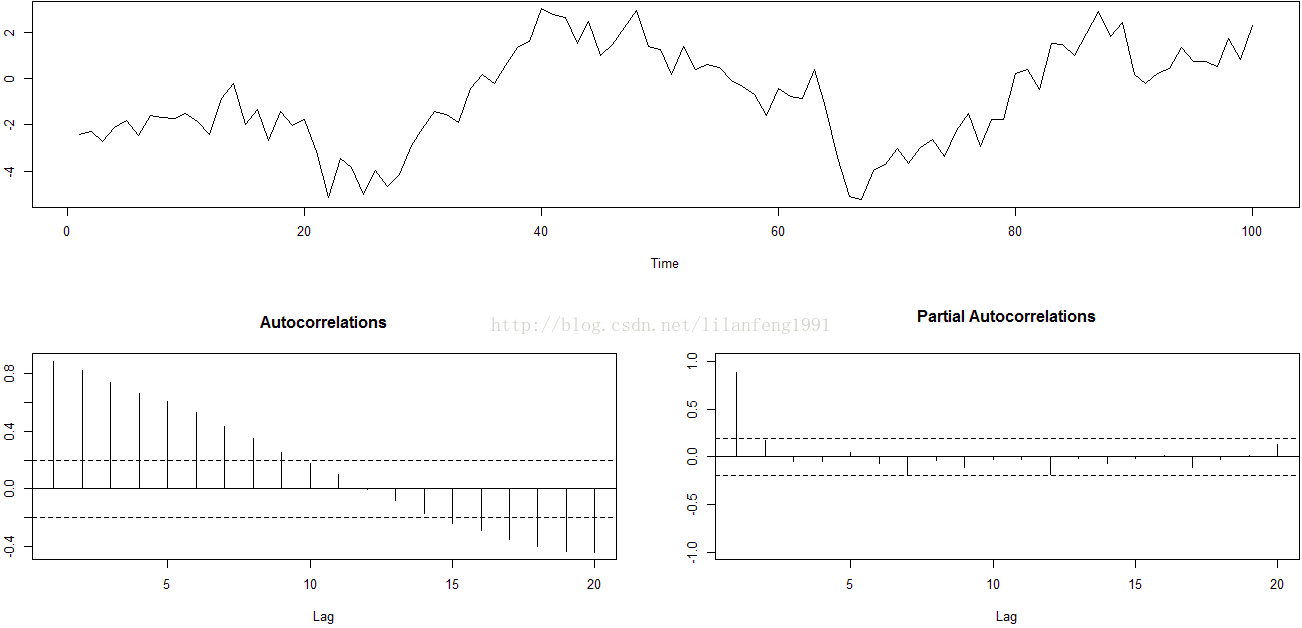
#########################################################
#可使用polyroot()函数来检验过程的稳健性
#filter()与arima.sim()类似,但前者也可生成非稳定性的AR(p)过程
#########################################################
#######################################################################
#R Code 1.2 Estimation of AR(2)-process with φ1 = 0.6 and φ2 = −0.28
#######################################################################
series <- rnorm(1000)
y.st <- filter(series, filter = c(0.6, -0.28), method = 'recursive')
#############################################################
#filter可用于单变量时间序列的拟合,或多变量中的每一个时间序列
#############################################################
ar2.st <- arima(y.st, c(2, 0, 0), include.mean = FALSE, transform.pars = FALSE, method = "ML")
#############################
#arima用于单变量ts的模型拟合
#############################
ar2.st$coef
#############################
#      ar1        ar2
#0.6147474 -0.2835138
#############################
polyroot(c(1, -ar2.st$coef))

#####################################
#polyroot查找一个多项式的全零矩阵
#####################################
#########################################
#  1.084158+1.533547i 1.084158-1.533547i
#########################################
?Mod
Mod(polyroot(c(1, -ar2.st$coef)))
#####################################
#1.878075 1.878075
#####################################
root.comp <- lm(polyroot(c(1, -ar2.st$coef)))##运行的有问题
root.real <- Re(polyroot(c(1, -ar2.st$coef)))
#Plotting the roots in a unit circle
x <- seq(-1, 1, length = 1000)
y1 <- sqrt(1- x^2)
y2 <- -sqrt(1- x^2)
plot(c(x,x), c(y1, y2), xlab = 'Real part', ylab = 'Complex part', type = 'l',
     main = 'Unit Circle', ylim = c(-2, 2), xlim = c(-2, 2))

abline(h = 0)
abline(v = 0)
points(Re(polyroot(c(1, -ar2.st$coef))),   #运行的有问题
       lm(polyroot(c(1, -ar2.st$coef))), pch = 19)
legend(-1.5, -1.5, legend = 'Roots of AR(2)', pch = 19)
#####################################
#在这运行出来的lm, Re是有问题的
#####################################
#######################################################################
#R Code 1.3 Box-Jenkins: U.S. unemployment rate
#######################################################################
###########################################
#logLik:所谓的对数似然值就是对数似然函数使其达到最大的取值。或都说是对数似然方程dlnL(t)/dt=0的值。模型比较时越大越好。
#AIC:假设模型的误差服从独立正态分布,鼓励数据拟合的优良性但避免出现过度拟合的情况,因此考虑模型就是AIC 值最小的那一个
#AICc:当样本小的情况下,AIC转变为AICc
#QAIC:可以调整过度离散
#BIC:乘法函数的线性组合, 值越小越好
###########################################
install.packages('urca')
library(urca)
data(npext)
y <- ts(na.omit(npext$unemploy), start = 1909, end = 1988, frequency = 1)
op <- par(no.readonly = TRUE)
layout(matrix(c(1, 1, 2, 3), 2, 2, byrow = TRUE))
plot(y, ylab = 'unemployment rate(logarithm')
acf(y, main = 'Autocorrelations', ylab = '')
pacf(y, main = 'Partial Autocorrelations', ylab = '', ylim = c(-1, 1))
par(op)
##tentative ARMA(2,0)
arma20 <- arima(y, order = c(2, 0, 0))
ll20 <- logLik(arma20)
#logLik返回的是一个model中参数的估计值,df为自由度
aic20 <- arma20$aic
res20 <- residuals(arma20)
Box.test(res20, lag = 20, type = 'Ljung-Box')
#####################################
#Box-Ljung test

#data:  res20
#X-squared = 21.914, df = 20, p-value = 0.3452
#####################################
shapiro.test(res20)
#####################################
#Shapiro-Wilk normality test

#data:  res20
#W = 0.9931, p-value = 0.9501
#####################################
#alternative specifications
#ARMA(3, 0)
arma30 <- arima(y, order = c(3, 0, 0))
ll30 <- logLik(arma30)
aic30 <- arma30$aic
lrtest <- as.numeric(2*(ll30 - ll20))
chi.pval <- pchisq(lrtest, df = 1, lower.tail = FALSE)
#ARMA(1, 1)
arma11 <- arima(y, order = c(1, 0, 1))
ll11 <- logLik(arma11)
aic11 <- arma11$aic
tsdiag(arma11)
#tsdiag时间序列的诊断图
res11 <- residuals(arma11)
Box.test(res11, lag = 20, type = 'Ljung-Box')
#####################################
#Box-Ljung test

#data:  res11
#X-squared = 15.1402, df = 20, p-value = 0.7683
#####################################
shapiro.test(res11)
#shapiro.test正态性检验
#####################################
#Shapiro-Wilk normality test

#data:  res11
#W = 0.9862, p-value = 0.5456
#####################################
tsdiag(arma11)
##using auto.arima()
library(forecast)
auto.arima(y, max.p = 3, max.q = 3, start.p = 1, start.q = 1, ic = 'aic')
#####################################
#Series: y
#ARIMA(1,0,1) with non-zero mean

#Coefficients:
#  ar1     ma1  intercept
#0.5272  0.5487     1.6934
#s.e.  0.1221  0.1456     0.1546

#sigma^2 estimated as 0.1845:  log likelihood=-46.51
#AIC=101.01   AICc=101.55   BIC=110.54
#####################################
#######################################################################
#R Code 1.4 Box-Jenkins: Predictions of the U.S. unemployment rate
#######################################################################
#Forecasts
arma11.pred <- predict(arma11, n.ahead = 10)
predict <- ts(c(rep(NA, length(y) - 1), y[length(y)], arma11.pred$pred))
upper <- ts(c(rep(NA, length(y) - 1), y[length(y)], arma11.pred$pred + 2 * arma11.pred$se), start = 1909, frequency = 1)
lower <- ts(c(rep(NA, length(y) - 1), y[length(y)], arma11.pred$pred - 2 * arma11.pred$se), start = 1909, frequency = 1)
observed <- ts(c(y, rep(NA, 10)), start = 1909, frequency = 1)
##plot of actual and forecasted values
plot(observed, type = 'l', ylab = 'Actual and predicated values', xlab = '')
lines(predict, col = 'blue', lty = 2)
lines(lower, col = 'red', lty = 5)
lines(upper, col = 'red', lty = 5)
abline(v = 1988, col = 'gray', lty = 3)
(2)多变量平稳时间序列分析(Multivariate Analysis of Stationary Time Series)
#########################################################
#R Code 2.1 Simulation of VAR(2)-process
#########################################################
##Simulate VAR(2)-data
install.packages("dse1")
install.packages("vars")
library(dse1)
library(vars)
##Setting the lag-polynomial A(L)
Apoly <- array(c(1.0, -0.5, 0.3, 0,
                 0.2, 0.1, 0, -.02,
                 0.7, 1, 0.5, -0.3),
               c(3, 2, 2))
##Setting Covariance to identity-matrix
B <- diag(2)
##Setting constant term to 5 and 100
TRD <- c(5, 10)
#Generating the VAR(2) model
var2 <- ARMA(A = Apoly, B = B, TREND = TRD)
##Simulating 500 observations
varsim <- simulate(var2, sampleT = 500, noise = list(w = matrix(rnorm(1000),
            nrow = 500, ncol = 2)), rng = list(seed = c(123456)))
##Obtaining the generated series
vardat <- matrix(varsim$output, nrow = 500, ncol = 2 )
colnames(vardat) <- c("y1", "y2")
##Plotting the series
plot.ts(vardat, main = '', xlab = "")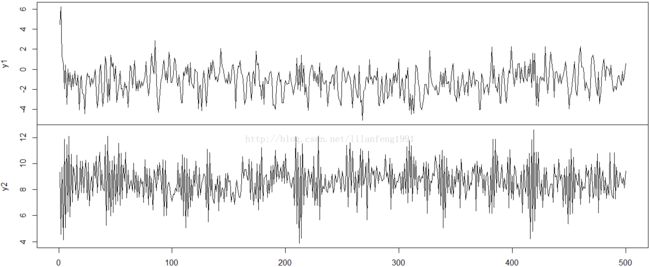
##Determing an appropriate lag-order
infocrit <- VARselect(vardat, lag.max = 3, type = 'const')
##Estimating the model
varsimest <- VAR(vardat, p = 2, type = 'const', season = NULL, exogen = NULL)
##Alternatively , selection according to AIC
varsimest <- VAR(vardat, type = 'const', lag.max = 3, ic = 'SC')
##Checking the roots
##roots用于测试stability
roots <- roots(varsimest)
#########################################################
#R Code 2.2 Diagnostic tests of VAR(2)-process
#########################################################
##testing serial correlation
args(serial.test) ##列出serial.test中的args
##Portmanteau-Test 序列化的相关误差的检验
?serial.test
var2c.serial <- serial.test(varsimest, lags.pt = 16, type = 'PT.asymptotic')
var2c.serial
plot(var2c.serial, names = 'y1')
plot(var2c.serial, names = 'y2')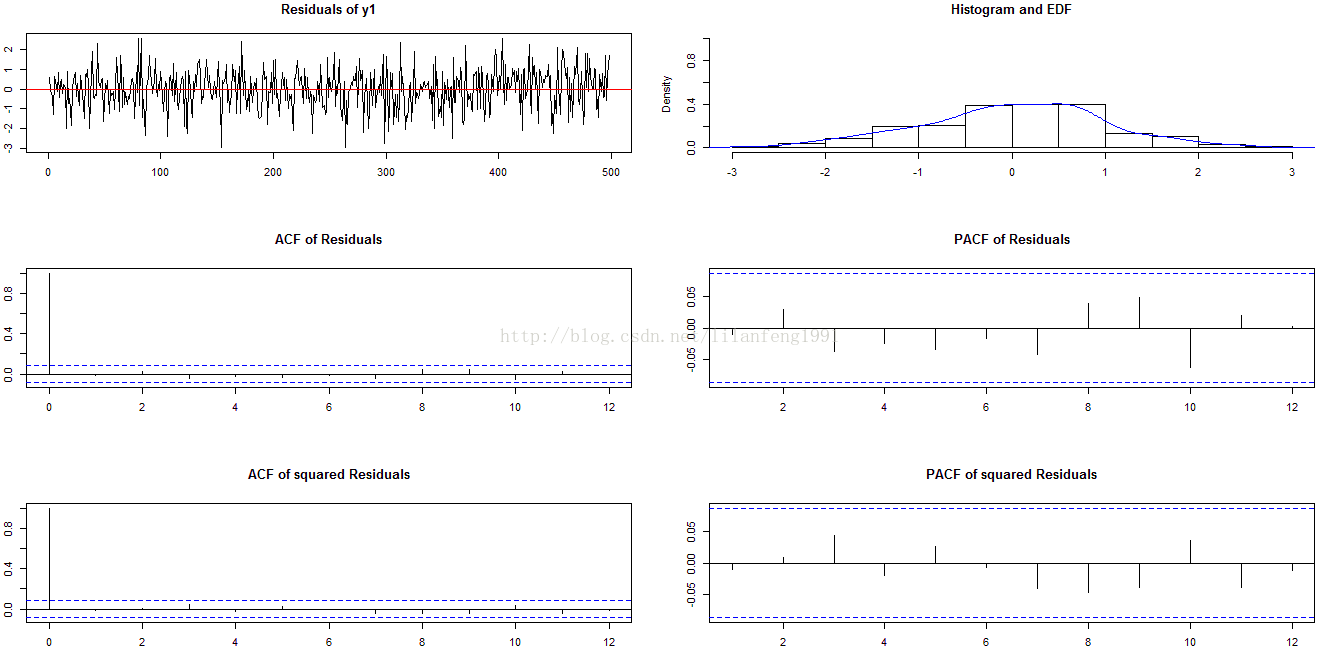
##testing heteroscedasticity 检验异方差性
args(arch.test)
var2c.arch <- arch.test(varsimest, lags.multi = 5, multivariate.only = TRUE)
var2c.arch
#arch.test()返回三个值:
#第一个值是matrix的residuals
#第二值是由arch.uni来标识的,是一个list对象,存储着每一个series单一test的结果
#第三什值存储着多元test的结果,由arch.nul标识
##testing for normality
args(normality.test)
var2c.norm <- normality.test(varsimest, multivariate.only = TRUE)
var2c.norm
##class and methods for diagnostic tests
class(var2c.serial)
class(var2c.arch)
class(var2c.norm)
methods(class = 'varcheck')
##Plot of objects"varcheck"
args(vars:::plot.varcheck)
plot(var2c.serial, names = 'y1')
#########################################################
#R Code 2.3 Empirical fluctuation processes
#########################################################
#########################################################
# struchange包中的efp()可实现CUSUM、CUSUM-of-squares,MOSUM及fluctuation test
# vars包中的stability()是对efp()函数的封装
#########################################################
reccusum <- stability(varsimest, type = "OLS-CUSUM")
par(mfrow = c(2, 1))

plot(reccusum)
fluctuation <- stability(varsimest, type = "fluctuation")
plot(fluctuation)
#########################################################
#R Code 2.4 Causality analysis of VAR(2)-process
#########################################################
#3# Causality tests
## Granger and instantaneous causality
var.causal <- causality(varsimest, cause = 'y2')
#########################################################
#R Code 2.5 Forecasts of VAR-process
#########################################################
#########################################################
#除了forecasts,其他用于探索变量间关系的方法有:impulse response analysis 及forecast error variance decomposition
#########################################################
##Forecasting objects of class varest
args(vars:::predict.varest)
predictions <- predict(varsimest, n.ahead = 25, ci = 0.95)
class(predictions)
args(vars:::plot.varprd)
##plot of predictions for y1
plot(predictions, names = "y1")
## Fanchart for y2
args(fanchart)
fanchart(predictions, names = "y2")
predictions
#########################################################
#R Code 2.6 IRA of VAR-process
#########################################################
##Impulse response analysis
irf.y1 <- irf(varsimest, impulse = 'y1',
              response = "y2", n.ahead = 10,
              ortho = FALSE, cumulative = FALSE,
              boot = FALSE, seed = 12345)
args(vars:::plot.varirf)
plot(irf.y1)
irf.y2 <- irf(varsimest, impulse = 'y2',
              response = "y1", n.ahead = 10,
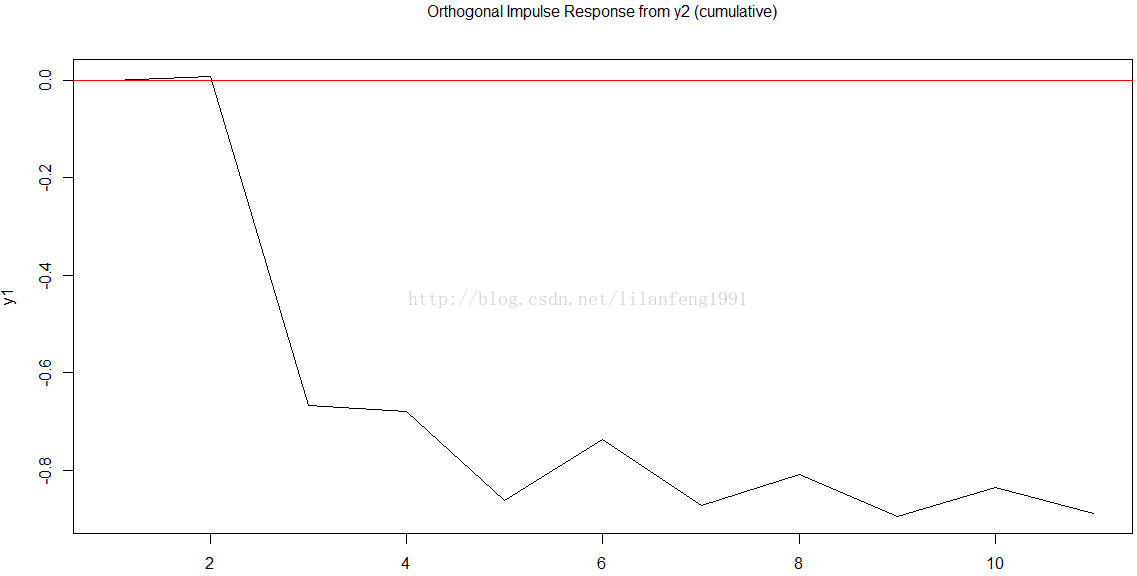
              ortho = TRUE, cumulative = TRUE,
              boot = FALSE, seed = 12345)
plot(irf.y2)

#########################################################
#R Code 2.6 FEVD of VAR-process
#########################################################
##Forecast error variance decomposition
fevd.var2 <- fevd(varsimest, n.ahead = 10)
args(vars:::plot.varfevd)
par(mfrow = c(2,1))
plot(fevd.var2, addbars = 2)
?plot
fevd.var2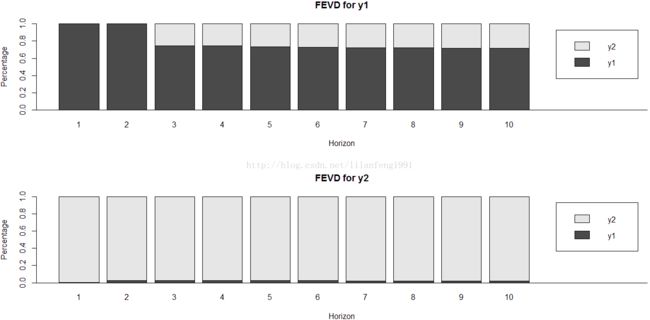
分析过程:
#########################################################
#使用des1,vars包
#确定多元系数:A、B、TRD
#用ARMA()生成VAR(2)模型
#用simulate()模拟n个onservations,存入varsim中
#获得生成的系列数据,存入vardat中
#画出series图,plot.ts()
#使用VARselect()确定适当的lag-order的value
#model的estimate
#使用VAR()来通过type为“AIC”或“const”来estimate model
#roots()函数来checking roots

## VAR-model完成estimated后,需探索其residuals是否与model的假设相附合
#需check两部分: absence of serial correlation(相关性)[Portmanteau test 及 LM test]及hereoscedasticity(异方差性),来判断是否队伍正态分布
#serial.test():返回值在list元素中的serial, 有一个class属性htest

#最终check,执行structural stability test: CUSUM、CUSUM-of-squares(多元统计)及fluctuation tests(每个方程等式偏差的检验),均可通过vars包来实现
#

#Jarque-Bera正态性检验可用于单变量或多元series的residuals的分析,包括多元的峰度及峭度

# 通过vars包中的normality.test()来计算


#causality analysis
#寻找变量之间的关系
#较为有名的是Granger causality test


# forecasting
# 通过诊断检验的VAR-model可用于forecasting
# 主要目的是发现模型中各变量之间隐含的关系
#其他的工具impulse response analysis及forecast error variance decomposition
# VAR-processes是通过vars包中的predict()中的varest属性

# Impulse Response Functions
# Forecast Error Variance Decomposition(FEVD)是以impulse response coefficient matrix为基础的
########################################################
#########################################################
# Structural Vector Autoregressive Models
#########################################################
#########################################################
# R Code 2.8 SVAR: A-model
#########################################################
library(dse1)
library(vars)
Apoly <- array(c(1.0, -0.5, 0.3, 0.8,
0.2, 0.1, -0.7, -0.2,
0.7, 1, 0.5, -0.3),
c(3, 2, 2))
## Setting covariance to identity-matrix
B <- diag(2)
# Generating the VAR(2)model
svarA <- ARMA(A = Apoly, B = B)
svarA
## Simulating 500 observations
svarsim <- simulate(svarA, sampleT = 500,
rng = list(seed = c(123456)))
## Obtaining the generated series
svardat <- matrix(svarsim$output, nrow = 500, ncol = 2)
colnames(svardat) <- c("y1", "y2")
#Estimating the VAR
varest <- VAR(svardat, p = 2, type = 'none')
#Setting up matrices for A-model
Amat <- diag(2)
Amat[2, 1] <- NA
Amat[1, 2] <- NA
## Estimating the SVAR A-type by direct maximisation of the log-likelihood
args(SVAR)
svar.A <- SVAR(varest, estmethod = 'direct', Amat = Amat, hessian = TRUE)
svar.A
#########################################################
# R Code 2.9 SVAR: B-model
#########################################################
library(dse1)
library(vars)
## B-model
Apoly <- array(c(1.0, -0.5, 0.3, 0,
                 0.2, 0.1, 0, -0.2,
                 0.7, 1, 0.5, -0.3),
               c(3, 2, 2))
## Setting covariance to identity-matrix
B <- diag(2)
B[2, 1] <- -0.8
## Generating the VAR(2) model
svarB <- ARMA(A = Apoly, B = B)
## Simulating 500 observatins
svarsim <- simulate(svarB, sampleT = 500, rng = list(seed = c(12346)))
svardat <- matrix(svarsim$output, nrow = 500, ncol = 2)
colnames(svardat) <- c("y1", "y2")
varest <- VAR(svardat, p = 2, type = 'none')
## Estimating the SVAR B-type by scoring algorithm
## Setting up the restriction matrix and vector for B-model
Bmat <- diag(2)
Bmat[2, 1] <- NA
svar.B <- SVAR(varest, estmethod = "scoring", Bmat = Bmat, max.iter = 200)
#########################################################
# R Code 2.10 SVAR: Impulse response analysis
#########################################################
## Impulse response analysis of SVAR A-type model
args(vars:::irf.svarest)
irf.svara <- irf(svar.A, impulse = 'y1', response = 'y2', boot = FALSE)
args(vars:::plot.varirf)
plot(irf.svara)
#########################################################
# R Code 2.11 SVAR: Forecast error variance decomposition
#########################################################
##FEVD analysis oof SVAR B-type model
args(vars:::fevd.svarest)
fevd.svarb <- fevd(svar.B, n.ahead = 5)
class(fevd.svarb)
methods(class = 'varfevd')
par(mfrow = c(2, 1))
plot(fevd.svarb)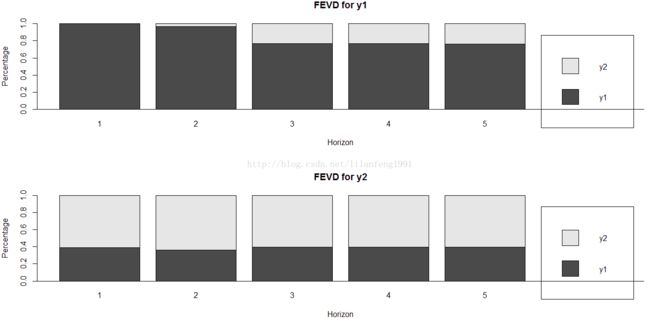
(3)非平稳时间序列(Non-stationary Time Series)
#########################################################
# R Code 3.1 Stochastic and deterministic trends
# 随机趋势与确定性趋势
#########################################################
set.seed(123456)
e <- rnorm(500)
## pure random walk
rw.nd <- cumsum(e)
# trend
trd <- 1:500
## random walk with drift
rw.wd <- 0.5*trd + cumsum(e)
## deterministic trend and noise
dt <- e +0.5*trd
lines(dt)
##plotting
par(mar = rep(5, 4))
plot.ts(dt, lty = 1, ylab = '', xlab = '')
lines(rw.wd, lty = 2)
par(new = T)
plot.ts(rw.nd, lty = 3, axes = FALSE)
axis(4, pretty(range(rw.nd)))
lines(rw.nd, lty = 3)
legend(5, 19, legend = c('det.trend + noise(ls)', 'rw drift(ls)', 'rw(rs)'), lty = c(1, 2, 3))
#########################################################
# R Code 3.2 ARMA versus ARFIMA model
#########################################################
install.packages("fracdiff")
library(fracdiff)
set.seed(123456)
#ARFIMA(0.4, 0, 0.0)
y1 <- fracdiff.sim(n = 100, ar = 0.4, ma = 0.0, d = 0.4) ##使用fracdiff包中的fracdiff.sim()生成一100个long-memory series
# ARIMA(0.4, 0.0, 0.0)
y2 <- arima.sim(model = list(ar = 0.4), n = 1000) ##使用arima.sim()生成short memory series
# Graphics
op <- par(no.readonly = TRUE)
layout(matrix(1:6, 3, 2, byrow = FALSE))

plot.ts(y1$series, main = 'Time series plot of long memory', ylab = '')
acf(y1$series, lag.max = 100, main = 'Autocorrelations of long memeory')
spectrum(y1$series, main = 'Spectral density of long memeory')

plot.ts(y2, main = 'Time series plot of short memory', ylab = '')
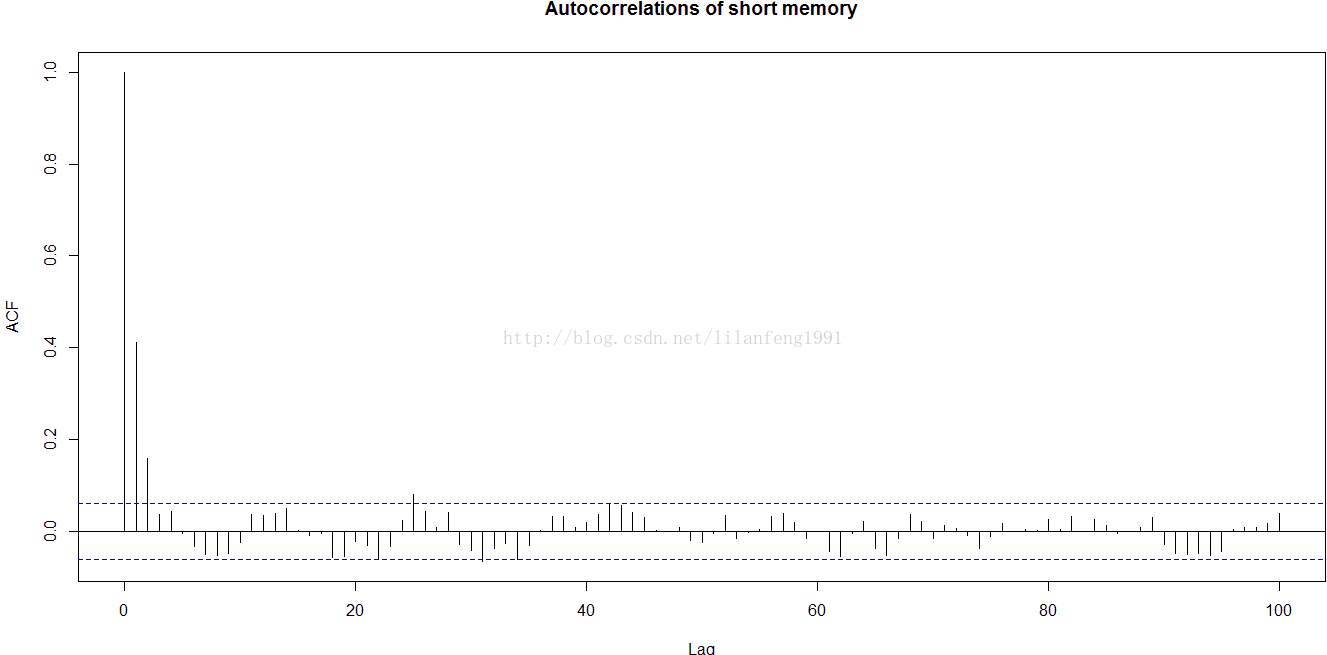
acf(y2, lag.max = 100, main = 'Autocorrelations of short memory')
spectrum(y2, main = 'Spectral density of short memory')
par(op)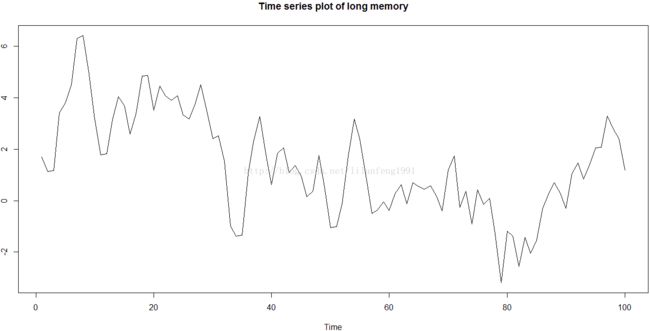
###################################################
# estimate the fractional difference parameter d
# detect the long-memory behavior in a time  series
# 方法Hurst
###################################################
#########################################################
# R Code 3.3 R/S statistic
#########################################################
library(fracdiff)
set.seed(123456)
# ARFIMA(0.0, 0.3, 0.0)
y <- fracdiff.sim(n = 1000, ar = 0.0, ma = 0.0, d = 0.3)
# Get the data series, demean this if necessary
y.dm <- y$series
max.y <- max(cumsum(y.dm))
min.y <- min(cumsum(y.dm))
sd.y <- sd(y$series)
RS <- (max.y - min.y)/sd.y
H <- log(RS)/log(1000)
d <- H - 0.5
#########################################################
# R Code 3.4 Geweke and Porter-Hudak method
#########################################################
library(fracdiff)
set.seed(123456)
y <- fracdiff.sim(n = 1000, ar = 0.0, ma = 0.0, d = 0.3)
y.spec <- spectrum(y$series, plot = FALSE)
lhs <- log(y.spec$spec)
rhs <- log(4*(sin(y.spec$freq/2))^2)
gph.reg <- lm(lhs ~ rhs)
gph.sum <- summary(gph.reg)
sqrt(gph.sum$cov.unscaled*pi/6)[2, 2]
gph.sum(4)伪相关(Spurious regression)
#########################################################
# Spurious regression
#########################################################
#########################################################
# R Code 4.1 Spurious regression
#########################################################
library(lmtest)
set.seed(123456)
e1 <- rnorm(500)
e2 <- rnorm(500)
trd <- 1:500
y1 <- 0.8*trd + cumsum(e1)
y2 <- 0.6*trd + cumsum(e2)
sr.reg <- lm(y1 ~ y2)
sr.dw <- dwtest(sr.reg)$statistic
summary(sr.reg)
sr.dw
#########################################################
# R Code 4.2 Engle-Granger procedure with generated data
#########################################################
set.seed(123456)
e1 <- rnorm(100)
e2 <- rnorm(100)
y1 <- cumsum(e1)
y2 <- 0.6*y1 + e2
lr.reg <- lm(y2 ~ y1)
error <- residuals(lr.reg)
error.lagged <- error[-c(99, 100)]
dy1 <- diff(y1)
dy2 <- diff(y2)
diff.dat <- data.frame(embed(cbind(dy1, dy2), 2))
colnames(diff.dat) <- c('dy1', 'dy2', 'dy1.1', 'dy2.1')
ecm.reg <- lm(dy2 ~ error.lagged + dy1.1 + dy2.1, data = diff.dat)
#################################################################
# R Code 4.3 Johansn method with artificially generated data
#################################################################
library(urca)
set.seed(123456)
e1 <- rnorm(250, 0, 0.5)
e2 <- rnorm(250, 0, 0.5)
e3 <- rnorm(250, 0, 0.5)
u1.ar1 <- arima.sim(model = list(ar = 0.75), innov = e1, n = 250)
u2.ar1 <- arima.sim(model = list(ar = 0.3), innov = e2, n = 250)
y3 <- cumsum(e3)
y1 <- 0.8*y3 + u1.ar1
y2 <- -0.3*y3 + u2.ar1
y.mat <- data.frame(y1, y2, y3)
y.mat
vecm <- ca.jo(y.mat)
jo.results <- summary(vecm)
vecm.r2 <- cajorls(vecm, r = 2)
vecm.r2 <- cajorls(vecm, r = 2)
class(jo.results)
slotNames(jo.results)
#################################################################
# R Code 4.4 VECM as VAR in levels
#################################################################
library(vars)
vecm.level <- vec2var(vecm, r = 2)
arch.test(vecm.level)
normality.test(vecm.level)
serial.test(vecm.level)
predict(vecm.level)
irf(vecm.level, boot = FALSE)
fevd(vecm.level)
class(vecm.level)
methods(class = 'vec2var')
(5)Testing for the Order of Integration
单位根检验是指检验序列中是否存在单位根,因为存在单位根就是非平稳时间序列了。单位根就是指单位根过程,可以证明,序列中存在单位根过程就不平稳,会使回归分析中存在伪回归。
Dickey-FUller Test:可以测试一个自回归模型是否存在单位根(unit root)
ADF: ADF检验和迪基-福勒检验类似,但ADF检验的优点在于它透过纳入(理论上可无限多期,只要资料量容许)落后期的一阶向下差分项,排除了自相关的影响。ADF检验和迪基-福勒检验类似,但ADF检验的优点在于它透过纳入(理论上可无限多期,只要资料量容许)落后期的一阶向下差分项,排除了自相关的影响。
ADF检验在fUnitRoots,tseries,urca及uroot等包中的adftest()、adf.test()、ur.df()及ADF.test()等中已实现
###########################################################################
# R Code 5.1 ADF test:Integration for consumption in the United Kingdom
###########################################################################
library(urca)
data(Raotbl3)
attach(Raotbl3)
lc <- ts(lc, start = c(1966, 4), end = c(1991, 2), frequency = 4)
lc.ct <- ur.df(lc, lags = 3, type = 'trend')
plot(lc.ct)
lc.co <- ur.df(lc, lags = 3, type = 'drift')
lc2 <- diff(lc)
lc2.ct <- ur.df(lc2, type = 'trend', lags = 3)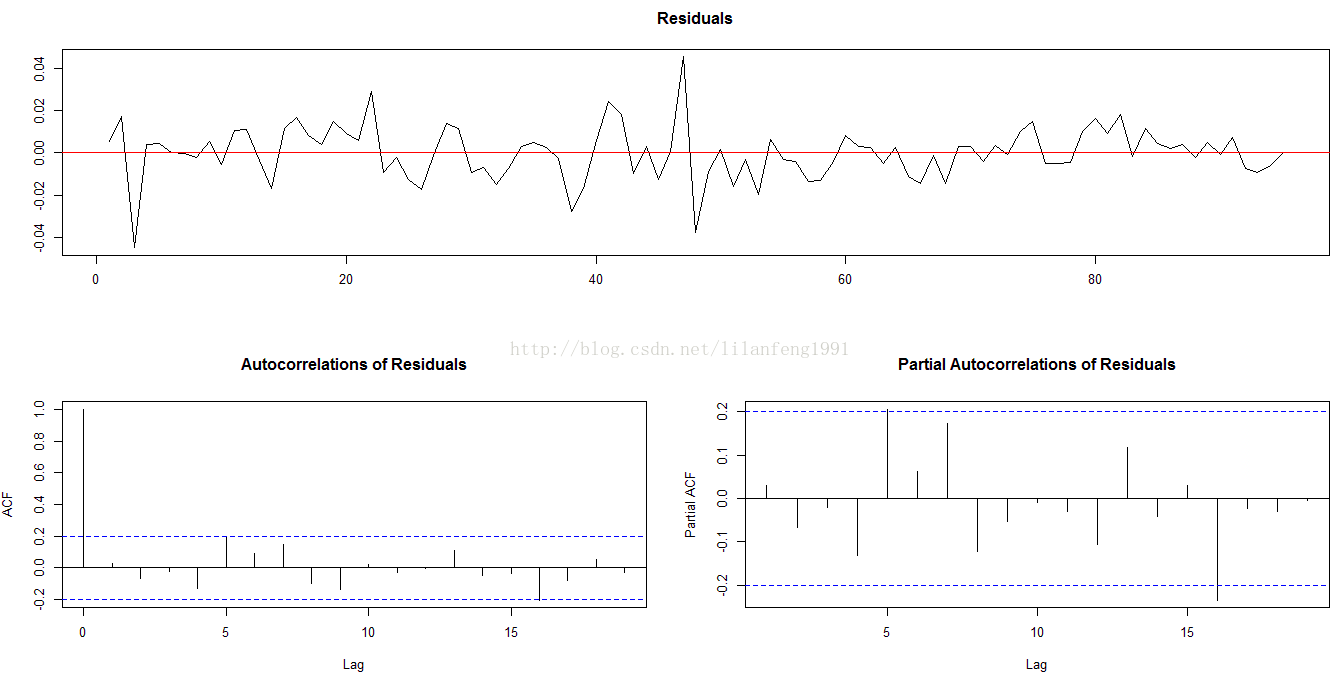
###########################################################################
# R Code 5.2 PP test:Integration for consumption in the United Kingdom
###########################################################################
library(urca)
data(Raotbl3)
attach(Raotbl3)
lc <- ts(lc, start = c(1966, 3), end = c(1991, 2), frequency = 4)
lc.ct <- ur.pp(lc, type = 'Z-tau', model = 'trend', lags = 'long')
lc.co <- ur.pp(lc, type = 'Z-tau', model = 'constant', lags = 'long')
lc2 <- diff(lc)
lc2.ct <- ur.pp(lc2, type = 'Z-tau', model = 'trend', lags = 'long')
Elliott-Rothenberg-Stock检验: 当数据的j是一个AR(1)过程,其系数接近1时,先前的两种单元根检验作用就较小。
###########################################################################
# R Code 5.3 ERS test:Integration order for real GNP in the United States
###########################################################################
library(urca)
data(nporg)
gnp <- log(na.omit(nporg[, 'gnp.r']))
gnp.d <- diff(gnp)
gnp.ct.df <- ur.ers(gnp, type = 'DF-GLS', model = 'trend', lag.max = 4)
gnp.ct.pt <- ur.ers(gnp, type = 'P-test', model = 'trend')
gnp.d.ct.df <- ur.ers(gnp.d, type = 'DF-GLS', model = 'trend', lag.max = 4)
gnp.d.ct.pt <- ur.ers(gnp.d, type = 'P-test', model = 'trend')
Schmidt-Phillips检验:在一些平稳性假设的条件下,某些参数没有定义或有不同的解释,
###########################################################################
#R Code 5.4 SP test:Integration order for nominal GNP of the United States
###########################################################################
library(urca)
data(nporg)
gnp <- na.omit(nporg[, 'gnp.n'])
gnp.tau.sp <- ur.sp(gnp, type = 'tau', pol.deg = 2, signif = 0.05)
gnp.rho.sp <- ur.sp(gnp, type = 'rho', pol.deg = 2, signif = 0.05)
Kwiatkowski-Phillips-Schmidt-Shin检验:用于trend或平稳水平的LM检验 (KPSS检验)
null hypothesis: 是一个平稳过程
alternative hypothesis:前面的假设都是一个单元格过程
###########################################################################
#R Code 5.5 KPSS test:Integration order for nominal GNP of the United States
###########################################################################
library(urca)
data(nporg)
ir <- na.omit(nporg[, 'bnd'])
wg <- log(na.omit(nporg[, ' wg.n']))
ir.kpss <- ur.kpss(ir, type = 'mu', use.lag = 8)
wg.kpss <- ur.kpss(wg, type = 'tau', use.lag = )
(6)其他
###########################################################################
#R Code 6.1 Random walk with drift and structural break
###########################################################################
set.seed(123456)
e <- rnorm(500)
##trend
trd <- 1: 500
S <- c(rep(0, 249), rep(1, 251))
##random walk with drift
y1 <- 0.1*trd + cimsum(e)
## random walk with drift and shift
y2 <- 0.1*trd + 10*S + cumsum(e)
###########################################################################
#R Code 6.2 Unit roots and structural break: Zivot-Andrews test
#Zivot and Andrews test应用于nominal及real dataSet
###########################################################################
library(urca)
data(nporg)
#head(nporg)
wg.n <- log(na.omit(nporg[, ''wg.n]))
########################################
# > length(nporg$wg.n)
# [1] 111
# > length(na.omit(nporg$wg.n))
# [1] 71
########################################
za.wg.n <- ur.za(nporg$wg.n, model = 'intercept', lag = 7)
plot(za.wg.n)
wg.r <- log(na.omit(nporg[, 'wg.r']))
###########################################################################
#R Code 6.3 HEGY test for seasonal unit roots
###########################################################################
library(urca)
install.packages('uroot')
library(uroot)
data(UKconinc)
incl <- ts(UKconinc$incl, start = c(1955, 1), end = c(1984, 4), frequency = 4)
HEGY000 <- HEGY.test(wts = incl, itsd = c(0, 0, c(0)), selectlags = list(mode = c(1, 4, 5)))
HEGY101 <- HEGY.test(wts = incl, itsd = c(1, 0, c(1, 2, 3)), selectlags = list(mode = c(1, 4, 5)))
HEGY111 <- HEGY.test(wts = incl, itsd = c(1, 1, c(1, 2, 3)), selectlags = list(mode = c(1, 4, 5)))


