ECharts2.0横向显示柱状图
// 柱状图right
HistogramR:function(HistogramData){
// 图表释放-------------------
ec.init(document.getElementById(HistogramData.id)).dispose();
// 柱状图
var orname = HistogramData.legendData
var ecHistogramR = ec.init(document.getElementById(HistogramData.id));
ecHistogramR.setOption({
tooltip : {
trigger: 'axis',
axisPointer : {type : 'line'},
show:false
},
grid:{borderWidth:0,x:'2',y:'0',x2:'0',y2:'0',},
legend: {data:[""]},
xAxis : [{type : 'value',show:false,}],
yAxis : [{
type : 'category',
axisTick:{show:false},
axisLine:{show:false,}, // y 轴线
splitLine:{show: false},//去除网格线
data :HistogramData.yAxisData,
show:'false'
}],
series : [{
name:'',
type:'bar',
barWidth : 40,
barGap:30,
itemStyle : {normal: {color:'#4ad2ff',barBorderRadius:[0, 20, 20, 0],label : {show: true, position: 'right'}},emphasis:{ barBorderColor:'rgba(0,0,0,0)',color:'rgba(0,0,0,0)'}},
data:HistogramData.seriesData
}],
noDataLoadingOption:this.noDataLoadingOption
});
},
// 柱状图left
HistogramL:function(HistogramData){
// 图表释放-------------------
ec.init(document.getElementById(HistogramData.id)).dispose();
// 柱状图
var orname = HistogramData.legendData
var ecHistogramL = ec.init(document.getElementById(HistogramData.id));
ecHistogramL.setOption({
tooltip : {
trigger: 'axis',
axisPointer : {type : 'line'},
show:false
},
grid:{borderWidth:0,x:'0',y:'0',x2:'0',y2:'0'},
legend: {data:[""]},
xAxis : [{type : 'value',inverse:'true',show:false,}],
yAxis : [{
type : 'category',
axisTick:{show:false},
axisLine:{show:false,}, // y 轴线
splitLine:{show: false},//去除网格线
data :HistogramData.yAxisData,
show:'false'
}],
series : [{
name:'',
type:'bar',
barWidth : 40,
barGap:30,
itemStyle : {normal:{color:'red',barBorderRadius:[20, 0, 0, 20],label : {show: true, position: 'left',formatter:function(v){return Math.abs(v.data)}}},emphasis:{ barBorderColor:'rgba(0,0,0,0)',color:'rgba(0,0,0,0)'}},
data:HistogramData.seriesData
}],
noDataLoadingOption:this.noDataLoadingOption
});
},
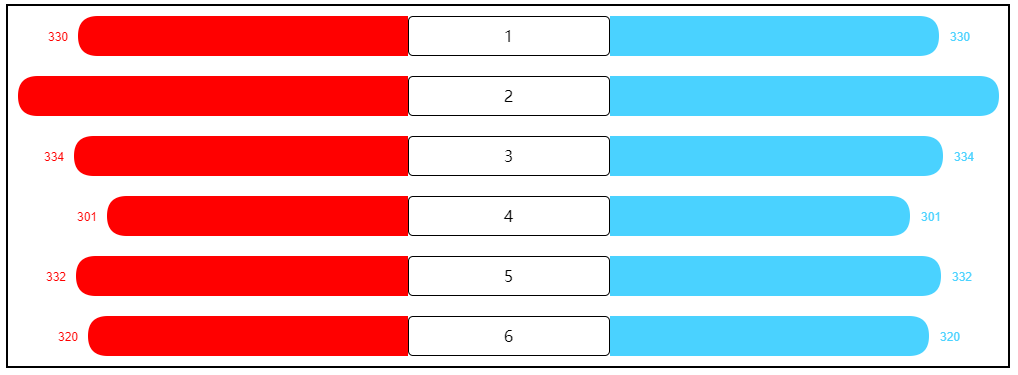
// 柱状图right
echar.HistogramR({
id:'box-two',
legendData:['宫保鸡丁','酸辣土豆丝','联盟广告','大盘鸡','小炒肉','烩面'],
yAxisData: ['1','2','3','4','5','6'],
seriesData:[320, 332, 301, 334, 390, 330,]
})
// 柱状图left
echar.HistogramL({
id:'box-one',
legendData:['宫保鸡丁','酸辣土豆丝','联盟广告','大盘鸡','小炒肉','烩面'],
yAxisData: ['1','2','3','4','5','6'],
seriesData:[-320, -332, -301, -334, -390, -330]
})