诹图系列(3): 条形图
![]()
作者:厚缊,中观经济咨询助理研究员,业余数据科学爱好者。博客:houyun.xyz
前文回顾:
诹图系列(2): 堆积条形图
诹图系列(1): 简单条形图
条形图是分类数据最简单的可视化方式,从简单到复杂有多种不同的变种,今天要学习的变种是利用图形符号表示条形,在美观上有所提高,但不是很清晰,不能一眼判断每个分类的数值是多少,这也是一种权衡,具体要结合应用场景判断是不是采用这种模式。
R语言中,用图形符号表示数据标签有两种实现模式:一种是利用rasterImage()函数在特定位置(绘图坐标)插入图片(ggplot2中可以使用grid.raster()函数);另一种是利用特殊字体标记图形符号。这篇文章主要利用特殊字体(symbol-sign)来绘制条形图。
1if(!require(magick)) install.packages('magick')
2library(magick)
3cat <- image_read('/your/path/to/fig/cat01.jpg')
4opar <- par(no.readonly = TRUE)
5par(mai = c(0.5, 0.5, 0.1, 0.1), omi = c(0.1, 0.1, 0.1, 0.1))
6plot(1:3, 1:3, type = 'n', xlab = '', ylab = '')
7rasterImage(cat, 1.5, 1.5, 2.5, 2.5, angle = 20)
8par(opar)
变形条形图
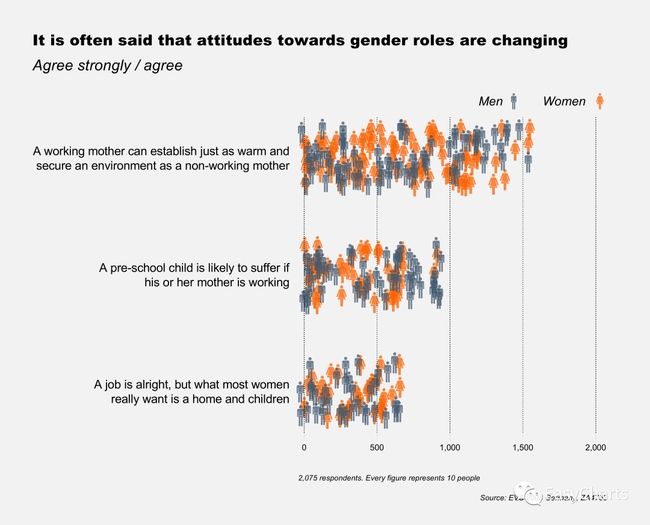
老规矩,先上效果图。图中每个人像代表10人,由于相互覆盖和随机扰动,从图中很难直观看出男性和女性分别是多少,所以从实用性讲这个图用处不大。
绘图代码
连着第三期,基础的图形设置比较熟悉了,所以从这一幅图开始,其它图形设置不会单独讲解。
 1barchart06 <- 'your/figure/path/barchart06.pdf'
 2cairo_pdf(barchart06, bg = 'grey95', width = 13, height = 10.5)
 3
 4opar <- par(no.readonly = TRUE)
 5par(
 6  omi = c(0.65, 0.65, 0.85, 0.85),
 7  mai = c(1.2, 5.2, 1.5, 0),
 8  family = "Arial",
 9  las = 1)
10col_f <- rgb(255, 97, 0, 190, maxColorValue = 255)
11col_m <- rgb(68, 90, 111, 190, maxColorValue = 255)
12
13myC_v159<-"A working mother can establish just as warm and\nsecure an environment as a non-working mother"
14myC_v160<-"A pre-school child is likely to suffer if\nhis or her mother is working"
15myC_v161<-"A job is alright, but what most women\nreally want is a home and children"
16
17# Create chart
18plot(1:5, type = "n", axes = F, xlab = "", ylab = "",
19     xlim = c(0, 20), ylim = c(1, 6))
20symbols <- function(nf, nm, y, labelling ){
21  for (i in 1:nf){
22    text(runif(1, 0, (nf + nm) / 10), runif(1, y, y + 1),
23         "F", cex = 3.25, col = col_f, family="SymbolSigns-Basisset")
24  }
25  for (i in 1:nm){
26    text(runif(1, 0, (nf + nm) / 10), runif(1, y, y + 1),
27         "M", cex = 3.25, col = col_m, family="SymbolSigns-Basisset")
28    }
29  text(-1, y + 0.5, labelling, xpd = T,cex = 1.45, adj = 1)
30}
31symbols(round(336/10),round(350/10),1,myC_v161)
32symbols(round(454/10),round(525/10),3,myC_v160)
33symbols(round(865/10),round(720/10),5,myC_v159)
34axis(1, at = c(0, 5, 10, 15, 20),
35     labels = c("0", "500", "1,000", "1,500", "2,000"),
36     col = par("bg"), col.ticks = "grey81",
37     lwd.ticks = 0.5, tck = -0.025)
38# Other elements
39abline(v = c(0, 5, 10, 15, 20), lty = "dotted")
40# Titling
41mtext("It is often said that attitudes towards gender roles are changing",
42      3, line = -0.5, adj = 0,cex = 1.8,
43      family = "Arial Black", outer = T)
44mtext("Agree strongly / agree", 3, line = -3, adj = 0,
45      cex = 1.8, outer = T, font = 3)
46mtext("Source: EVS 2008 Germany, ZA4753", 1,
47      line = 0, adj = 1, cex = 0.9, outer = T, font = 3)
48mtext("2,075 respondents. Every figure represents 10 people ",
49      1, line = -2, adj = 0.68, cex = 0.9, outer = T, font = 3)
50mtext("Women", 3, line = 1, adj = 0.92, cex = 1.5, font = 3)
51mtext("Men", 3, line = 1, adj = 0.64, cex = 1.5, font = 3)
52mtext("F", 3, line = 0.6, adj = 1, cex = 2.5, font = 3,
53      col = col_f, family="SymbolSigns-Basisset")
54mtext("M", 3, line = 0.6, adj = 0.72, cex = 2.5, font = 3,
55      col = col_m, family="SymbolSigns-Basisset")
56dev.off()
57par(opar)
58
核心代码块解释
这段代码思路比较简单,首先用plot()函数绘制一个空的图形盒子,主要目的是利用图形盒子的参考坐标系添加图形符号;其次是用text()函数向图形盒子中添加文本;最后调用axis()函数手动添加坐标轴。
plot()函数中type = "n"表示不绘制数据标记;axes = FALSE, xlab = "", ylab = ""表示不绘制坐标轴和坐标轴标签;ylim = c(1, 6)主要是方便后面绘制三个条形图。定义一个
symbols()函数来添加图形标签,这里有几个细节需要注意:
原数据是Agree strongly/ agree的人数,在比较狭窄的范围不可能绘制几百个数据点,因此第一步需要把原数据缩放到图形盒子的范围内。男性和女性的值相加最大的是1585,接近于2000,即原数据缩放到0-20的坐标轴上需要缩小100倍,即
text()函数中的(nf + nm) / 100);图形符号X轴在0到男性和女性总人数之间,每个标签均在该区间内取均匀随机数,Y轴在c(1, 2), c(3, 4), c(5, 6)之间取均匀随机数;
文本字体设置为SymbolSigns-Basisset(电脑没有自带该字体,需要的去链接地址下载安装),其中M表示男性图形符号,F表示女性图形符号
 1# Create chart
 2plot(1:5, type = "n", axes = FALSE, xlab = "", ylab = "",
 3     xlim = c(0, 20), ylim = c(1, 6))
 4symbols <- function(nf, nm, y, labelling ){
 5  for (i in 1:nf){
 6    text(runif(1, 0, (nf + nm) / 100), runif(1, y, y + 1),
 7         "F", cex = 3.25, col = col_f, family="SymbolSigns-Basisset")
 8  }
 9  for (i in 1:nm){
10    text(runif(1, 0, (nf + nm) / 100), runif(1, y, y + 1),
11         "M", cex = 3.25, col = col_m, family="SymbolSigns-Basisset")
12    }
13  text(-1, y + 0.5, labelling, xpd = TRUE,cex = 1.45, adj = 1)
14}
15symbols(round(336), round(350), 1, myC_v161)
16symbols(round(454), round(525), 3, myC_v160)
17symbols(round(865), round(720), 5, myC_v159)
18axis(1, at = c(0, 5, 10, 15, 20),
19     labels = c("0", "500", "1,000", "1,500", "2,000"),
20     col = par("bg"), col.ticks = "grey81",
21     lwd.ticks = 0.5, tck = -0.025)
改进版本
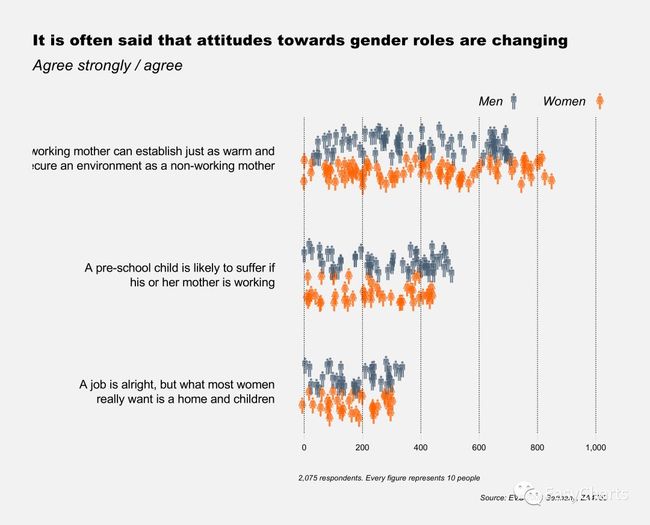
上图男女图形符号相互叠加,不能直观判断男性、女性是否存在差异,这里利用并排排列条形图的思路做了一点改进。
1barchart07 <- 'your/figure/path/barchart07.pdf'cairo_pdf(barchart07, bg = 'grey90', width = 13, height = 10.5)opar <- par(no.readonly = TRUE)par( omi = c(0.65, 0.65, 0.85, 0.85), mai = c(1.2, 5.2, 1.5, 0), family = "Arial", las = 1)col_f <- rgb(255, 97, 0, 190, maxColorValue = 255) col_m <- rgb(68, 90, 111, 190, maxColorValue = 255)myC_v159<-"A working mother can establish just as warm and\nsecure an environment as a non-working mother"myC_v160<-"A pre-school child is likely to suffer if\nhis or her mother is working"myC_v161<-"A job is alright, but what most women\nreally want is a home and children"# Create chartplot(1:5, type = "n", axes = F, xlab = "", ylab = "", xlim = c(0, 10), ylim = c(1, 6))symbols <- function(nf, nm, y, labelling, ... ){ for (i in 1:nf){ text(runif(1, 0, nf / 100), runif(1, y, y + 0.5), "F", cex = 2.5, col = col_f, family="SymbolSigns-Basisset") } for (i in 1:nm){ text(runif(1, 0, nm / 100), runif(1, y + 0.5, y + 1), "M", cex = 2.5, col = col_m, family="SymbolSigns-Basisset") } text(-1, y + 0.5, labelling, xpd = T,cex = 1.45, adj = 1)}symbols(round(336), round(350), 1, myC_v161) symbols(round(454), round(525), 3, myC_v160) symbols(round(865), round(720), 5, myC_v159) axis(1, at = c(0, 2, 4, 6, 8, 10), labels = c("0", "200", "400", "600", "800", '1,000'), col = par("bg"), col.ticks = "grey81", lwd.ticks = 0.5, tck = -0.025)# Other elementsabline(v = c(0, 2, 4, 6, 8, 10), lty = "dotted")# Titlingmtext("It is often said that attitudes towards gender roles are changing", 3, line = -0.5, adj = 0,cex = 1.8, family = "Arial Black", outer = TRUE)mtext("Agree strongly / agree", 3, line = -3, adj = 0, cex = 1.8, outer = TRUE, font = 3)mtext("Source: EVS 2008 Germany, ZA4753", 1, line = 0, adj = 1, cex = 0.9, outer = TRUE, font = 3)mtext("2,075 respondents. Every figure represents 10 people ", 1, line = -2, adj = 0.68, cex = 0.9, outer = TRUE, font = 3)mtext("Women", 3, line = 1, adj = 0.92, cex = 1.5, font = 3)mtext("Men", 3, line = 1, adj = 0.64, cex = 1.5, font = 3)mtext("F", 3, line = 0.6, adj = 1, cex = 2.5, font = 3, col = col_f, family="SymbolSigns-Basisset")mtext("M", 3, line = 0.6, adj = 0.72, cex = 2.5, font = 3, col = col_m, family="SymbolSigns-Basisset")dev.off()par(opar)
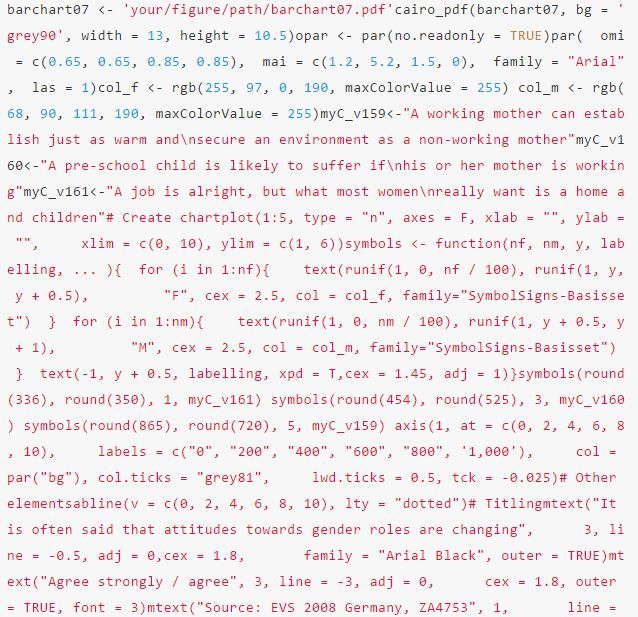
改进版本详细代码:
——————————————
往期精彩:
精选| 2019年2月R新包推荐
shinydashboard与shiny_史上最全(三)
你不理解苏大强的作,AI 能吗?
R语言中文社区2018年终文章整理(作者篇)
R语言中文社区2018年终文章整理(类型篇)


