DataCamp “Data Scientist with Python track” 第八章 pandas Foundations 学习笔记
Review of pandas DataFrame
在这一节中我们重新回到了pandas package的学习,除了在之前提到过的一些命令以外(比如slice命令“.loc[]”),在下面这道题中还是用了新的values命令,注意这里values后面不加括号,此外注意log10的用法:
# Import numpy
import numpy as np

# Create array of DataFrame values: np_vals
np_vals = df.values

# Create new array of base 10 logarithm values: np_vals_log10
np_vals_log10 = np.log10(np_vals)

# Create array of new DataFrame by passing df to np.log10(): df_log10
df_log10 = np.log10(df)

# Print original and new data containers
[print(x, 'has type', type(eval(x))) for x in ['np_vals', 'np_vals_log10', 'df', 'df_log10']]
Importing & exporting data
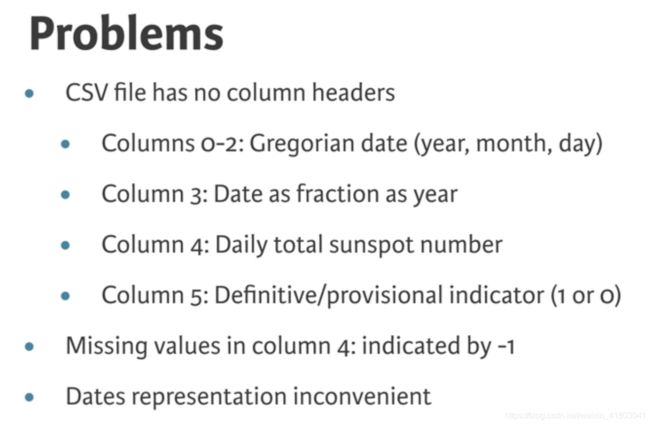
在数据中我们常用到csv文件,但是基础的csv文件通常有如下问题:
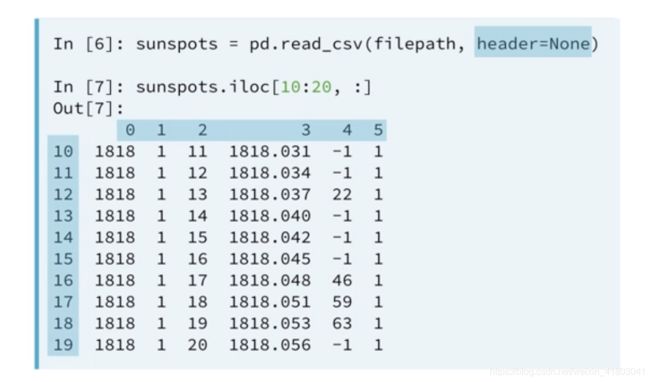
可以在pd.read_csv()中添加argument:header=None来使得行列上拥有从index0开始的title,如图所示:
同样我们还可以使用names keyword:“names=col_names”,这样我们之前单独定义的col_names就可以使用了。
# Read the raw file as-is: df1
df1 = pd.read_csv(file_messy)

# Print the output of df1.head()
print(df1.head())

# Read in the file with the correct parameters: df2
df2 = pd.read_csv(file_messy, delimiter=' ', header=3, comment='#')

# Print the output of df2.head()
print(df2.head())

# Save the cleaned up DataFrame to a CSV file without the index
df2.to_csv(file_clean, index=False)

# Save the cleaned up DataFrame to an excel file without the index
df2.to_excel('file_clean.xlsx', index=False)
Visual exploratory data analysis
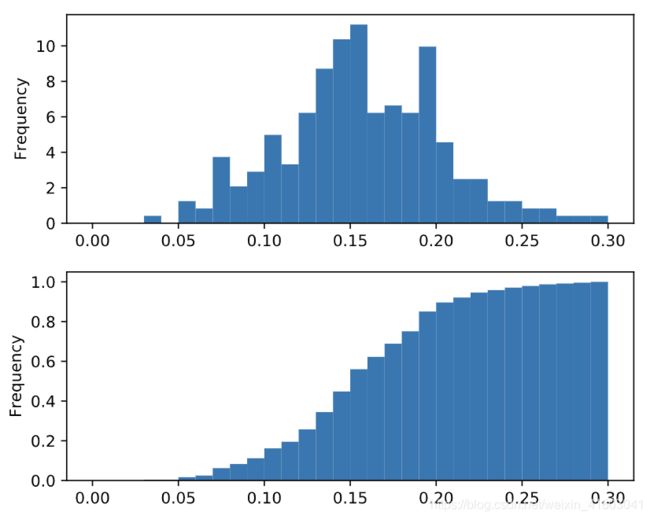
这一节主要讲了几种将数据plot的方法,并且引到了绘制PDF和CDF的图的方法,并且提到了如何将生成的图像进行保存的方法。其中对于PDF和CDF部分,要注意几个argument的写法:
# This formats the plots such that they appear on separate rows
fig, axes = plt.subplots(nrows=2, ncols=1)

# Plot the PDF
df.fraction.plot(ax=axes[0], kind='hist', normed=True, bins=30, range=(0,.3))
plt.show()

# Plot the CDF
df.fraction.plot(ax=axes[1], kind='hist', normed=True, bins=30, cumulative=True, range=(0,.3))
plt.show()
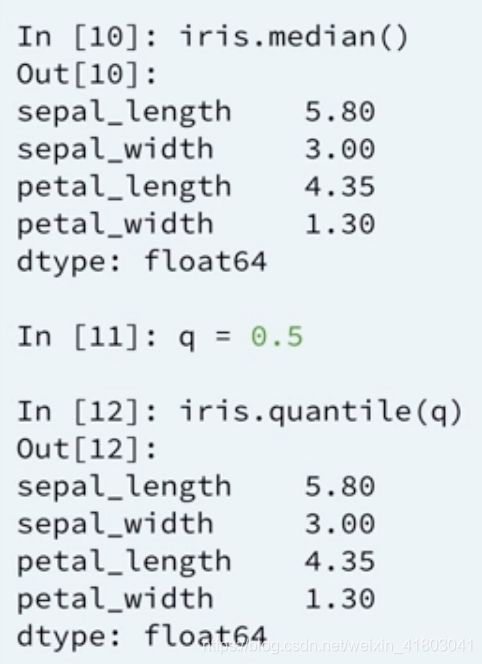
接下来从.describe()引到了很多将数据分类分层的方法,“.quantile()”就是其中之一,按照我们定义的range进行分类:
下面是一道有关泰坦尼克的题目,要求我们将不同等级舱室的乘客的票价用box plot画出来,这里用到了filter的知识点,以及如何画subplots:
# Display the box plots on 3 separate rows and 1 column
fig, axes = plt.subplots(nrows=3, ncols=1)

# Generate a box plot of the fare prices for the First passenger class
titanic.loc[titanic['pclass'] == 1].plot(ax=axes[0], y='fare', kind='box')

# Generate a box plot of the fare prices for the Second passenger class
titanic.loc[titanic['pclass'] == 2].plot(ax=axes[1], y='fare', kind='box')

# Generate a box plot of the fare prices for the Third passenger class
titanic.loc[titanic['pclass'] == 3].plot(ax=axes[2], y='fare', kind='box')

# Display the plot
plt.show()
Reading and slicing times
For this exercise, we have read in the same data file using three different approaches,从而帮助我们通过对应的时间来寻找特定数据(df3):
-
df1 = pd.read_csv(filename) -
df2 = pd.read_csv(filename, parse_dates=['Date']) -
df3 = pd.read_csv(filename, index_col='Date', parse_dates=True
在对数据进行时间操作时,我们可以使用如下命令:
If passed the list of strings ['2015-01-01 091234','2015-01-01 091234']and a format specification variable, such as format='%Y-%m-%d %H%M%S, pandas will parse the string into the proper datetime elements and build the datetime objects.
# Prepare a format string: time_format
time_format = '%Y-%m-%d %H:%M'

# Convert date_list into a datetime object: my_datetimes
my_datetimes = pd.to_datetime(date_list, format=time_format)

# Construct a pandas Series using temperature_list and my_datetimes: time_series
time_series = pd.Series(temperature_list, index=my_datetimes)
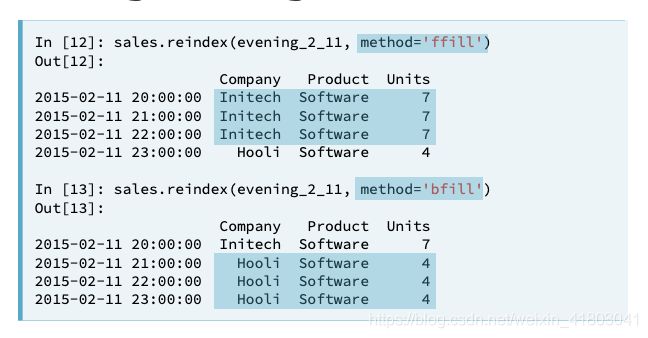
Reindexing is useful in preparation for adding or otherwise combining two time series data sets. To reindex the data, we provide a new index and ask pandas to try and match the old data to the new index. If data is unavailable for one of the new index dates or times, you must tell pandas how to fill it in. Otherwise, pandas will fill with NaN by default.
在和时间有关的数据中,我们可以应用resample命令来提取或者过滤数据,而对于时间的resample在pandas中早就定义好了argument(我们要注意W是从Sunday开始的):
Use .rolling() with a 24 hour window to smooth the mean temperature data. For example, with a Series hourly_data:
hourly_data.rolling(window=24).mean()would compute new values for each hourly point, based on a 24-hour window stretching out behind each point. The frequency of the output data is the same: it is still hourly. (在后面的例子中我们的数据是以天为单位resample的,所以frequency就会变成daily)Such an operation is useful for smoothing time series data.
# Extract data from 2010-Aug-01 to 2010-Aug-15: unsmoothed
unsmoothed = df['Temperature']['2010-Aug-01':'2010-Aug-15']

# Apply a rolling mean with a 24 hour window: smoothed
smoothed = unsmoothed.rolling(window=24).mean()

# Create a new DataFrame with columns smoothed and unsmoothed: august
august = pd.DataFrame({'smoothed':smoothed, 'unsmoothed':unsmoothed})

# Plot both smoothed and unsmoothed data using august.plot().
august.plot()
plt.show()
Manipulating pandas time series
在pandas中还可以有其他的数据搜索方法,下面就提到了“.str.contains() ”字符搜索的方法:
# Strip extra whitespace from the column names: df.columns
df.columns = df.columns.str.strip(' ')

# Extract data for which the destination airport is Dallas: dallas
dallas = df['Destination Airport'].str.contains('DAL')

# Compute the total number of Dallas departures each day: daily_departures
daily_departures = dallas.resample('D').sum()

# Generate the summary statistics for daily Dallas departures: stats
stats = daily_departures.describe()
如果十年中的数据为NaN,但是又想补全这十年的数据从而使得曲线更smooth和连贯,我们可以使用“.interpolate()”命令:
# Reset the index of ts2 to ts1, and then use linear interpolation to fill in the NaNs: ts2_interp
ts2_interp = ts2.reindex(ts1.index).interpolate(how='linear')
对时间的处理中还包括复杂的时区转换,这里要多下功夫,因为我本来就对时区理解不好,下面的例子计算了从LAX机场起飞时间的时区转换:
- Use
Series.dt.tz_localize()to localize the time to'US/Central'. - Use the
.dt.tz_convert()method to convert datetimes from'US/Central'to'US/Pacific'.
# Build a Boolean mask to filter out all the 'LAX' departure flights: mask
mask = df['Destination Airport'] == 'LAX'

# Use the mask to subset the data: la
la = df[mask]

# Combine two columns of data to create a datetime series: times_tz_none
times_tz_none = pd.to_datetime( la['Date (MM/DD/YYYY)'] + ' ' + la['Wheels-off Time'] )

# Localize the time to US/Central: times_tz_central
times_tz_central = times_tz_none.dt.tz_localize('US/Central')

# Convert the datetimes from US/Central to US/Pacific
times_tz_pacific = times_tz_central.dt.tz_convert('US/Pacific')
Visualizing pandas time series
在这一节中解决了一个我之前的疑惑,有关画图plot的style format string的问题:
Case Study - Sunlight in Austin
在case study中有一步是cleaning和tidying数据,集中用到了一些命令比如“.astype()”、“pd.to_datetime()”等等,这里着重记录一下,有一步卡了我一会儿,我还努力回忆了“.concat()”,后来发现直接+就可以了:
# Convert the date column to string: df_dropped['date']
df_dropped['date'] = df_dropped['date'].astype(str)

# Pad leading zeros to the Time column: df_dropped['Time']
df_dropped['Time'] = df_dropped['Time'].apply(lambda x:'{:0>4}'.format(x))

# Concatenate the new date and Time columns: date_string
date_string = df_dropped['date'] + df_dropped['Time']

# Convert the date_string Series to datetime: date_times
date_times = pd.to_datetime(date_string, format='%Y%m%d%H%M')

# Set the index to be the new date_times container: df_clean
df_clean = df_dropped.set_index(date_times)

# Print the output of df_clean.head()
print(df_clean.head())
这里有些记不起来了:
“reset_index可以还原索引,从新变为默认的整型索引
DataFrame.reset_index(level=None, drop=False, inplace=False, col_level=0, col_fill=”)
level控制了具体要还原的那个等级的索引
drop为False则索引列会被还原为普通列,否则会丢失”
Extract the 'Temperature' column from daily_climate using the .reset_index() method. To do this, first reset the index of daily_climate, and then use bracket slicing to access 'Temperature':
# Extract the Temperature column from daily_climate using .reset_index(): daily_temp_climate
daily_temp_climate = daily_climate.reset_index()['Temperature']
下面这道题也是错误较多的一道题,注意里面“.loc[]”的用法,以及绘制CDF图的命令写法,尤其是后面的arguments:
# Extract the maximum temperature in August 2010 from df_climate: august_max
august_max = df_climate.loc['2010-Aug', 'Temperature'].max()
print(august_max)

# Resample August 2011 temps in df_clean by day & aggregate the max value: august_2011
august_2011 = df_clean.loc['2011-Aug', 'dry_bulb_faren'].resample('D').max()

# Filter for days in august_2011 where the value exceeds august_max: august_2011_high
august_2011_high = august_2011.loc[august_2011 > august_max]

# Construct a CDF of august_2011_high
august_2011_high.plot(kind='hist', bins=25, normed=True, cumulative=True)

# Display the plot
plt.show()
Congratulations!
