龙格-库塔(Runge-Kutta)方法求解Mackey–Glass混沌时间序列
龙格-库塔(Runge-Kutta)方法求解Mackey–Glass混沌时间序列
Fuzzy Logic: Mackey–Glass Chaotic Time Series & Runge-Kutta Method & MATLAB
piccolo的个人笔记,是近期遇到的东西,整理一下
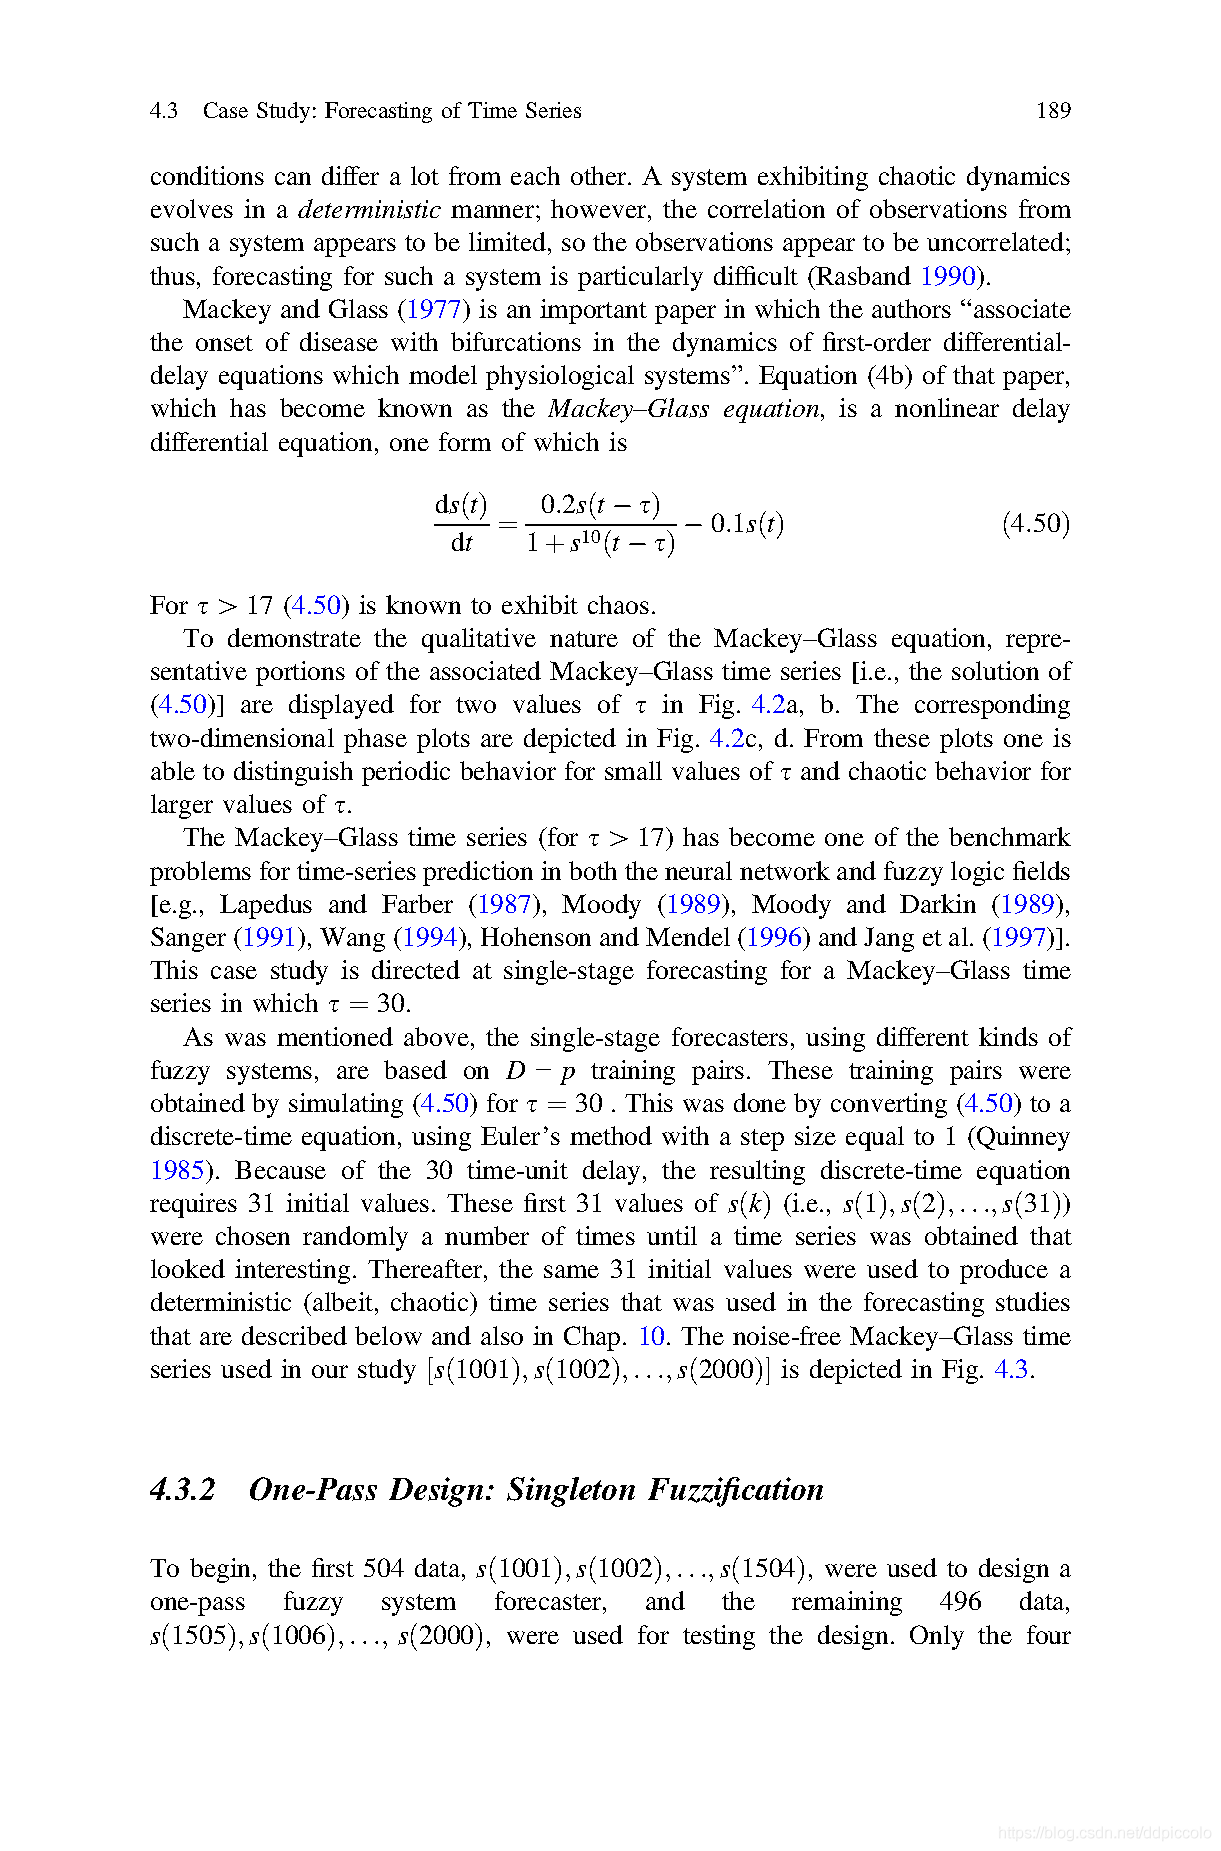
Mackey and Glass(1977)是一篇重要的论文,作者将疾病的发生与建立生理系统模型的一级微分时滞动力学方程的分叉联系起来。该方程为非线性时滞微分方程,其中一种形式如下:
Mackey-Glass (MG)时滞微分方程: d s ( t ) d t = 0.2 s ( t − τ ) 1 + s 10 ( t − τ ) − 0.1 s ( t ) \frac{\mathrm{d} s(t)}{\mathrm{d} t}=\frac{0.2 s(t-\tau)}{1+s^{10}(t-\tau)}-0.1 s(t) dtds(t)=1+s10(t−τ)0.2s(t−τ)−0.1s(t)
当 τ > 17 \tau>17 τ>17时,整个序列是混沌的,无周期,且不收敛/发散。
目前来说,Mackey-Glass时间序列是神经网络和模糊逻辑中时间序列预测的基准问题之一
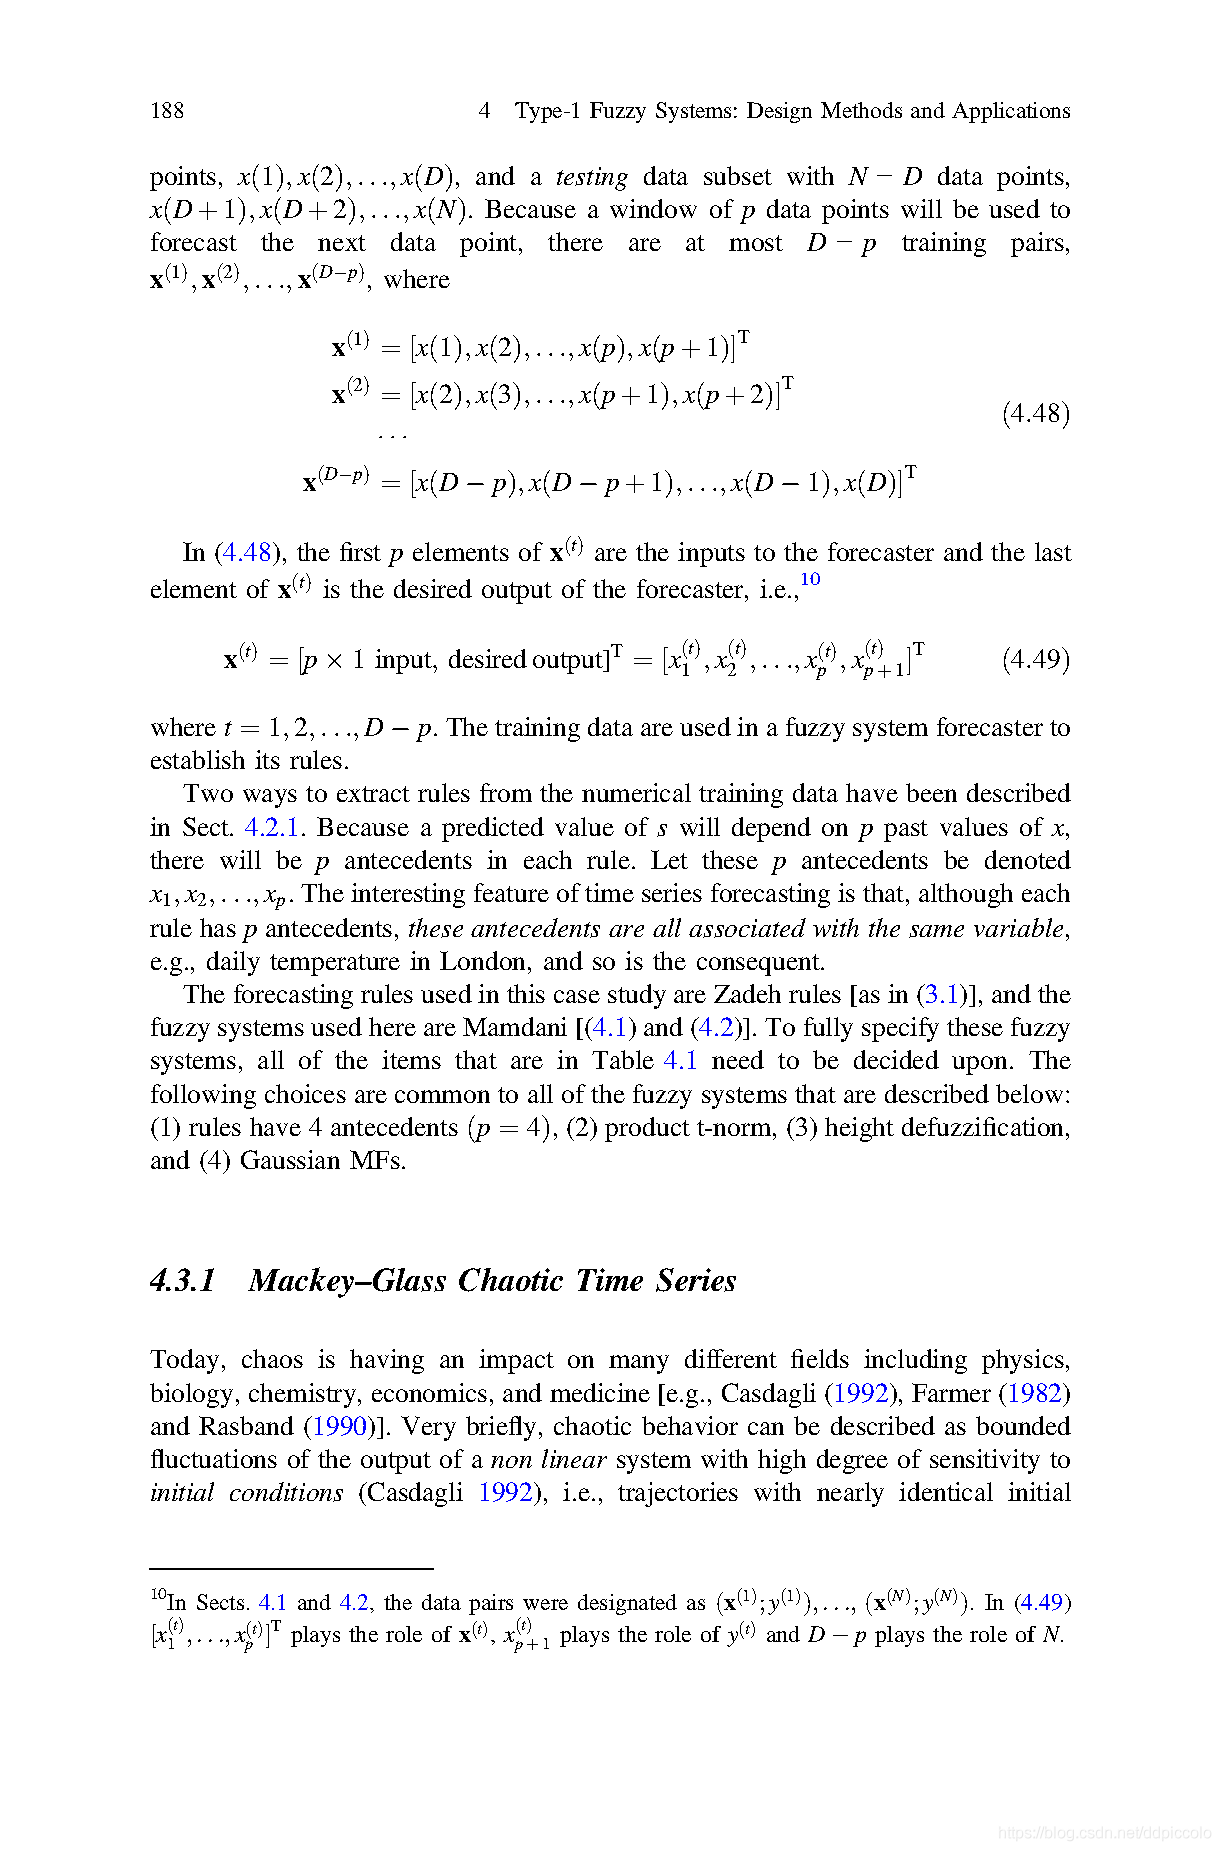
参考文献:Uncertain Rule Based Fuzzy System /4.3(可见附录)
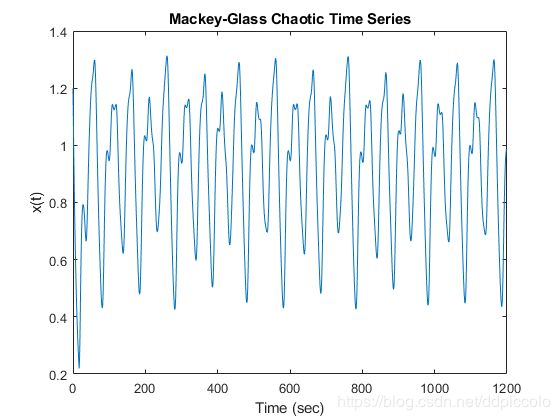
matlab中关于时间序列的例子
Predict Chaotic Time-Series using ANFIS
load mgdata.dat
time = mgdata(:,1);
x = mgdata(:, 2);
figure(1)
plot(time,x)
title('Mackey-Glass Chaotic Time Series')
xlabel('Time (sec)')
ylabel('x(t)')
运行结果:
在实际计算中,四阶Runge-Kutta方法常用于求解Mackey–Glass时间序列数值解
Runge-Kutta方法可参考龙格-库塔(Runge-Kutta)方法数学原理及实现
龙格-库塔(Runge-Kutta)方法求解的MATLAB实现
函数定义Df(x)
function y=Df(x)
%此函数用于构造麦克-格拉斯(Mackey-Glass)混沌延迟微分方程的形式
a=0.2;
y=a*x/(1+x^10);
end
函数定义 Mackey_Glass(N,tau)
function [x,t]=Mackey_Glass(N,tau)
% 麦克-格拉斯(Mackey-Glass)混沌延迟微分方程
% x为序列返回值,t为时间返回值,h为时隙间隔,N为点数
t=zeros(N,1);
x=zeros(N,1);
x(1)=1.2; t(1)=0;
a=0.2;b=0.1;h=0.1;
for k=1:N-1
  t(k+1)=t(k)+h;
  if t(k)
先简单测试一下
tao=15;
Dt=tao;
N=2000;
[y,t]=Mackey_Glass(N,tao1);
subplot(1,2,1)% 序列直出
plot(t,y,'LineWidth',1.0);
subplot(1,2,2)% 相图时差
plot(y((Dt*10+1):end),y(1:end-10*Dt),'LineWidth',0.5);
测试结果
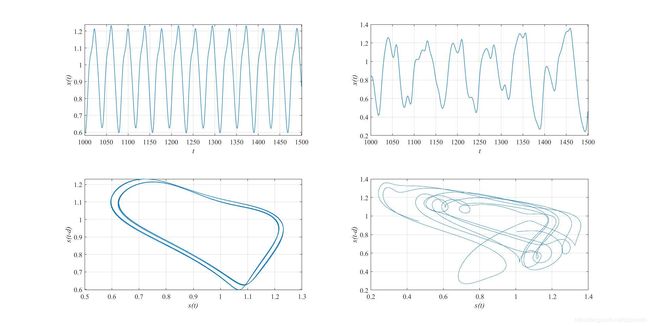
下面是生成0-2000s内的Mackey_Glass序列, τ \tau τ分别取不同的值 ( 13 , 30 ) (13,30) (13,30),并做出相应相位时差
clear,clc;
tao1=13;
tao2=30;
N=20000;%时隙为0.1,所以为0-2000s内的时间序列
[y1,t1]=Mackey_Glass(N,tao1);
[y2,t2]=Mackey_Glass(N,tao2);

figure(1)

% tao1  plot 1000-1500s之间的Mackey_Glass序列
subplot(2,2,1)
plot(t1(10000:15000),y1(10000:15000),'LineWidth',1.0);
xlabel('t')
xlabel('t','fontsize',20,'fontname','times?new?roman','FontAngle','italic');
ylabel('x(t)','fontsize',20,'fontname','times?new?roman','FontAngle','italic');
axis([1000 1501 0.58 1.24])
set(gca,'FontName','Times New Roman','FontSize',15);
grid on

% tao2  plot 1000-1500s之间的Mackey_Glass序列
subplot(2,2,2)
plot(t2(10000:15000),y2(10000:15000),'LineWidth',1.0);
xlabel('t')
xlabel('t','fontsize',20,'fontname','times?new?roman','FontAngle','italic');
ylabel('x(t)','fontsize',20,'fontname','times?new?roman','FontAngle','italic');
axis([1000 1501 0.2 1.4])
set(gca,'FontName','Times New Roman','FontSize',15);
grid on

% tao1相图时差
subplot(2,2,3)
Dt=tao1;
y11=y1(10000:15000);
plot(y11((Dt*10+1):end),y11(1:end-10*Dt),'LineWidth',0.5);
xlabel('s(t)','fontsize',20,'fontname','times?new?roman','FontAngle','italic');
ylabel('s(t-d)','fontsize',20,'fontname','times?new?roman','FontAngle','italic');
set(gca,'FontName','Times New Roman','FontSize',15);
grid on

% tao2相图时差
subplot(2,2,4)
Dt=tao2;
y22=y2(10000:15000);
plot(y22((Dt*10+1):end),y22(1:end-10*Dt),'LineWidth',0.5);
xlabel('s(t)','fontsize',20,'fontname','times?new?roman','FontAngle','italic');
ylabel('s(t-d)','fontsize',20,'fontname','times?new?roman','FontAngle','italic');
set(gca,'FontName','Times New Roman','FontSize',15);
grid on

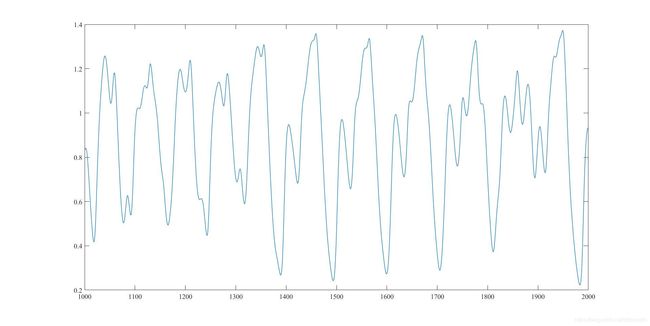
%plot tao2 1000-2000s之间的Mackey_Glass序列
figure(2)
plot(t2(10000:20000),y2(10000:20000),'LineWidth',1.0);
set(gca,'FontName','Times New Roman','FontSize',15);
运行结果:
figure(1)
