RANSAC随机抽样一致学习笔记(一)
参考:1.http://en.wikipedia.org/wiki/ransac 2.整理记录
一、RANSAC介绍
- 简介
随机抽样一致算法(RANdom SAmple Consensus,RANSAC),采用迭代的方式从一组包含离群的被观测数据中估算出数学模型的参数。该算法最早由Fischler和Bolles于1981年提出。RANSAC算法假设数据中包含正确数据和异常数据(或称为噪声)。正确数据记为内点(inliers),异常数据记为外点(outliers)。算法核心思想就是随机性和假设性。
- RANSAC的基本假设:
- 内点(inliers)数据的分布可以用一些模型参数来解释,而外点(outliers)数据是不能适应该模型的数据;
- 外点(outliers)数据属于噪声。外点(outliers)产生的原因有:噪声的极值;错误的测量方法;对数据的错误假设。
- 给定一组(通常很小的)内点(inliers),存在一个可以估计模型参数的过程;而该模型能够解释或者适用于内点(inliers)。
二、算法基本思想
- 伪代码(来自wikipedia)
Given:

data – a set of observations

model – a model to explain observed data points

n – minimum number of data points required to estimate model parameters

k – maximum number of iterations allowed in the algorithm

t – threshold value to determine data points that are fit well by model

d – number of close data points required to assert that a model fits well to data

Return:

bestfit – model parameters which best fit the data (or nul if no good model is found)

iterations = 0

bestfit = nul

besterr = something really large

while iterations < k {

maybeinliers = n randomly selected values from data

maybemodel = model parameters fitted to maybeinliers

alsoinliers = empty set

for every point in data not in maybeinliers {

if point fits maybemodel with an error smaller than t

add point to alsoinliers

}

if the number of elements in alsoinliers is > d {

% this implies that we may have found a good model

% now test how good it is

bettermodel = model parameters fitted to all points in maybeinliers and alsoinliers

thiserr = a measure of how well bettermodel fits these points

if thiserr < besterr {

bestfit = bettermodel

besterr = thiserr

}

}

increment iterations

}

return bestfit
- 通过简化算法实例对算法基本思想进行描述:
(1)随机选择两个点。

(2)通过两点,确定模型方程y=ax+b。

(3)我们将所有的数据点套到这个模型中计算误差。
(4)找到所有满足误差阈值的点,图中可以看到,只有很少的点符合这个模型。
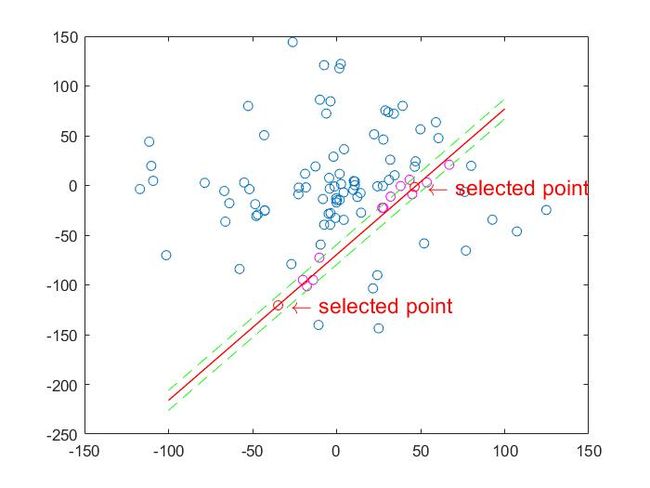
(5)然后再重复(1)~(4)这个过程,直到达到一定迭代次数后,我们选出那个支持点最多的模型,作为问题的解。如下图所示:

- 存在的问题
这个RANSAC的简化版,只是给定迭代次数,迭代结束找出最优。如果样本个数非常多的情况下,难不成一直迭代下去?其实RANSAC忽略了几个问题:
- 每一次随机样本数Nums的选取:如二次曲线最少需要3个点确定,一般来说,Nums少一些易得出较优结果;
- 抽样迭代次数Iter的选取:即重复多少次抽取,就认为是符合要求从而停止运算?太多计算量大,太少性能可能不够理想;
- 容差Sigma的选取:sigma取大取小,对最终结果影响较大;
- 与最小二乘法的比较
虽然数据集中外点和内点的比例几乎相等,但是RANSAC算法还是能找到最合适的解。
%文件:RANSAC_leastSquareMethod_compare.m
clc;clear all;close all;

set(0,'defaultfigurecolor','w');
%% Generate data
param = [5 5];
npa = length(param);
x = -20:20;
y = param*[x; ones(1,length(x))]+3*randn(1,length(x));
data = [x randi([-10,10],1,30);y randi([1,150],1,30)];

%% Plot
figure
plot(data(1,:),data(2,:),'k*');hold on;

%% Ordinary least square method
p = polyfit(data(1,:),data(2,:),npa-1);
flms = polyval(p,x);

%% Ransac
Iter = 100;
sigma = 1;
Nums = 2;%number select
threshDist=0.1;
inlierRatio=0.1;

[bestParameter1,bestParameter2] = RANSAC_2DLineFitting(data,Nums,Iter,threshDist,inlierRatio);
number = size(data,2);
xAxis = -20:20;
yAxis = bestParameter1*xAxis + bestParameter2;
%% Plot
plot(x,flms,'r','linewidth',2);hold on;
plot(xAxis,yAxis,'b-','LineWidth',2);
title('RANSAC and least square method');
legend('random data','least square method','RANSAC')
%文件:RANSAC_2DLineFitting.m
% from: http://en.wikipedia.org/wiki/ransac>

function [bestParameter1,bestParameter2] = RANSAC_2DLineFitting(data,num,iter,threshDist,inlierRatio)
 % data: a 2xn dataset with #n data points
 % num: the minimum number of points. For line fitting problem, num=2
 % iter: the number of iterations
 % threshDist: the threshold of the distances between points and the fitting line
 % inlierRatio: the threshold of the number of inliers

 %set(gcf,'outerposition',get(0,'screensize'));
 number = size(data,2); % Total number of points
 bestInNum = 0; % Best fitting line with largest number of inliers
 bestParameter1=0;bestParameter2=0; % parameters for best fitting line
 for i=1:iter
 %% Randomly select 2 points
     idx = randperm(number,num); sample = data(:,idx);
 %% Compute the distances between all points with the fitting line
     kLine = sample(:,2)-sample(:,1);% two points relative distance
     kLineNorm = kLine/norm(kLine);
     normVector = [-kLineNorm(2),kLineNorm(1)];%Ax+By+C=0 A=-kLineNorm(2),B=kLineNorm(1)
     distance = normVector*(data - repmat(sample(:,1),1,number));
 %% Compute the inliers with distances smaller than the threshold
     inlierIdx = find(abs(distance)<=threshDist);
     inlierNum = length(inlierIdx);

 %% Update the number of inliers and fitting model if better model is found
     if inlierNum>=round(inlierRatio*number) && inlierNum>bestInNum
         bestInNum = inlierNum;
         parameter1 = (sample(2,2)-sample(2,1))/(sample(1,2)-sample(1,1));
         parameter2 = sample(2,1)-parameter1*sample(1,1);
         bestParameter1=parameter1; bestParameter2=parameter2;
     end
end
 %% Plot the best fitting line
%  figure;plot(data(1,:),data(2,:),'o');hold on;
% %  set(gcf,'outerposition',get(0,'screensize'));
%  xAxis = -number/2:number/2;
%  yAxis = bestParameter1*xAxis + bestParameter2;
%  plot(xAxis,yAxis,'r-','LineWidth',2);
end
最小二乘法是一个将外点参与讨论的代价优化问题,而RANSAC是一个使用内点进行优化的问题。经实验验证,对于包含80%误差的数据集,RANSAC的效果远优于直接的最小二乘法。
三、RANSAC的数学推导
我们假设内点在整个数据集中的概率为t,即:

确定该问题的模型需要n个点,这个n是根据问题而定义的,例如拟合直线时n为2,平面拟合时n=3,求解点云之间的刚性变换矩阵时n=3,求解图像之间的射影变换矩阵是n=4,等等。k表示迭代次数,即随机选取n个点计算模型的次数。P为在这些参数下得到正确解的概率。为方便表示,我们可以得到,n个点都是内点的概率为t^n,则n个点中至少有一个是外点的概率为
![]()
(1 − w^n)^k表示k次随机抽样中都没有找到一次全是内点的情况,这个时候得到的是错误解,也就是:

内点概率t是一个先验值,可以给出一些鲁棒的值。同时也可以看出,即使t给的过于乐观,也可以通过增加迭代次数k,来保证正确解的概率P。同样的,我们可以通过上面式子计算出来迭代次数k,即我们假设需要正确概率为P(例如我们需要99%的概率取到正确解),则:

这个结果假设n个点都是独立。