python opencv histogram_直方图
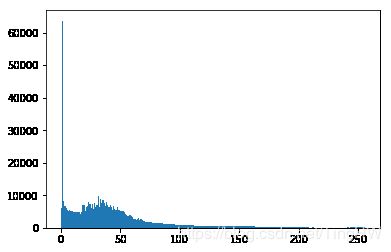
histogram给出图像的密度分布的总体概念,它的x轴是像素值(0到255)y轴是对应的像素在图像里的数量。
cv2.calcHist()函数
cv2.calcHist(images, channels, mask, histSize, ranges[,hist[,accumulate]])
1.images:这是uint8或者float32的原图。应该是方括号方式传入:“[img]”
2.channels:也是用方括号给出的,我们计算histogram的channel的索引,比如,如果输入时灰度图,值就是[0],对于彩色图片,你可以传[0],[1]和[2]来分别计算蓝色,绿色和红色通道的histogram。
3.mask:掩图,要找到整个图像的histogram,这里传入"None"。但是如果你想找到特定区域图片的histogram,就得创建一个掩图
4.histSize:BIN数量,需要用户方括号传入,对于全刻度,我们传入[256].
5.ranges:RANGE,一般来说是[0,256].
Numpy np.histogram() 和np.bincount()
hist,bins=np.histogram(img.ravel(),256,[0,256])
hist = np.bincount(img.ravel(), minlength=256)
import cv2
from matplotlib import pyplot as plt
img=cv2.imread('touxiang.jpg',0)
hist=cv2.calcHist([img],[0],None,[256],[0,256])
# 绘制直方图

# 使用Matplotlib绘制函数
# matplotlib.pyplot.hist()  它直接找到histogram然后绘制
import cv2
import numpy as np
from matplotlib import pyplot as plt

img = cv2.imread('beijing.jpg',0)
plt.hist(img.ravel(),256,[0,256]); plt.show()#将多维数组降位一维 numpy.ravel()返回视图,在原图操作  与numpy.flatten()返回拷贝,对原图没影响
# 绘制直方图

# 使用Matplotlib绘制函数
# matplotlib的普通绘图,对于BGR绘图不错,但你需要先找到histogram。

img = cv2.imread('smallpig.jpg')
color = ('b','g','r')
for i,col in enumerate(color):#对于一个可迭代的(iterable)/可遍历的对象(如列表、字符串),enumerate将其组成一个索引序列,利用它可以同时获得索引和值

    histr = cv2.calcHist([img],[i],None,[256],[0,256])
    plt.plot(histr,color = col)
    plt.xlim([0,256])
plt.show()
# 使用OpenCV
# 你调整了histogram的值,你可以用cv2.line()或者cv2.polyline()函数来生成
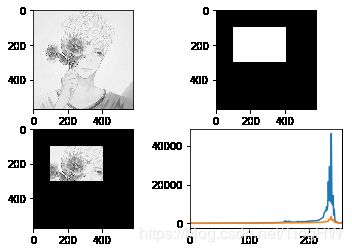
# 使用mask,区域直方图

img = cv2.imread('touxiang.jpg',0)
print(img.shape[:2])
# create a mask
mask = np.zeros(img.shape[:2], np.uint8)
mask[100:300, 100:400] = 255
masked_img = cv2.bitwise_and(img,img,mask = mask)

# Calculate histogram with mask and without mask
# Check third argument for mask
hist_full = cv2.calcHist([img],[0],None,[256],[0,256])
hist_mask = cv2.calcHist([img],[0],mask,[256],[0,256])

plt.subplot(221), plt.imshow(img, 'gray')
plt.subplot(222), plt.imshow(mask,'gray')
plt.subplot(223), plt.imshow(masked_img, 'gray')
plt.subplot(224), plt.plot(hist_full), plt.plot(hist_mask)
plt.xlim([0,256])

plt.show()
(571, 580)


