Python对JSON文件世界人口数据进行可视化
制作世界人口地图,用json模块来处理,将人口数据进行可视化!!!
下载JSON格式的人口数据,下面附上完整的,在网站中https://datahub.io/下载的数据集的详细过程!!!
1、下载世界人口数据
附上网站超链接:https://datahub.io/
网站是纯英文版的(不慌详细流程见下方!)
1、进入界面后在搜索框中输入World population data(即世界人口数据),点击Search Datasets
2、点击第一个中的Explore Dataset
3、向下滑动至Data File,这边的话我们选择压缩包形式,里面包含了csv和json,点击后会出现下载框,下载即可。
4、解压,打开压缩包,这时候我们发现里面有一些文件,这边我们只需要data文件中的数据就行
5、打开csv文件我们发现里面包含了4列数据,如下所示
6、打开json文件,发现这个文件中实际上是一个很长的python列表,每个元素都是包含4个键的字典

到这一步,下载世界人口数据完毕!!!
为了便于操作方便,更快的学习。
这边附上直接下载csv和json压缩包的链接地址:https://pkgstore.datahub.io/core/population/population_zip/data/4e22dd3646c87e44fcaf119d34439291/population_zip.zip
2、提取相关数据
打印json文件中的信息
新建world_population.py文件
将population_json.json文件拖到项目所在的文件夹下

import json         #导入json模块

#将数据添加到一个列表
filename='population_json.json'
with open(filename) as f:
    pop_data=json.load(f)
    #函数json.load()将数据转换为Python能够处理的格式,这里是一个列表

    #打印每个国家2010年人口的数量
for pop_dict in pop_data:
    if pop_dict['Year']==2010:
        country_name = pop_dict["Country Name"]
        population = pop_dict["Value"]
        print(country_name + ":" + str(population))
检查字典中的Year键是否为2010
输出一系列的国家名称和人口数量,效果图如下:

为了便于数据的处理方便,这边将人口数据,先转换为float型,转换为小数,再使用int型将小数部分丢弃,返回一个整数。
在world_population.py文件中修改即可:
population = int(float(pop_dict["Value"]))
3、获取两个字母的国别码
制作地图前,还需要解决数据存在的最后一个问题。Pypal地图制作工具要求数据为特定的格式:用国别码表示国家,以及数字表示人口数量。
Python使用的国别码存储在模块i18n中,字典COUNTRIES包含键和值分别为两个字母的国别码和国家名。
3.1、测试是否存在模块i18n
新建country_codes.py文件
1、测试发现并没有此模块

2、这时候我们需要安装,pip install pygal_maps_world即可,如下所示:

3、从新测试
from  pygal_maps_world.i18n import COUNTRIES
for country_code in sorted(COUNTRIES.keys()):
    print(country_code,COUNTRIES[country_code])
效果图如下:

这时候发现,已经按照我们的要求展示(国别码和国家)
3.2、获取国别码
编写一个函数,在COUNTRIES中查找并返回国别码。将函数放在country_codes的模块中。
在country_codes.py文件中修改
遍历COUNTRIES,查找指定的国家的国别码是否存在
from  pygal_maps_world.i18n import COUNTRIES
def get_country_code(country_name):
    """根据指定的国家,返回Pygal使用的两个字母的国别码"""
    for code,name in COUNTRIES.items():
        if name==country_name:
            return code
    #未找到指定的国家输出None
    return None
print(get_country_code('China'))
print(get_country_code('Andorra'))
print(get_country_code('Afghanistan'))
3.3、在world_population.py文件中导入国别码
在world_population.py文件中修改:
import json         #导入json模块
from matp.population.country_codes import  get_country_code

#将数据添加到一个列表
filename='population_json.json'
with open(filename) as f:
    pop_data=json.load(f)
    #函数json.load()将数据转换为Python能够处理的格式,这里是一个列表

    #打印每个国家2010年人口的数量
for pop_dict in pop_data:
    if pop_dict['Year']==2010:
        country_name = pop_dict["Country Name"]
        population = int(float(pop_dict["Value"]))
        #print(country_name + ":" + str(population))
        code=get_country_code(country_name)
        if code:
            print(code+":"+str(population))
        else:
            print('ERROR-'+country_name)
国家存在即返回国别码和人口
不存在,即返回不存在的名字(并非所有人口数量对应的是国家,有的对应的可能是地区)
效果图如下所示:

4、制作世界地图
有了国别码之后,pygal_maps_world.maps提供了图形类型
4.1、测试北美、中美和南美的简单地图
新建americas.py文件
import pygal_maps_world.maps
wm=pygal_maps_world.maps.World()		#创建实例
wm.title='North,Center,and South America'

wm.add('North America',['ca','mx','us'])
wm.add('Center America',['bz','cr','gt','hn','ni','pa','sv'])
wm.add('South America',['ar','bo','br','cl','co','ec','gf',
                        'gy','pe','py','sr','uy','ve'])
wm.render_to_file('americas.svg')
用浏览器打来创建的americas.svg文件
效果图如下:

4.2、在世界地图上呈现数字数据
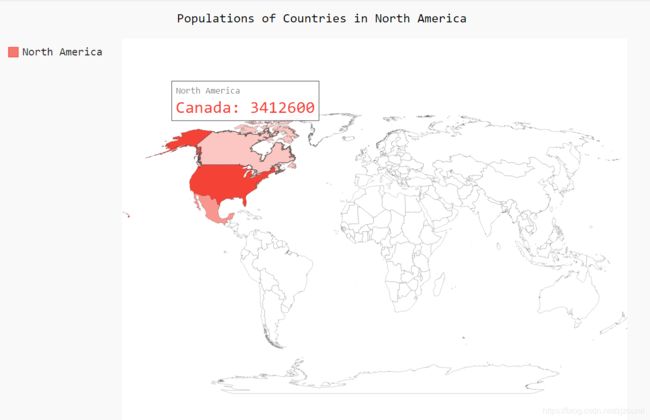
联系在地图上呈现数字数据,创建地图显示三个北美国家的人口数据
新建na_populations.py文件
import pygal_maps_world.maps
wm=pygal_maps_world.maps.World()

wm.title='Populations of Countries in North America'
wm.add('North America',{'ca':3412600,'us':309349000,'mx':113423000})

wm.render_to_file('na_populations.svg')
用浏览器打来创建的americas.svg文件
鼠标放在对应的国家会显示人口数据
效果图如下:

4.3、绘制完整的世界人口地图
要呈现所有国家人口数量,我们先要将所有的数据转换为Pygal要求的字典格式,即国别码和人口数量。
在world_population.py文件中修改:
import json         #导入json模块
from matp.population.country_codes import  get_country_code
import pygal_maps_world.maps

#将数据添加到一个列表
filename='population_json.json'
with open(filename) as f:
    pop_data=json.load(f)
    #函数json.load()将数据转换为Python能够处理的格式,这里是一个列表

#打印每个国家2010年人口的数量
#创建一个包含人口数量的字典
cc_populations={}
for pop_dict in pop_data:
    if pop_dict['Year']==2010:
        country_name = pop_dict["Country Name"]
        population = int(float(pop_dict["Value"]))
        #print(country_name + ":" + str(population))
        code=get_country_code(country_name)
        if code:
            cc_populations[code]=population

wm=pygal_maps_world.maps.World()
wm.title='World Population in 2010,by Country'
wm.add('2010',cc_populations)

wm.render_to_file('World_Population.svg')
cc_populations={}
创建了空字典,用来存储Pypal要求的字典格式要求数据
wm=pygal_maps_world.maps.World()
创建实例,并设置属性
效果图如下:
白色部分未有相关的数据(通过国家名未查询到国别码)

5、根据人口数量将国家分组
通过人口数量分组能够更加明显的显示数据
在world_population.py文件中修改:
创建三个空列表,将所有的国家分成三组
cc_pops_1,cc_pops_2,cc_pops_3={},{},{}
1000万以内,1000万~10亿,10亿以上
import json         #导入json模块
from matp.population.country_codes import  get_country_code
import pygal_maps_world.maps

#将数据添加到一个列表
filename='population_json.json'
with open(filename) as f:
    pop_data=json.load(f)
    #函数json.load()将数据转换为Python能够处理的格式,这里是一个列表

#打印每个国家2010年人口的数量
#创建一个包含人口数量的字典
cc_populations={}
for pop_dict in pop_data:
    if pop_dict['Year']==2010:
        country_name = pop_dict["Country Name"]
        population = int(float(pop_dict["Value"]))
        #print(country_name + ":" + str(population))
        code=get_country_code(country_name)
        if code:
            cc_populations[code]=population

#根据人口数量将所有的国家分成三组
cc_pops_1,cc_pops_2,cc_pops_3={},{},{}
for cc,pop in cc_populations.items():
    if pop<10000000:
        cc_pops_1[cc] = pop
    elif pop < 1000000000:
        cc_pops_2[cc] = pop
    else:
        cc_pops_3[cc] = pop

#看看每组分别包含多少个国家
print(len(cc_pops_1),len(cc_pops_2),len(cc_pops_3))

wm=pygal_maps_world.maps.World()
wm.title='World Population in 2010,by Country'
wm.add('0~10m',cc_pops_1)
wm.add('10m~1bm',cc_pops_2)
wm.add('>1bm',cc_pops_3)

wm.render_to_file('World_Population.svg')
结果显示在1000万以内的国家有81个,1000万~10亿以内的有71个国家,大于10亿的有两个国家

效果图如下所示:

6、使用Pygal设置世界地图的样式
给定Pygal使用一种基色,指定该基色,并让三个分组颜色差异更大。
6.1、指定基色
在world_population.py文件中添加即修改:
from pygal.style import RotateStyle

wm_style=RotateStyle('#336699')
wm=pygal_maps_world.maps.World(style=wm_style)
#wm=pygal_maps_world.maps.World()给原先的实例附上样式style=wm_style
6.2、加亮颜色主题
Pygal通常默认使用较暗的颜色主题,为了方便印刷,可以使用LightColorizedStyle加亮地图的颜色,这个类修改了整个图标的主题,包括背景色、标签以及各个国家的颜色。
先导入:
from pygal.style import LightColorizedStyle

wm_style=LightColorizedStyle
使用LightColorizedStyle类时,不能直接控制使用颜色,Pygal所以使用了默认的基色,要设置颜色,则使用RotateStyle,并将LightColorizedStyle作为基本样式
导入:
from pygal.style import LightColorizedStyle,RotateStyle

wm_style=RotateStyle('#336699',base_style=LightColorizedStyle)
综上世界人口数据可视化完毕!!!
附上完整的world_population.py和country_codes.py和americas.py和na_populations.py文件
world_population.py
import json         #导入json模块
from matp.population.country_codes import  get_country_code
import pygal_maps_world.maps
from pygal.style import LightColorizedStyle,RotateStyle


#将数据添加到一个列表
filename='population_json.json'
with open(filename) as f:
    pop_data=json.load(f)
    #函数json.load()将数据转换为Python能够处理的格式,这里是一个列表

#打印每个国家2010年人口的数量
#创建一个包含人口数量的字典
cc_populations={}
for pop_dict in pop_data:
    if pop_dict['Year']==2010:
        country_name = pop_dict["Country Name"]
        population = int(float(pop_dict["Value"]))
        #print(country_name + ":" + str(population))
        code=get_country_code(country_name)
        if code:
            cc_populations[code]=population

#根据人口数量将所有的国家分成三组
cc_pops_1,cc_pops_2,cc_pops_3={},{},{}
for cc,pop in cc_populations.items():
    if pop<10000000:
        cc_pops_1[cc] = pop
    elif pop < 1000000000:
        cc_pops_2[cc] = pop
    else:
        cc_pops_3[cc] = pop

#看看每组分别包含多少个国家
print(len(cc_pops_1),len(cc_pops_2),len(cc_pops_3))

wm_style=RotateStyle('#336699',base_style=LightColorizedStyle)
wm=pygal_maps_world.maps.World(style=wm_style)
wm.title='World Population in 2010,by Country'
wm.add('0~10m',cc_pops_1)
wm.add('10m~1bm',cc_pops_2)
wm.add('>1bm',cc_pops_3)

wm.render_to_file('World_Population.svg')
country_codes.py
from  pygal_maps_world.i18n import COUNTRIES
def get_country_code(country_name):
    """根据指定的国家,返回Pygal使用的两个字母的国别码"""
    for code,name in COUNTRIES.items():
        if name==country_name:
            return code
    #未找到指定的国家输出None
    return None
print(get_country_code('China'))
print(get_country_code('Andorra'))
print(get_country_code('Afghanistan'))
americas.py
import pygal_maps_world.maps
wm=pygal_maps_world.maps.World()            #创建实例
wm.title='North,Center,and South America'

wm.add('North America',['ca','mx','us'])
wm.add('Center America',['bz','cr','gt','hn','ni','pa','sv'])
wm.add('South America',['ar','bo','br','cl','co','ec','gf',
                        'gy','pe','py','sr','uy','ve'])
wm.render_to_file('americas.svg')
na_populations.py
import pygal_maps_world.maps
wm=pygal_maps_world.maps.World()

wm.title='Populations of Countries in North America'
wm.add('North America',{'ca':3412600,'us':309349000,'mx':113423000})

wm.render_to_file('na_populations.svg')


