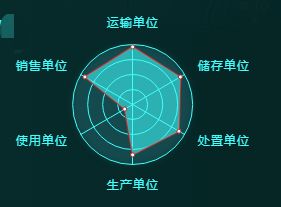
Echarts雷达图之样式更改
本篇博文讲述雷达图的使用,
具体各项属性参考下方代码,有相关注释。
var myChart3 = echarts.init(document.getElementById('bbb'));

option3 = {
    radar: [{
        indicator: [{
                text: '运输单位'
            },
            {
                text: '销售单位'
            },
            {
                text: '使用单位'
            },
            {
                text: '生产单位'
            },
            {
                text: '处置单位'
            },
            {
                text: '储存单位'
            }
        ],
        center: ['46%', '50%'], // 位置
        radius: 60, //大小
        startAngle: 90,
        splitNumber: 4,
        shape: 'circle',
        name: {
            formatter: '{value}',
            textStyle: {
                color: 'aqua' // 文字颜色
            }
        },
        splitArea: {
            areaStyle: {
                color: ['rgba(114, 172, 209, 0.1)',
                    'rgba(114, 172, 209, 0.1)', 'rgba(114, 172, 209, 0.1)',
                    'rgba(114, 172, 209, 0.1)', 'rgba(114, 172, 209, 0.1)'
                ], //圆环颜色
                shadowColor: 'aqua', // 圆颜色
                shadowBlur: 10
            }
        },
        axisLine: {
            lineStyle: {
                color: 'aqua' // 分割线
            }
        },
        splitLine: {
            lineStyle: {
                color: 'aqua' //圆线
            }
        }
    }],
    series: [{
        name: '雷达图',
        type: 'radar',
        itemStyle: {
            emphasis: {
                // color: 各异,
                lineStyle: {
                    width: 4
                }
            }
        },
        data: [{
            value: [5678, 3678, -6781, 1678, 1780, 3671],
            areaStyle: {
                normal: {
                    color: 'rgba(0, 255, 255, 0.8)' // 选择区域颜色
                }
            }
        }]
    }]
}

// 为echarts对象加载数据
myChart3.setOption(option3);
- 效果
